 🏗️ New Construction
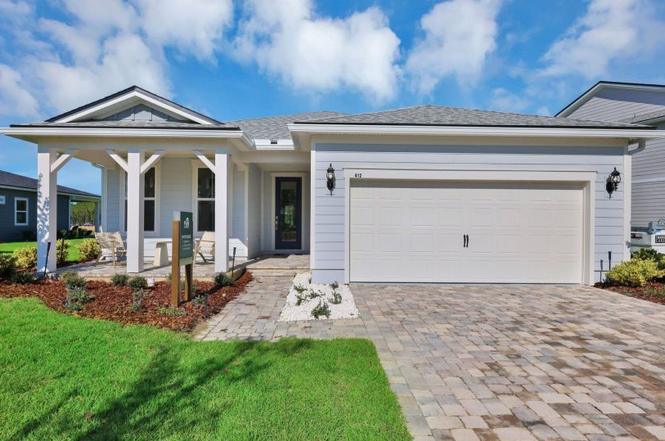
Mystique Plan · Yulee, FL
Flood risk No data
- FEMA flood zone
- —
- Chance of flooding over 30 yrs
- —
- Est. flood insurance / yr
- —
Fire risk No data
- Est. fire insurance / yr
- —
Heat risk No data
- Hot days now (above threshold)
- —
- Hot days in 30 yrs
- —
Wind risk No data
- Chance of severe wind over 30 yrs
- —
Air-quality risk No data
- Unhealthy air days now
- —
- Unhealthy air days in 30 yrs
- —
Risk factors via First Street. Map © Google.
Why this score? — see what drove the D- grade
The composite is a weighted blend of 9 inputs, each scored 0–100. Each bar is that input's sub-score; the figure is the points it added to the 100-point composite (weight × sub-score).
- Appreciation +10.0/10.0
- ARV discount +7.5/15.0
- Schools +6.0/10.0
- Cash flow +4.3/30.0
- Livability +3.3/5.0
- Rent growth +3.2/5.0
- Condition / age +2.5/5.0
- 1% rule +0.4/10.0
- DSCR +0.0/10.0
$424,990
🖨 Deal sheet (PDF) 📄 Offer letter ✓ Due diligence
Listing remarks
The Mystique features an eye-catching gourmet kitchen with a quartz countertop island overlooking a spacious gathering room. Walk through beautiful pocket sliding doors and into a large backyard with covered lanai and optional outdoor prep kitchen perfect for entertaining. Retreat into a cozy Owner's Suite with walk-in shower and closet! This home is designed to fit all your lifestyle needs.
Key facts
- Outdoor prep kitchen
- Large backyard
- Gourmet kitchen
Tags
Property features AI
Finance
- Other: Address listed as 400 Peppervine Way, Wildlight FL 32097
- Financial info: List price $422,490
Exterior
- Parking: 2 garage spaces (2 total parking spaces)
- Home design: New construction plan named Mystique; Active listing
- Exterior features: Living area of 2140
Interior
- Bedrooms: 3 bedrooms
- Bathrooms: 3 full bathrooms
- Interior features: 3 full bathrooms
Neighborhood map
What this means for you Summary
Snapshot
- This is a 3-bed/3.0-bath single-family listed at $425k.
Deal economics
- At list price, monthly cash flow is $-1k ($-17k/yr) — negative.
- To cash-flow at today's rent, offer at most $321k (24.5% below list).
- To meet the 1% rule (rent ≥ 1% of price), the offer needs to be $281k (34.0% below list).
- Recommended offer: $281k (34.0% below list) — sets the bar for 1% rule.
Location & tenants
- Location reads 66/100 on livability (#605 in FL) — a middle-class / working-renter tenant base. Strengths: housing A+, cost of living A-, crime B+; Watch: amenities F, commute F, health & safety F.
- Nassau (town): math 74% / reading 65% proficiency, ranked #4 of 73 in FL (top 6%) — acceptable for families but not a draw, mixed tenant base, ~2y average lease.
- Market conditions: Rents rising (+2.9%/yr); 601 active listings in the ZIP; 5 comparable units currently listed for rent nearby; rentals at typical pace (median 23d on market — plan ~3-4 weeks tenant-placement turnaround); solid renter incomes; 953 units permitted in Nassau County in 2024 (24 in 5+ unit buildings).
- This rent runs 36% of the median local income ($93k/yr) — at the standard rent-burdened threshold; future hikes will face affordability resistance.
Forward outlook
- In year one you build about $56k of equity ($4k loan paydown + $52k appreciation (10.0% local appreciation)).
- Nassau County population projected at +17% by 2050 — long-run rental-demand tailwind backs the buy-and-hold thesis.
- By year 2, paydown + projected appreciation supports a ~$90k cash-out refi (75% LTV) — recoverable capital for the next deal without selling this one.
Negotiation context
- It's been on market 260 days — a 12% lower offer ($374k) is reasonable based on typical stale-listing flexibility.
Questions for the listing agent
- What do current leases actually rent for vs. the listed asking? Can we see a recent rent roll and the last 12 months of T-12 income?
- It's been on market 260 days. Have you received any prior offers? Is the seller open to a 34% concession, seller financing, or rate buy-down credit?
- Why hasn't it sold? Are there any deal-killer items the seller is aware of (foundation, flood, title, zoning, code violations)?
- Is there a deadline driving the sale (1031 exchange, divorce, estate, relocation)? That informs how much negotiation room exists.
- Schools are B-rated — typically a magnet for longer-tenancy family renters. What's the average tenant stay here, and is there a school-zone premium baked into asking?
- The area grade is low — what's the realistic commute time and amenity access for the typical tenant pool here? Any planned neighborhood developments (good or bad) we should know about?
- What's the average days-on-market for RENTAL listings here right now (not sales)? A rising rental-DOM trend means longer vacancies and softer asking-rent achievability than the comps imply.
- What's the recent tenant-quality profile in this submarket — average credit score on applications, eviction rate, late-payment / NSF rate, and stable-employment percentage? A property-management company in the area should have these aggregated.
- How much new for-sale + rental construction is in the pipeline within 1–3 miles? Heavy new supply typically softens prices + rents 12–24 months out; constrained supply supports both.
Investment metrics
- 1% rule
- 0.54% ✗
- Cap rate
- 3.07%
- Cash-on-cash
- -11.50%
- DSCR
- 0.49
- GRM
- 15.6
CMA / ARV
- ARV (on-the-fly)
- $524,300
- Comps found
- 8
Show comp detail 8 sales within ~0.75 mi
| Address | Dist | Beds/Ba | Sqft | Sold | Price | $/sf | Match |
|---|---|---|---|---|---|---|---|
| 295 Westerly Dr | 0.16mi | 4/3.0 (+1) | 2,139 (-0%) | 0mo | $446,590 | $209 | 87 |
| 493 Peppervine Way | 0.11mi | 4/3.0 (+1) | 2,139 (-0%) | 4mo | $479,000 | $224 | 87 |
| 1065 Del Webb Pkwy | 0.55mi | 2/2.5 (-1) | 1,989 (-7%) | 2mo | $845,019 | $425 | 54 |
| 1404 Del Webb Pkwy | 0.68mi | 3/2.5 | 1,989 (-7%) | 4mo | $659,990 | $332 | 51 |
| 425 Sweetgum St | 0.56mi | 4/3.0 (+1) | 2,400 (+12%) | 10mo | $558,000 | $233 | 40 |
| 247 Sawgrass Dr | 0.72mi | 4/3.0 (+1) | 2,280 (+6%) | 14mo | $615,000 | $270 | 39 |
| 231 Sawgrass Dr | 0.72mi | 4/3.0 (+1) | 2,236 (+4%) | 23mo | $547,750 | $245 | 35 |
| 706 Loblolly Ln | 0.71mi | 3/2.0 | 1,873 (-12%) | 15mo | $430,000 | $230 | 30 |
Match score weights: distance 35% · size 25% · config 20% · recency 20%. Top-matched comps best support the ARV.
Projected returns pro-forma
10.0% appreciation · 2.88% rent growth · sell at horizon
- IRR
- 16.2%
- Equity multiple
- 2.33×
- Total profit
- $195,661
- Equity at exit
- $472,331
- IRR
- 15.5%
- Equity multiple
- 5.40×
- Total profit
- $646,043
- Equity at exit
- $1,018,600
Cash invested: $146,804 (down + closing). Projections, not guarantees.
Landlord ↔ Tenant lean methodology
- Overall (STATE)
- 87 Strongly Landlord-Friendly
- State Florida
- 87 Strongly Landlord-Friendly · R+3
- County
- — inherits STATE
- City
- — inherits STATE
ZIP-level market 32097
- Home prices YoY
- 19.5%
- Rents YoY
- 2.9%
- Active inventory
- 601
- Price-to-rent
- 12.6×
Monthly cashflow live
- Estimated rent
- $2,806 high interval (Pro) →
- Mortgage (P&I)
- −$2,749
- Tax est. 1.5%
- −$655 /mo · $7,864/yr
- Insurance
- −$218
- HOA
- −$0
- Vacancy / Maint / Mgmt
- −$589
- Net cashflow
- $-1,407
Break-even live
Sensitivity live
| Price | -10% $-1,044 | -5% $-1,225 | +0% $-1,407 | +5% $-1,588 | +10% $-1,769 |
|---|---|---|---|---|---|
| Rent | -10% $-1,628 | -5% $-1,517 | +0% $-1,407 | +5% $-1,296 | +10% $-1,185 |
| Rate | -1.0pp $-1,143 | -0.5pp $-1,273 | base $-1,407 | +0.5pp $-1,543 | +1.0pp $-1,681 |
UW: 25.0% down · 7.5% · 30yr · 1.5% tax · 5.0% vac · 8.0% maint · 8.0% mgmt
Financing live
Cash to close
- Down payment
- $131,075
- Closing costs
- $15,729
- Reserves months
- —
- Total cash needed
- —
Loan-product check · same deal, 3 products live
Conventional
25% down · 7.5% · 30yr
- Down + closing
- —
- Monthly P&I
- —
- Monthly cashflow
- —
- DSCR
- —
- Eligible?
- —
Personal DTI + credit; lowest rate.
DSCR
20% down · 8.5% · 30yr
- Down + closing
- —
- Monthly P&I
- —
- Monthly cashflow
- —
- DSCR
- —
- Eligible?
- —
No personal income docs; deal must DSCR.
Hard money
10% down · 12.0% · 12mo
- Down + closing
- —
- Monthly P&I
- —
- Monthly cashflow
- —
- DSCR
- —
- Eligible?
- —
Short-term bridge; refi at stabilization.
Rent comps 5 comps
| Address | Beds | Baths | Sqft | Rent | $/sqft | DOM | Units | Dist |
|---|---|---|---|---|---|---|---|---|
| 305 Whitby Dr Yulee, FL | 1.0–3.0 | 1.0–2.5 | 1279 | $2,815 | $2.20 | 3d | 45 | 0.15mi |
| 504 Blue Daze St Yulee, FL | 3.0 | 2.5 | 2038 | $2,595 | $1.27 | 25d | 1 | 0.62mi |
| 213 Daydream Ave Yulee, FL | 3.0 | 2.5 | 1876 | $2,950 | $1.57 | 25d | 1 | 0.89mi |
| 722 Cool Breeze Way Yulee, FL | 2.0 | 2.0 | 1541 | $3,100 | $2.01 | 22d | 1 | 0.95mi |
| 719 Cool Breeze Way Yulee, FL | 3.0 | 2.0 | 1575 | $2,995 | $1.90 | 13d | 1 | 0.97mi |
Listing history 15 events
-
2026-06-21days on market $424,990 Active 260 DOM
-
2026-06-18days on market $424,990 Active 257 DOM
-
2026-06-17days on market $424,990 Active 256 DOM
-
2026-06-16days on market $424,990 Active 255 DOM
-
2026-06-15days on market $424,990 Active 254 DOM
-
2026-06-13days on market $424,990 Active 252 DOM
-
2026-06-13days on market $424,990 Active 251 DOM
-
2026-06-09days on market $424,990 Active 248 DOM
-
2026-06-08days on market $424,990 Active 247 DOM
-
2026-06-07days on market $424,990 Active 246 DOM
-
2026-06-05pricedays on market $424,990 Active 243 DOM
-
2026-06-03days on market $422,490 Active 242 DOM
-
2026-06-02days on market $422,490 Active 241 DOM
-
2026-06-01days on market $422,490 Active 240 DOM
-
2026-05-31days on market $422,490 Active 239 DOM
ⓘ Source: listings_history table (triggers on properties + properties_extension) + one-shot
backfill from property_details.listing_events for pre-trigger history.
Nearby sold comps map
Loading sold comps map…
Walkable amenities ~0.75 mi
Loading nearby amenities…
Taxation est. · year 1
- Rental income
- $33,671
- − Mortgage interest
- −$29,369
- − Property taxes
- −$7,864
- − Insurance
- −$2,622
- − Repairs & maintenance
- −$2,694
- − Management
- −$2,694
- − Depreciation
- −$15,252
- Taxable loss
- −$26,824
- Est. tax savings @ 24.0%
- +$6,438
- After-tax cash flow
- $-10,442/yr
For passive investors: Depreciation is non-cash, so a rental often shows a tax loss while cash-flowing — sheltering income. Rental losses are passive: they offset passive income freely, and up to $25,000/yr can offset ordinary (W-2) income if you actively participate and your MAGI is under $100k (phasing out to $0 by $150k); unused losses carry forward. On sale, claimed depreciation is recaptured at up to 25%, and gains may owe capital-gains tax (a 1031 exchange can defer both). Figures are a year-1 estimate at your 24.0% rate — not tax advice; consult a CPA.
Schools (NCES district)
- District
- Nassau
- NCES district ID
- 1201350
- Math proficiency
- 74% ▼ -2.00%
- Reading proficiency
- 65% ▼ -2.00%
- Median HH income
- $58,267
- Composite
- 59.79/100
- National rank
- #899
- State rank
- #4 of 73 in FL
Livability — Yulee
- Score
- 66/100
- State rank
- #605
- US rank
- #11615
Category grades
Schools grade is shown separately in the Schools card above.
Census & demographics
- County
- Nassau County · 67,729 people
- City population
- 26,700
- Metro
- Jacksonville, FL
- Population (ZIP)
- 26,700
- Household income
- $93,161
- Rent vs Own
- Severe rent burden
- 404.0
Population outlook (Nassau County) Hauer SSP2
- Today (2025)
- 88,419 people
- By 2030
- 92,679 · +4.8%
- By 2040
- 99,257 · +12.3%
- By 2050
- 103,378 · +16.9%
- By 2075
- 109,726 · +24.1%
- By 2100
- 107,006 · +21.0%
Race, ethnicity, and origin ACS 2023
- Neighborhood character
- Predominantly White (75%)
- Race & ethnicity
- White 75% Two or more races 9% Black 9% Hispanic / Latino 8% Asian 1% Native American 1%
- Hispanic origin (detail)
- Mexican 2% Puerto Rican 2%
- Common ancestry
- Lithuanian 4% Italian 3% Romanian 2%
- Foreign-born
- 4% · Canada, Vietnam
- Languages at home
- 93% English-only · Spanish 5% Vietnamese 1%
Political lean MEDSL · Nassau
- 2024 margin
- Solid R (+46.9) · D 26.1% · R 73.1%
- 2008→2024 swing
- -3.1pp toward R · 2008: -43.8pp · 2024: -46.9pp
- All cycles
- 2024: R+46.9 2020: R+45.9 2016: R+50.2 2012: R+48.6 2008: R+43.8
Not yet ingested
- Civics
- —
Market trends
- HPI YoY
- ▲ 49.35%
- Current HPI
- 301.9299
- Rent YoY
- ▲ 2.88%
- Metro
- Jacksonville, FL
- State GDP YoY
- ▲ 3.28%
- F500 in state
- 36
Industry mix (Fortune 500 HQ in FL)
| Industry | F500 HQs | Revenue |
|---|---|---|
| Industrial Technology | 2 | $29B |
|
||
| Insurance | 2 | $17B |
|
||
| Retail | 1 | $60B |
|
||
| Technology Distribution | 1 | $58B |
|
||
| Homebuilding | 1 | $35B |
|
||
| Technology Manufacturing | 1 | $35B |
|
||
Cash-flow waterfall
monthlySold comps — $/sqft
last 12 mo · ≤1 miLoading sold comps…