121 NE 34th St #1203 · Miami, FL
Flood risk 1/10 · Minimal
- FEMA flood zone
- X (unshaded)
- Chance of flooding over 30 yrs
- 0.0%
- Est. flood insurance / yr
- $507 – $1,088
Fire risk 1/10 · Minimal
- Est. fire insurance / yr
- $947 – $1,759
Heat risk 10/10 · Severe
- Hot days now (above 103°F)
- 6 days/yr
- Hot days in 30 yrs
- 24 days/yr
Wind risk 10/10 · Severe
- Chance of severe wind over 30 yrs
- 99.0%
Air-quality risk 2/10 · Minimal
- Unhealthy air days now
- 1 days/yr
- Unhealthy air days in 30 yrs
- 1 days/yr
Risk factors via First Street. Map © Google.
Why this score? — see what drove the F grade
The composite is a weighted blend of 9 inputs, each scored 0–100. Each bar is that input's sub-score; the figure is the points it added to the 100-point composite (weight × sub-score).
- ARV discount +7.5/15.0
- Appreciation +5.1/10.0
- Schools +4.2/10.0
- Livability +3.9/5.0
- Rent growth +3.2/5.0
- Cash flow +3.0/30.0
- 1% rule +2.5/10.0
- Condition / age +2.5/5.0
- DSCR +0.0/10.0
$519,000
🖨 Deal sheet (PDF) 📄 Offer letter ✓ Due diligence
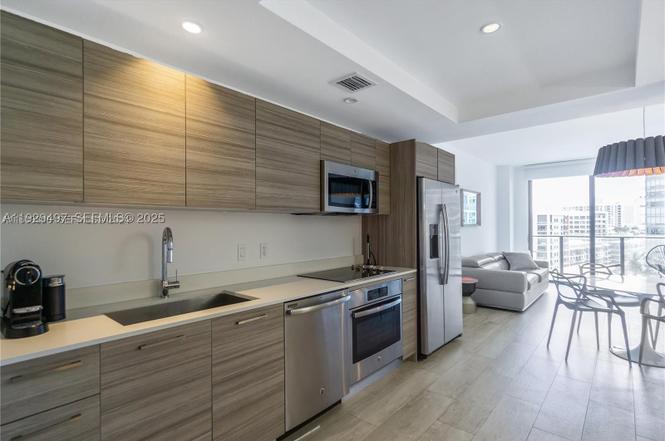
Listing remarks
Stunning 1 bedroom apartment in Hyde Midtown. The building is pretty new and the amenities are amazing! Huge pool, Spa, fitness center, game room, business center, kids room, theater room. .. . 1 Parking thru valet is included. The 1 bedroom 1 bathroom plus den apartment has been tastefully furnished and is completely equipped. Wood porcelain floor all over, Italian style full kitchen with stainless steel appliances, washer and dryer.
Key facts
- Business center
- Fitness center
- Theater room
Tags
Property features AI
Finance
- Financial info: Pets allowed with restrictions or possible restrictions (conditional)
- HOA & community: Monthly association fee (includes association management, amenities, cable TV, hot water, internet, grounds and structure maintenance, parking, pool(s), recreation facilities, sewer, security, trash, water); Association offers billiard room, bike storage, business center, cabana, clubhouse, fitness center, playground, pool, spa/hot tub, tennis court(s), trash service, elevators
Exterior
- Parking: Attached covered garage; Garage with door opener; Valet parking available; 1 garage space
- Security: Closed-circuit cameras; Secured elevator; Fire alarm; Secured garage/parking; Secured lobby; Security guard; Smoke detectors
- Utilities: Cable available; Association provides hot water, water, sewer, trash, internet
- Home design: Condominium/high-rise; 31 total stories; Entry on level 12; Has a view
- Construction: Block construction; Effective year built
- Exterior features: Balcony; Open balcony/patio; Tennis court(s); Association pool (heated)
Interior
- Kitchen: Built-in oven; Self-cleaning oven; Electric range; Microwave; Dishwasher; Disposal; Icemaker; Refrigerator
- Bedrooms: Bedroom on main level
- Flooring: Ceramic tile
- Bathrooms: 1 full bathroom
- Heating & cooling: Central air conditioning
- Interior features: Furnished; Built-in features; Dual sinks; First-floor entry; Living/dining room; Tub with shower; Walk-in closet(s); Elevator
- Laundry & utility: Washer; Dryer
Neighborhood map
What this means for you Summary
Snapshot
- This is a 1-bed/1.0-bath condo listed at $519k.
Deal economics
- At list price, monthly cash flow is $-2k ($-20k/yr) — negative.
- To cash-flow at today's rent, offer at most $427k (17.8% below list).
- To meet the 1% rule (rent ≥ 1% of price), the offer needs to be $388k (25.2% below list).
- Recommended offer: $388k (25.2% below list) — sets the bar for 1% rule.
- Cap rate 2.4% vs local median 1.9% in Miami — meaningfully above typical; check what's discounted (condition, days-on-market, listing class) to confirm the premium yield is real.
Location & tenants
- Location reads 78/100 on livability (#177 in FL, #2,724 nationally) — a middle-class / working-renter tenant base. Strengths: amenities A+, commute A+, health & safety A+; Watch: employment C-, crime F, cost of living F.
- Miami-Dade (suburban): math 45% / reading 54% proficiency, ranked #40 of 73 in FL (top 55%) — families likely to look elsewhere, expect single-tenant / working-renter base with shorter leases; 64% free/reduced lunch — lower-income household profile, screen leases tightly.
- Market conditions: Rents rising (+2.7%/yr); 757 active listings in the ZIP; 1 comparable units currently listed for rent nearby; solid renter incomes; 10,051 units permitted in Miami-Dade County in 2024 (7,758 in 5+ unit buildings).
- At $3,883/mo this rent would consume 50% of the median local household income ($94k/yr) (locally 3106% of renters already pay >50% of income on rent) — very limited rent-growth headroom before tenants either downsize or default.
Forward outlook
- In year one you build about $5k of equity ($4k loan paydown + $1k appreciation (0.3% local appreciation)).
- Miami-Dade County population projected at +28% by 2050 — long-run rental-demand tailwind backs the buy-and-hold thesis.
- By year 6, paydown + projected appreciation supports a ~$33k cash-out refi (75% LTV) — recoverable capital for the next deal without selling this one.
Negotiation context
- It's been on market 192 days — a 12% lower offer ($457k) is reasonable based on typical stale-listing flexibility.
- 3 sale attempts since 2y ago; this cycle's ask is 14729% above the opening price — seller raised mid-cycle; expect resistance to lowballs.
Risks & watch-outs
- Watch-outs: HOA is 30% of rent.
- Climate carrying-cost: severe wind risk, 99% chance of damaging wind over 30y; extreme-heat days projected 6→24/yr by 2055 (HVAC capex compounding) — expect insurance premiums to compound above CPI over the hold.
Questions for the listing agent
- What do current leases actually rent for vs. the listed asking? Can we see a recent rent roll and the last 12 months of T-12 income?
- It's been on market 192 days. Have you received any prior offers? Is the seller open to a 25% concession, seller financing, or rate buy-down credit?
- What does the HOA fee cover, when was the last increase, and are there any pending special assessments or reserve-fund shortfalls?
- Any open or pending special assessments — roof, HVAC, plumbing, elevator, façade? What's the per-unit balance and payoff schedule, and is the seller paying it off at close or rolling it to the buyer?
- Why hasn't it sold? Are there any deal-killer items the seller is aware of (foundation, flood, title, zoning, code violations)?
- Is there a deadline driving the sale (1031 exchange, divorce, estate, relocation)? That informs how much negotiation room exists.
- Schools are B-rated — typically a magnet for longer-tenancy family renters. What's the average tenant stay here, and is there a school-zone premium baked into asking?
- Crime grade is F in this area — have there been break-ins, vandalism, or insurance claims at this property in the last 3 years? What carrier currently insures it and at what premium?
- The area grade is low — what's the realistic commute time and amenity access for the typical tenant pool here? Any planned neighborhood developments (good or bad) we should know about?
- What's the average days-on-market for RENTAL listings here right now (not sales)? A rising rental-DOM trend means longer vacancies and softer asking-rent achievability than the comps imply.
- What's the recent tenant-quality profile in this submarket — average credit score on applications, eviction rate, late-payment / NSF rate, and stable-employment percentage? A property-management company in the area should have these aggregated.
- How much new apartment / multifamily construction is in the pipeline within 1–3 miles? Heavy new supply (>2% of stock underway) typically softens rents 12–24 months out; light construction supports rent growth.
Investment metrics
- 1% rule
- 0.75% ✗
- Cap rate
- 2.42%
- Cash-on-cash
- -13.83%
- DSCR
- 0.38
- GRM
- 11.1
CMA / ARV
No comps found within radius.
Projected returns pro-forma
0.27% appreciation · 2.73% rent growth · sell at horizon
- IRR
- -16.8%
- Equity multiple
- 0.21×
- Total profit
- $-115,447
- Equity at exit
- $157,796
- IRR
- -10.3%
- Equity multiple
- -0.12×
- Total profit
- $-163,320
- Equity at exit
- $195,436
Cash invested: $145,320 (down + closing). Projections, not guarantees.
Landlord ↔ Tenant lean methodology
- Overall (STATE)
- 87 Strongly Landlord-Friendly
- State Florida
- 87 Strongly Landlord-Friendly · R+3
- County
- — inherits STATE
- City
- — inherits STATE
ZIP-level market 33137
- Home prices YoY
- 0.1%
- Rents YoY
- 2.7%
- Active inventory
- 757
- Price-to-rent
- 11.1×
Monthly cashflow live
- Estimated rent
- $3,883 medium interval (Pro) →
- Mortgage (P&I)
- −$2,722
- Tax from tax record
- −$653 /mo · $7,834/yr
- Insurance
- −$216
- HOA est. from 9 same-building comps
- −$1,151
- Vacancy / Maint / Mgmt
- −$815
- Net cashflow
- $-1,675
Break-even live
Sensitivity live
| Price | -10% $-1,381 | -5% $-1,528 | +0% $-1,675 | +5% $-1,821 | +10% $-1,968 |
|---|---|---|---|---|---|
| Rent | -10% $-1,981 | -5% $-1,828 | +0% $-1,675 | +5% $-1,521 | +10% $-1,368 |
| Rate | -1.0pp $-1,413 | -0.5pp $-1,543 | base $-1,675 | +0.5pp $-1,809 | +1.0pp $-1,946 |
UW: 25.0% down · 7.5% · 30yr · 1.5% tax · 5.0% vac · 8.0% maint · 8.0% mgmt
Financing live
Cash to close
- Down payment
- $129,750
- Closing costs
- $15,570
- Reserves months
- —
- Total cash needed
- —
Loan-product check · same deal, 3 products live
Conventional
25% down · 7.5% · 30yr
- Down + closing
- —
- Monthly P&I
- —
- Monthly cashflow
- —
- DSCR
- —
- Eligible?
- —
Personal DTI + credit; lowest rate.
DSCR
20% down · 8.5% · 30yr
- Down + closing
- —
- Monthly P&I
- —
- Monthly cashflow
- —
- DSCR
- —
- Eligible?
- —
No personal income docs; deal must DSCR.
Hard money
10% down · 12.0% · 12mo
- Down + closing
- —
- Monthly P&I
- —
- Monthly cashflow
- —
- DSCR
- —
- Eligible?
- —
Short-term bridge; refi at stabilization.
Rent comps 1 comps
| Address | Beds | Baths | Sqft | Rent | $/sqft | DOM | Units | Dist |
|---|---|---|---|---|---|---|---|---|
| 2900 Biscayne Blvd Miami, FL | 3.0 | 1.0–3.5 | 1260 | $8,110 | $6.44 | 3d | 13 | 0.28mi |
HOA detail condo
- Monthly dues
- $0 · $0/yr
- Likely covers
- poolgym
- Assessments
- None detected in remarks — confirm with the listing agent.
Listing history 20 events
-
2026-06-21days on market $519,000 Active 192 DOM
-
2026-06-18days on market $519,000 Active 189 DOM
-
2026-06-17days on market $519,000 Active 188 DOM
-
2026-06-16days on market $519,000 Active 187 DOM
-
2026-06-15days on market $519,000 Active 186 DOM
-
2026-06-13days on market $519,000 Active 184 DOM
-
2026-06-09days on market $519,000 Active 180 DOM
-
2026-06-08days on market $519,000 Active 179 DOM
-
2026-06-07days on market $519,000 Active 178 DOM
-
2026-06-04days on market $519,000 Active 175 DOM
-
2026-06-03days on market $519,000 Active 174 DOM
-
2026-06-02days on market $519,000 Active 173 DOM
-
2026-06-01days on market $519,000 Active 172 DOM
-
2026-05-31days on market $519,000 Active 171 DOM
-
2026-03-14historical $3,500
-
2026-02-10$3,500
-
2025-12-11$519,000 Active
-
2024-09-04historical $3,700
-
2024-07-03$4,000
-
2018-03-05soldstatus $465,900
ⓘ Source: listings_history table (triggers on properties + properties_extension) + one-shot
backfill from property_details.listing_events for pre-trigger history.
Tax reassessment forecast FL · Resets to sale price
- Current annual tax
- $7,834 · $653/mo
- Projected year-2 tax
- $7,834 · $653/mo
- Expected delta
- $0/yr ($0/mo · 0.0%)
ⓘ Screening estimate from a state-policy table — verify with the county assessor before closing.
Climate risk First Street
- Flood 1/10 Low FEMA zone X (unshaded) · 0% chance over 30 yrs
- Wildfire 1/10 Low
- Heat 10/10 Extreme 6 d/yr ≥103°F today · 24 d/yr by 30 yrs out
- Wind 10/10 Extreme 99% chance of damaging wind over 30 yrs
- Air quality 2/10 Low 1 unhealthy d/yr today · 1 by 30 yrs out
Nearby sold comps map
Loading sold comps map…
Walkable amenities ~0.75 mi
Loading nearby amenities…
Taxation est. · year 1
- Rental income
- $46,592
- − Mortgage interest
- −$29,072
- − Property taxes
- −$7,834
- − Insurance
- −$2,595
- − Repairs & maintenance
- −$3,727
- − Management
- −$3,727
- − HOA
- −$13,812
- − Depreciation
- −$15,098
- Taxable loss
- −$29,274
- Est. tax savings @ 24.0%
- +$7,026
- After-tax cash flow
- $-13,068/yr
For passive investors: Depreciation is non-cash, so a rental often shows a tax loss while cash-flowing — sheltering income. Rental losses are passive: they offset passive income freely, and up to $25,000/yr can offset ordinary (W-2) income if you actively participate and your MAGI is under $100k (phasing out to $0 by $150k); unused losses carry forward. On sale, claimed depreciation is recaptured at up to 25%, and gains may owe capital-gains tax (a 1031 exchange can defer both). Figures are a year-1 estimate at your 24.0% rate — not tax advice; consult a CPA.
Schools (NCES district)
- District
- Miami-Dade
- NCES district ID
- 1200390
- Math proficiency
- 45% ▼ -16.00%
- Reading proficiency
- 54% ▼ -5.00%
- Median HH income
- $43,928
- Composite
- 41.76/100
- National rank
- #3397
- State rank
- #40 of 73 in FL
Livability — Miami
- Score
- 78/100
- State rank
- #177
- US rank
- #2724
Category grades
Schools grade is shown separately in the Schools card above.
Census & demographics
- Census place
- Miami, FL
- County
- Miami-Dade County · 2,697,751 people
- City population
- 827,308
- Metro
- Miami-Fort Lauderdale-Pompano Beach, FL
- Population (ZIP)
- 29,414
- Household income
- $94,036
- Rent vs Own
- Severe rent burden
- 3106.0
Population outlook (Miami-Dade County) Hauer SSP2
- Today (2025)
- 3,126,439 people
- By 2030
- 3,325,765 · +6.4%
- By 2040
- 3,697,561 · +18.3%
- By 2050
- 4,012,134 · +28.3%
- By 2075
- 4,605,612 · +47.3%
- By 2100
- 4,866,598 · +55.7%
Race, ethnicity, and origin ACS 2023
- Neighborhood character
- Diverse neighborhood (Simpson 0.63)
- Race & ethnicity
- Hispanic / Latino 54% Two or more races 25% White 24% Black 16% Asian 2%
- Hispanic origin (detail)
- Mexican 1% Puerto Rican 5% Cuban 10% Dominican 3% Salvadoran 3%
- Common ancestry
- Hispanic 8% Estonian 2% Lithuanian 2%
- Foreign-born
- 47% · Canada, Jamaica, Dominican Republic
- Languages at home
- 34% English-only · Spanish 49% French/Haitian/Cajun 8% Other Indo-European 5%
Political lean MEDSL · Miami-Dade
- 2024 margin
- R (+11.4) · D 43.9% · R 55.4%
- 2008→2024 swing
- -27.6pp toward R · 2008: 16.1pp · 2024: -11.4pp
- All cycles
- 2024: R+11.4 2020: D+7.3 2016: D+29.6 2012: D+23.7 2008: D+16.1
Not yet ingested
- Civics
- —
Market trends
- HPI YoY
- ▲ 0.27%
- Current HPI
- 385.1514
- Rent YoY
- ▲ 2.73%
- Metro
- Miami-Fort Lauderdale-Pompano Beach, FL
- State GDP YoY
- ▲ 3.28%
- F500 in state
- 36
Industry mix (Fortune 500 HQ in FL)
| Industry | F500 HQs | Revenue |
|---|---|---|
| Industrial Technology | 2 | $29B |
|
||
| Insurance | 2 | $17B |
|
||
| Retail | 1 | $60B |
|
||
| Technology Distribution | 1 | $58B |
|
||
| Homebuilding | 1 | $35B |
|
||
| Technology Manufacturing | 1 | $35B |
|
||
Price history
-99.2% since first listed6 events — show timeline
- 2026-03-14 Rental Removed $3,500 MARMLS
- 2026-02-10 Listed for Rent $3,500 MARMLS
- 2025-12-11 Listed $519,000 MARMLS
- 2024-09-04 Rental Removed $3,700 MARMLS
- 2024-07-03 Listed for Rent $4,000 MARMLS
- 2018-03-05 Sold (Public Records) $465,900 Public Records
Property tax history
+48.6%/yrLatest (2025): $7,834 · -2.4% YoY. Source: county tax records.
Cash-flow waterfall
monthlySold comps — $/sqft
last 12 mo · ≤1 miLoading sold comps…