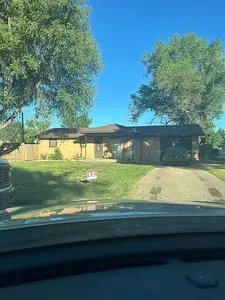
644 Nicimi Dr · Elkhart, KS
Flood risk 1/10 · Minimal
- FEMA flood zone
- —
- Chance of flooding over 30 yrs
- 0.0%
- Est. flood insurance / yr
- —
Fire risk 7/10 · Major
- Est. fire insurance / yr
- $1,154 – $2,142
Heat risk 4/10 · Minor
- Hot days now (above 99°F)
- 7 days/yr
- Hot days in 30 yrs
- 20 days/yr
Wind risk 2/10 · Minimal
- Chance of severe wind over 30 yrs
- —
Air-quality risk 1/10 · Minimal
- Unhealthy air days now
- 0 days/yr
- Unhealthy air days in 30 yrs
- 0 days/yr
Risk factors via First Street. Map © Google.
Why this score? — see what drove the B grade
The composite is a weighted blend of 9 inputs, each scored 0–100. Each bar is that input's sub-score; the figure is the points it added to the 100-point composite (weight × sub-score).
- Cash flow +27.2/30.0
- DSCR +9.5/10.0
- ARV discount +7.5/15.0
- 1% rule +7.4/10.0
- Appreciation +7.1/10.0
- Livability +3.6/5.0
- Schools +2.8/10.0
- Rent growth +2.5/5.0
- Condition / age +2.5/5.0
$75,000
🖨 Deal sheet 📄 Offer letter ✓ Due diligence
Listing remarks MLS
Looking for a home that is move in ready? This is the one! Homeowner is working hard to finish the remodel of this home getting it ready for the new owner. Be on the look out next week of pictures that will show off the new fresh look of the inside of this home.
Key facts
- Spacious backyard
- Close to high school
- Quiet neighborhood
Tags
Neighborhood map
What this means for you Summary
Snapshot
- This is a 3-bed/1.0-bath single-family listed at $75k.
Deal economics
- At list price, monthly cash flow is $215 ($3k/yr) — positive.
- The deal already cash-flows at list — no discount required.
- Meets the 1% rule at list price ($929 rent vs $75k).
Location & tenants
- Location reads 72/100 on livability (#116 in KS) — a middle-class / working-renter tenant base. Strengths: cost of living A+, health & safety A+, crime A-; Watch: employment D+, schools D, amenities F.
- Elkhart (rural): math 25% / reading 42% proficiency, ranked #80 of 169 in KS (top 47%) — families likely to look elsewhere, expect single-tenant / working-renter base with shorter leases.
- Market conditions: 12 active listings in the ZIP.
Forward outlook
- In year one you build about $4k of equity ($519 loan paydown + $3k appreciation (4.2% local appreciation)).
- Morton County population projected at -40% by 2050 — secular population decline; favor cash flow + early exit over multi-decade hold.
- At projected returns (4.2% appreciation + 3.0% rent growth), your $21k cash investment doubles in ~4 years — after that, you're playing with house money.
- By year 9, paydown + projected appreciation supports a ~$31k cash-out refi (75% LTV) — recoverable capital for the next deal without selling this one.
Negotiation context
- Only 14 days on market — expect competitive offers; lowballing is unlikely to land.
- 2 sale attempts since 5y ago with the ask held roughly flat each time — persistent listings suggest the price (not the market) is what's stuck; bring a comps-based counter.
- Current owner paid $54k; 39% above their basis — modest negotiation headroom, anchor on the comps not their cost.
Risks & watch-outs
- Climate carrying-cost: major wildfire risk — expect insurance premiums to compound above CPI over the hold.
Questions for the listing agent
- Built in 1960 — when were the roof, HVAC, electrical panel, plumbing, and water heater last replaced?
- Is there a deadline driving the sale (1031 exchange, divorce, estate, relocation)? That informs how much negotiation room exists.
- Schools are D-rated, which usually means shorter tenancies and higher turnover. Who's the typical renter profile here, and what's been the actual vacancy rate?
- What's the average days-on-market for RENTAL listings here right now (not sales)? A rising rental-DOM trend means longer vacancies and softer asking-rent achievability than the comps imply.
- What's the recent tenant-quality profile in this submarket — average credit score on applications, eviction rate, late-payment / NSF rate, and stable-employment percentage? A property-management company in the area should have these aggregated.
- How much new for-sale + rental construction is in the pipeline within 1–3 miles? Heavy new supply typically softens prices + rents 12–24 months out; constrained supply supports both.
Investment metrics
- 1% rule
- 1.24% ✓
- Cap rate
- 9.74%
- Cash-on-cash
- 12.31%
- DSCR
- 1.55
- GRM
- 6.7
CMA / ARV
No comps found within radius.
Projected returns pro-forma
4.16% appreciation · 3.0% rent growth · sell at horizon
- IRR
- 21.7%
- Equity multiple
- 2.31×
- Total profit
- $27,469
- Equity at exit
- $38,723
- IRR
- 21.8%
- Equity multiple
- 4.48×
- Total profit
- $73,069
- Equity at exit
- $63,897
Cash invested: $21,000 (down + closing). Projections, not guarantees.
Landlord ↔ Tenant lean methodology
- Overall (STATE)
- 83 Strongly Landlord-Friendly
- State Kansas
- 83 Strongly Landlord-Friendly · R+10
- County
- — inherits STATE
- City
- — inherits STATE
ZIP-level market 67950
- Home prices YoY
- 3.4%
- Active inventory
- 12
- Price-to-rent
- 6.7×
Monthly cashflow live
- Estimated rent
- $929 medium interval (Pro) →
- Mortgage (P&I)
- −$393
- Tax est. 1.5%
- −$94 /mo · $1,125/yr
- Insurance
- −$31
- HOA
- −$0
- Vacancy / Maint / Mgmt
- −$195
- Net cashflow
- $215
Break-even live
UW: 25.0% down · 7.5% · 30yr · 1.5% tax · 5.0% vac · 8.0% maint · 8.0% mgmt
Financing live
Cash to close
- Down payment
- $18,750
- Closing costs
- $2,250
- Reserves months
- —
- Total cash needed
- —
Loan-product check · same deal, 3 products live
Conventional
25% down · 7.5% · 30yr
- Down + closing
- —
- Monthly P&I
- —
- Monthly cashflow
- —
- DSCR
- —
- Eligible?
- —
Personal DTI + credit; lowest rate.
DSCR
20% down · 8.5% · 30yr
- Down + closing
- —
- Monthly P&I
- —
- Monthly cashflow
- —
- DSCR
- —
- Eligible?
- —
No personal income docs; deal must DSCR.
Hard money
10% down · 12.0% · 12mo
- Down + closing
- —
- Monthly P&I
- —
- Monthly cashflow
- —
- DSCR
- —
- Eligible?
- —
Short-term bridge; refi at stabilization.
Listing history 9 events
-
2026-05-12$75,000 Active
-
2022-03-04soldstatus 262-char remark
Show marketing remark (262 chars)
Looking for a home that is move in ready? This is the one! Homeowner is working hard to finish the remodel of this home getting it ready for the new owner. Be on the look out next week of pictures that will show off the new fresh look of the inside of this home.
-
2021-12-02$67,500 262-char remark
Show marketing remark (262 chars)
Looking for a home that is move in ready? This is the one! Homeowner is working hard to finish the remodel of this home getting it ready for the new owner. Be on the look out next week of pictures that will show off the new fresh look of the inside of this home.
-
2006-08-01soldstatus $54,000
-
2006-08-01soldstatus $54,000
-
2003-09-01soldstatus $65,000
-
2003-09-01soldstatus $65,000
-
1995-06-01soldstatus $34,050
-
1995-06-01soldstatus $34,050
ⓘ Source: listings_history table (triggers on properties + properties_extension) + one-shot
backfill from property_details.listing_events for pre-trigger history.
Climate risk First Street
- Flood 1/10 Low 0% chance over 30 yrs
- Wildfire 7/10 Severe
- Heat 4/10 Moderate 7 d/yr ≥99°F today · 20 d/yr by 30 yrs out
- Wind 2/10 Low
- Air quality 1/10 Low 0 unhealthy d/yr today · 0 by 30 yrs out
Nearby sold comps map
Loading sold comps map…
Walkable amenities ~0.75 mi
Loading nearby amenities…
Taxation est. · year 1
- Rental income
- $11,145
- − Mortgage interest
- −$4,201
- − Property taxes
- −$1,125
- − Insurance
- −$375
- − Repairs & maintenance
- −$892
- − Management
- −$892
- − Depreciation
- −$2,182
- Taxable income
- $1,479
- Est. tax owed @ 24.0%
- −$355
- After-tax cash flow
- $2,230/yr
For passive investors: Depreciation is non-cash, so a rental often shows a tax loss while cash-flowing — sheltering income. Rental losses are passive: they offset passive income freely, and up to $25,000/yr can offset ordinary (W-2) income if you actively participate and your MAGI is under $100k (phasing out to $0 by $150k); unused losses carry forward. On sale, claimed depreciation is recaptured at up to 25%, and gains may owe capital-gains tax (a 1031 exchange can defer both). Figures are a year-1 estimate at your 24.0% rate — not tax advice; consult a CPA.
Schools (NCES district)
- District
- Elkhart
- NCES district ID
- 2005790
- Math proficiency
- 25% ▼ -2.00%
- Reading proficiency
- 42% ▲ 4.00%
- Median HH income
- $42,271
- Composite
- 28.3/100
- National rank
- #6788
- State rank
- #80 of 169 in KS
Livability — Elkhart
- Score
- 72/100
- State rank
- #116
- US rank
- #6297
Category grades
Schools grade is shown separately in the Schools card above.
Census & demographics
- Census place
- Elkhart, KS
- Population (ZIP)
- 1,786
Population outlook (Morton County) Hauer SSP2
- Today (2025)
- 2,576 people
- By 2030
- 2,363 · -8.3%
- By 2040
- 1,940 · -24.7%
- By 2050
- 1,559 · -39.5%
- By 2075
- 881 · -65.8%
- By 2100
- 558 · -78.3%
Race, ethnicity, and origin ACS 2023
- Neighborhood character
- Predominantly White (75%)
- Race & ethnicity
- White 75% Hispanic / Latino 21% Two or more races 15% Asian 2%
- Hispanic origin (detail)
- Mexican 21%
- Common ancestry
- Slovak 1% Italian 1% English 1%
- Foreign-born
- 6% · Canada
- Languages at home
- 86% English-only · Spanish 11% Tagalog/Filipino 2% Other Indo-European 1%
Political lean MEDSL · Morton
- 2024 margin
- Solid R (+73.4) · D 12.4% · R 85.8% · Other 1.9%
- 2008→2024 swing
- -7.5pp toward R · 2008: -65.9pp · 2024: -73.4pp
- All cycles
- 2024: R+73.4 2020: R+73.7 2016: R+71.1 2012: R+69.8 2008: R+65.9
Not yet ingested
- Civics
- —
Market trends
- HPI YoY
- ▲ 4.16%
- Current HPI
- 128.3365
- Rent YoY
- —
- Metro
- —
- State GDP YoY
- —
- F500 in state
- 0
Price history
+120.3% since first listed9 events — show timeline
- 2026-05-12 Listed $75,000 FSBO.com
- 2022-03-04 Sold (MLS) — SWKSBOR
- 2021-12-02 Listed $67,500 SWKSBOR
- 2006-08-01 Sold (Public Records) $54,000 Public Records
- 2006-08-01 Sold (Public Records) $54,000 Public Records
- 2003-09-01 Sold (Public Records) $65,000 Public Records
- 2003-09-01 Sold (Public Records) $65,000 Public Records
- 1995-06-01 Sold (Public Records) $34,050 Public Records
- 1995-06-01 Sold (Public Records) $34,050 Public Records
Cash-flow waterfall
monthlySold comps — $/sqft
last 12 mo · ≤1 miLoading sold comps…