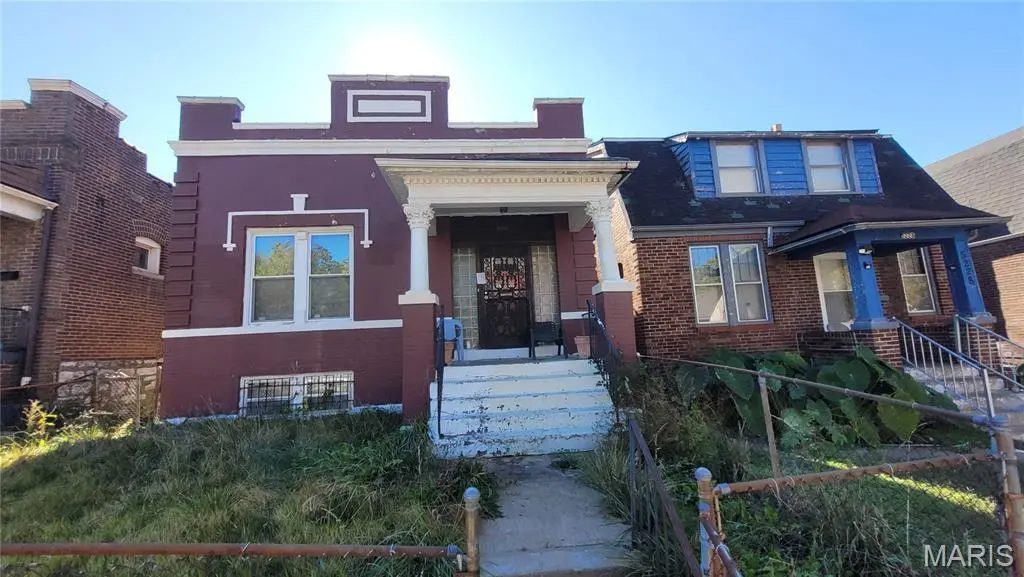
5226 Theodosia Ave · St. Louis, MO
Flood risk 1/10 · Minimal
- FEMA flood zone
- X (unshaded)
- Chance of flooding over 30 yrs
- 0.0%
- Est. flood insurance / yr
- $473 – $860
Fire risk 1/10 · Minimal
- Est. fire insurance / yr
- $1,054 – $1,958
Heat risk 5/10 · Moderate
- Hot days now (above 107°F)
- 7 days/yr
- Hot days in 30 yrs
- 21 days/yr
Wind risk 2/10 · Minimal
- Chance of severe wind over 30 yrs
- 1.0%
Air-quality risk 4/10 · Minor
- Unhealthy air days now
- 4 days/yr
- Unhealthy air days in 30 yrs
- 5 days/yr
Risk factors via First Street. Map © Google.
Why this score? — see what drove the D+ grade
The composite is a weighted blend of 9 inputs, each scored 0–100. Each bar is that input's sub-score; the figure is the points it added to the 100-point composite (weight × sub-score).
- Cash flow +15.0/30.0
- ARV discount +8.9/15.0
- 1% rule +5.0/10.0
- DSCR +5.0/10.0
- Appreciation +3.9/10.0
- Rent growth +2.5/5.0
- Livability +2.5/5.0
- Condition / age +2.5/5.0
- Schools +1.2/10.0
$24,900
🖨 Deal sheet (PDF) 📄 Offer letter ✓ Due diligence
Listing remarks MLS
Incredible opportunity awaits with this 1 bed, 1.5 bath home with 1144sf on Main level. Main level has Kitchen, Dining Room, Living Room, Bedroom, & full bathroom. Basement is partially finished with laundry area and plenty of room for your finishing touches. Home has some hardwood floors and is located in a great area close to local services. This is a must See Home! An AGENT MUST BE PRESENT FOR ALL SHOWINGS. CASH ONLY SALE. Do not Trespass.
Key facts
- Kitchen
- Full bathroom
- Living room
Tags
Neighborhood map
What this means for you Summary
Snapshot
- This is a 1-bed/1.0-bath single-family listed at $25k.
Deal economics
- At list price, monthly cash flow is $808 ($10k/yr) — positive.
- The deal already cash-flows at list — no discount required.
- Meets the 1% rule at list price ($1k rent vs $25k).
- Recommended offer: $22k (12.0% below list) — sets the bar for market timing.
- Cap rate 45.2% vs local median 5.0% in St. Louis — top-decile yield for the area; either an underpriced asset or a hidden risk that comps aren't pricing in. Stress-test before assuming the spread holds.
Location & tenants
- Location reads: area grade D — affects rentability + tenant quality, not the cash-flow math above.
- St. Louis City (urban): math 10% / reading 18% proficiency, ranked #312 of 324 in MO (top 96%) — low school quality limits family demand, transient renter base, plan for 1-2y turnover; 80% free/reduced lunch — lower-income household profile, screen leases tightly.
- Zoned schools: Nahed Chapman New American Aca (math 2% / reading 2%, grade F, #1,099 of 1,115 statewide, top 100%, 335 students, 99% FRL); Gateway Middle (math 0% / reading 8%, grade F, #389 of 391 statewide, top 100%, 506 students, 99% FRL); Sumner High (math 2% / reading 2%, grade F, #520 of 521 statewide, top 100%, 264 students, 99% FRL) — zoned schools average 99% FRL vs 80% district-wide (19 pts higher); higher-poverty schools than district average — tighter screening recommended.
- Market conditions: 58 active listings in the ZIP; 37 comparable units currently listed for rent nearby; rentals at typical pace (median 19d on market — plan ~3-4 weeks tenant-placement turnaround); 41% of comp listings sitting > 30 days — soft ceiling on asking rent; 294 units permitted in St. Louis city in 2024 (227 in 5+ unit buildings).
Forward outlook
- Local home prices are declining (-2.1%/yr); year-one equity from $172 of loan paydown is wiped out by about $534 of value loss. Plan a longer hold.
- St. Louis County population projected to shrink 6% by 2050 — rents likely to lag national; underwrite the cash flow, not the appreciation.
- At projected returns (-2.1% appreciation + 3.0% rent growth), your $7k cash investment doubles in ~1 year — after that, you're playing with house money.
Negotiation context
- It's been on market 154 days — a 12% lower offer ($22k) is reasonable based on typical stale-listing flexibility.
- 2 sale attempts; this cycle's ask has dropped $20k (45%) from the opening price — seller is motivated, your offer sets the floor, not the list.
Risks & watch-outs
- Watch-outs: built in 1908 — expect roof / HVAC / electrical / plumbing capex.
- Climate carrying-cost: extreme-heat days projected 7→21/yr by 2055 (HVAC capex compounding) — expect insurance premiums to compound above CPI over the hold.
Questions for the listing agent
- It's been on market 154 days. Have you received any prior offers? Is the seller open to a 12% concession, seller financing, or rate buy-down credit?
- Built in 1908 — when were the roof, HVAC, electrical panel, plumbing, and water heater last replaced?
- Why hasn't it sold? Are there any deal-killer items the seller is aware of (foundation, flood, title, zoning, code violations)?
- Is there a deadline driving the sale (1031 exchange, divorce, estate, relocation)? That informs how much negotiation room exists.
- The area grade is low — what's the realistic commute time and amenity access for the typical tenant pool here? Any planned neighborhood developments (good or bad) we should know about?
- What's the average days-on-market for RENTAL listings here right now (not sales)? A rising rental-DOM trend means longer vacancies and softer asking-rent achievability than the comps imply.
- What's the recent tenant-quality profile in this submarket — average credit score on applications, eviction rate, late-payment / NSF rate, and stable-employment percentage? A property-management company in the area should have these aggregated.
- How much new for-sale + rental construction is in the pipeline within 1–3 miles? Heavy new supply typically softens prices + rents 12–24 months out; constrained supply supports both.
Investment metrics
- 1% rule
- 4.91% ✓
- Cap rate
- 45.25%
- Cash-on-cash
- 139.13%
- DSCR
- 7.19
- GRM
- 1.7
CMA / ARV
- ARV (median comp)
- $25,679
- List price
- $24,900
- Delta
- -3.03%
- Verdict
- FAIR
- Comps
- 12 within 1.0 mi
Show comp detail 10 sales within ~0.75 mi
| Address | Dist | Beds/Ba | Sqft | Sold | Price | $/sf | Match |
|---|---|---|---|---|---|---|---|
| 5109 Cote Brilliante Ave | 0.18mi | 2/1.0 (+1) | 1,188 (+4%) | 4mo | $52,000 | $44 | 77 |
| 5202 Maffitt Ave | 0.42mi | 2/1.0 (+1) | 1,157 (+1%) | 13mo | $19,900 | $17 | 62 |
| 5126 Terry Ave | 0.50mi | 2/1.0 (+1) | 1,091 (-5%) | 6mo | $4,900 | $4 | 59 |
| 5152 Maffitt Ave | 0.43mi | 2/1.0 (+1) | 1,218 (+6%) | 15mo | $15,000 | $12 | 52 |
| 1630 Semple Ave | 0.34mi | 2/1.0 (+1) | 1,314 (+15%) | 5mo | $6,300 | $5 | 50 |
| 1636 Belt Ave | 0.42mi | 2/1.0 (+1) | 1,003 (-12%) | 9mo | $19,900 | $20 | 48 |
| 5226 Saint Louis Ave | 0.55mi | 2/1.0 (+1) | 1,050 (-8%) | 11mo | $65,000 | $62 | 47 |
| 1632 Belt Ave | 0.42mi | 2/1.0 (+1) | 1,003 (-12%) | 12mo | $37,900 | $38 | 45 |
| 4908 Lotus Ave | 0.48mi | 2/1.5 (+1) | 1,250 (+9%) | 17mo | $49,900 | $40 | 41 |
| 4837 Leduc St | 0.58mi | 2/1.0 (+1) | 1,008 (-12%) | 17mo | $10,000 | $10 | 34 |
Match score weights: distance 35% · size 25% · config 20% · recency 20%. Top-matched comps best support the ARV.
Projected returns pro-forma
-2.14% appreciation · 3.0% rent growth · sell at horizon
- IRR
- —
- Equity multiple
- 7.94×
- Total profit
- $48,360
- Equity at exit
- $4,672
- IRR
- —
- Equity multiple
- 16.67×
- Total profit
- $109,242
- Equity at exit
- $3,838
Cash invested: $6,972 (down + closing). Projections, not guarantees.
Landlord ↔ Tenant lean methodology
- Overall (STATE)
- 81 Strongly Landlord-Friendly
- State Missouri
- 81 Strongly Landlord-Friendly · R+10
- County
- — inherits STATE
- City
- — inherits STATE
ZIP-level market 63113
- Home prices YoY
- -2.0%
- Active inventory
- 58
- Price-to-rent
- 1.7×
Monthly cashflow live
- Estimated rent
- $1,223 high interval (Pro) →
- Mortgage (P&I)
- −$131
- Tax from tax record
- −$17 /mo · $204/yr
- Insurance
- −$10
- HOA
- −$0
- Vacancy / Maint / Mgmt
- −$257
- Net cashflow
- $808
Break-even live
Sensitivity live
| Price | -10% $822 | -5% $815 | +0% $808 | +5% $801 | +10% $794 |
|---|---|---|---|---|---|
| Rent | -10% $712 | -5% $760 | +0% $808 | +5% $857 | +10% $905 |
| Rate | -1.0pp $821 | -0.5pp $815 | base $808 | +0.5pp $802 | +1.0pp $795 |
UW: 25.0% down · 7.5% · 30yr · 1.5% tax · 5.0% vac · 8.0% maint · 8.0% mgmt
Financing live
Cash to close
- Down payment
- $6,225
- Closing costs
- $747
- Reserves months
- —
- Total cash needed
- —
Loan-product check · same deal, 3 products live
Conventional
25% down · 7.5% · 30yr
- Down + closing
- —
- Monthly P&I
- —
- Monthly cashflow
- —
- DSCR
- —
- Eligible?
- —
Personal DTI + credit; lowest rate.
DSCR
20% down · 8.5% · 30yr
- Down + closing
- —
- Monthly P&I
- —
- Monthly cashflow
- —
- DSCR
- —
- Eligible?
- —
No personal income docs; deal must DSCR.
Hard money
10% down · 12.0% · 12mo
- Down + closing
- —
- Monthly P&I
- —
- Monthly cashflow
- —
- DSCR
- —
- Eligible?
- —
Short-term bridge; refi at stabilization.
Rent comps 37 comps
| Address | Beds | Baths | Sqft | Rent | $/sqft | DOM | Units | Dist |
|---|---|---|---|---|---|---|---|---|
| 1420 Union Blvd Unit 2F St. Louis, MO | 2.0 | 1.0 | 1096 | $995 | $0.91 | 45d | 1 | 0.27mi |
| 1324 Academy Ave Unit C St. Louis, MO | 1.0 | 1.0 | 1000 | $890 | $0.89 | 45d | 1 | 0.41mi |
| 5203 Page Blvd Unit 5201 1st Floor St. Louis, MO | 2.0 | 1.0 | 1000 | $750 | $0.75 | 16d | 1 | 0.45mi |
| 2831 Abner Pl Unit 7 St. Louis, MO | 2.0 | 1.0 | 968 | $1,250 | $1.29 | 25d | 1 | 0.51mi |
| 5608 Wabada Ave Saint Louis, MO | 2.0 | 1.0 | 910 | $1,300 | $1.43 | 18d | 1 | 0.61mi |
| 5345 Cabanne Ave Unit 5345 Cabanne 1S St. Louis, MO | 2.0 | 1.0 | 800 | $950 | $1.19 | 45d | 1 | 0.76mi |
| 5662 Maffitt Ave Saint Louis, MO | 2.0 | 1.0 | 850 | $895 | $1.05 | 9d | 1 | 0.77mi |
| 4627 Maffitt Ave Saint Louis, MO | 2.0 | 1.0 | 704 | $795 | $1.13 | 45d | 1 | 1.02mi |
| 763 Walton Ave Unit 763 St. Louis, MO | 2.0 | 1.0 | 1100 | $1,100 | $1.00 | 45d | 1 | 1.08mi |
| 625 N Euclid Ave St. Louis, MO | 2.0 | 1.0–2.0 | 984 | $2,145 | $2.18 | 0d | 16 | 1.13mi |
| 5500 Delmar Blvd Unit 5540-Apt 202 St. Louis, MO | 2.0 | 2.0 | 875 | $1,395 | $1.59 | 9d | 1 | 1.19mi |
| 5535 Delmar Blvd St. Louis, MO | 1.0–2.0 | 1.0–2.0 | 884 | $1,165 | $1.32 | 0d | 16 | 1.20mi |
| 4961 McPherson Ave St. Louis, MO | 1.0 | 1.0 | 950 | $1,175 | $1.24 | 45d | 1 | 1.20mi |
| 4953 McPherson Ave Saint Louis, MO | 1.0 | 1.0 | 1048 | $1,325 | $1.26 | 45d | 1 | 1.23mi |
| 1266 Amherst Pl Unit 2nd floor St. Louis, MO | 2.0 | 1.0 | 1050 | $1,000 | $0.95 | 45d | 1 | 1.23mi |
| 5811 Cabanne Ave St. Louis, MO | 2.0 | 1.0 | 800 | $1,250 | $1.56 | 45d | 1 | 1.24mi |
| 4738 Olive St Saint Louis, MO | 2.0 | 2.0 | 1413 | $1,925 | $1.36 | 25d | 1 | 1.24mi |
| 5560 Delmar Blvd Saint Louis, MO | 1.0–2.0 | 1.0–2.0 | 752 | $995 | $1.32 | 18d | 1 | 1.26mi |
| 5989 Julian Ave Unit 37 St. Louis, MO | 2.0 | 1.0 | 780 | $1,200 | $1.54 | 19d | 1 | 1.27mi |
| 629 Clara Ave Apt 26 St. Louis, MO | 2.0 | 2.0 | 1155 | $1,615 | $1.40 | 45d | 1 | 1.28mi |
| 401 N Euclid Ave St. Louis, MO | 3.0 | 1.0 | 1025 | $1,355 | $1.32 | 0d | 4 | 1.29mi |
| 4378 Cottage Ave St. Louis, MO | 2.0 | 1.5 | 950 | $924 | $0.97 | 0d | 5 | 1.35mi |
| 501 Clara Ave Saint Louis, MO | 2.0 | 1.0–2.0 | 1040 | $1,742 | $1.67 | 0d | 19 | 1.40mi |
| 501 Clara Ave Saint Louis, MO | 1.0–2.0 | 1.0–2.0 | 850 | $1,335 | $1.57 | 16d | 21 | 1.40mi |
| 5527 Waterman Blvd St. Louis, MO | 2.0 | 1.5 | 1389 | $1,495 | $1.08 | 18d | 1 | 1.40mi |
| 4500 Olive St Unit D St. Louis, MO | 2.0 | 2.0 | 1200 | $1,725 | $1.44 | 45d | 1 | 1.42mi |
| 445 Clara Ave Saint Louis, MO | 2.0 | 2.5 | 1188 | $2,750 | $2.31 | 45d | 1 | 1.44mi |
| 275 Union Blvd St. Louis, MO | 3.0 | 1.0–3.0 | 1317 | $2,166 | $1.64 | 0d | 63 | 1.45mi |
| 5316 Pershing Ave Saint Louis, MO | 1.0–2.0 | 1.0 | 770 | $1,150 | $1.49 | 0d | 4 | 1.45mi |
| 5330 Pershing Ave #606 Saint Louis, MO | 2.0 | 2.0 | 845 | $1,145 | $1.36 | 0d | 1 | 1.46mi |
| 5660 Kingsbury Ave Saint Louis, MO | 1.0–2.0 | 1.0–2.0 | 789 | $1,000 | $1.27 | 5d | 16 | 1.48mi |
| 5660 Kingsbury Ave Saint Louis, MO | 1.0–2.0 | 1.0–2.0 | 789 | $1,100 | $1.39 | 45d | 23 | 1.48mi |
| 1131 Hodiamont Ave St. Louis, MO | 2.0 | 1.0 | 700 | $1,050 | $1.50 | 45d | 1 | 1.48mi |
| 4642 Farlin Ave Unit 1F St. Louis, MO | 2.0 | 1.0 | 1056 | $800 | $0.76 | 45d | 1 | 1.49mi |
| 5535 Pershing Ave Unit 11 St. Louis, MO | 1.0 | 1.0 | 800 | $1,095 | $1.37 | 16d | 1 | 1.49mi |
| 4466 Olive St Saint Louis, MO | 1.0–2.0 | 1.0–2.5 | 1222 | $1,650 | $1.35 | 0d | 7 | 1.49mi |
| 325-329 N Euclid Ave Unit 2819-B St. Louis, MO | 1.0 | 1.0 | 700 | $950 | $1.36 | 19d | 1 | 1.49mi |
Listing history 19 events
-
2026-06-21days on market $24,900 Active 154 DOM
-
2026-06-18days on market $24,900 Active 151 DOM
-
2026-06-17days on market $24,900 Active 150 DOM
-
2026-06-16days on market $24,900 Active 149 DOM
-
2026-06-15days on market $24,900 Active 148 DOM
-
2026-06-13days on market $24,900 Active 146 DOM
-
2026-06-09days on market $24,900 Active 142 DOM
-
2026-06-08days on market $24,900 Active 141 DOM
-
2026-06-08days on market $24,900 Active 140 DOM
-
2026-06-05days on market $24,900 Active 137 DOM
-
2026-06-03days on market $24,900 Active 136 DOM
-
2026-06-02days on market $24,900 Active 135 DOM
-
2026-06-01days on market $24,900 Active 134 DOM
-
2026-05-31days on market $24,900 Active 133 DOM
-
2026-05-12status Active 456-char remark
Show marketing remark (456 chars)
Incredible opportunity awaits with this 1 bed, 1.5 bath home with 1144sf on Main level. Main level has Kitchen, Dining Room, Living Room, Bedroom, & full bathroom. Basement is partially finished with laundry area and plenty of room for your finishing touches. Home has some hardwood floors and is located in a great area close to local services. This is a must See Home! An AGENT MUST BE PRESENT FOR ALL SHOWINGS. CASH ONLY SALE. Do not Trespass.
-
2026-05-01status Pending 456-char remark
Show marketing remark (456 chars)
Incredible opportunity awaits with this 1 bed, 1.5 bath home with 1144sf on Main level. Main level has Kitchen, Dining Room, Living Room, Bedroom, & full bathroom. Basement is partially finished with laundry area and plenty of room for your finishing touches. Home has some hardwood floors and is located in a great area close to local services. This is a must See Home! An AGENT MUST BE PRESENT FOR ALL SHOWINGS. CASH ONLY SALE. Do not Trespass.
-
2026-04-01price $29,900 456-char remark
Show marketing remark (456 chars)
Incredible opportunity awaits with this 1 bed, 1.5 bath home with 1144sf on Main level. Main level has Kitchen, Dining Room, Living Room, Bedroom, & full bathroom. Basement is partially finished with laundry area and plenty of room for your finishing touches. Home has some hardwood floors and is located in a great area close to local services. This is a must See Home! An AGENT MUST BE PRESENT FOR ALL SHOWINGS. CASH ONLY SALE. Do not Trespass.
-
2026-02-18price $39,900 456-char remark
Show marketing remark (456 chars)
Incredible opportunity awaits with this 1 bed, 1.5 bath home with 1144sf on Main level. Main level has Kitchen, Dining Room, Living Room, Bedroom, & full bathroom. Basement is partially finished with laundry area and plenty of room for your finishing touches. Home has some hardwood floors and is located in a great area close to local services. This is a must See Home! An AGENT MUST BE PRESENT FOR ALL SHOWINGS. CASH ONLY SALE. Do not Trespass.
-
2026-01-07$44,900 Active 456-char remark
Show marketing remark (456 chars)
Incredible opportunity awaits with this 1 bed, 1.5 bath home with 1144sf on Main level. Main level has Kitchen, Dining Room, Living Room, Bedroom, & full bathroom. Basement is partially finished with laundry area and plenty of room for your finishing touches. Home has some hardwood floors and is located in a great area close to local services. This is a must See Home! An AGENT MUST BE PRESENT FOR ALL SHOWINGS. CASH ONLY SALE. Do not Trespass.
ⓘ Source: listings_history table (triggers on properties + properties_extension) + one-shot
backfill from property_details.listing_events for pre-trigger history.
Tax reassessment forecast MO · Resets to sale price
- Current annual tax
- $204 · $17/mo
- Projected year-2 tax
- $242 · $20/mo
- Expected delta
- +$38/yr (+$3/mo · 18.5%)
ⓘ Screening estimate from a state-policy table — verify with the county assessor before closing.
Climate risk First Street
- Flood 1/10 Low FEMA zone X (unshaded) · 0% chance over 30 yrs
- Wildfire 1/10 Low
- Heat 5/10 Major 7 d/yr ≥107°F today · 21 d/yr by 30 yrs out
- Wind 2/10 Low 100% chance of damaging wind over 30 yrs
- Air quality 4/10 Moderate 4 unhealthy d/yr today · 5 by 30 yrs out
Nearby sold comps map
Loading sold comps map…
Walkable amenities ~0.75 mi
Loading nearby amenities…
Taxation est. · year 1
- Rental income
- $14,677
- − Mortgage interest
- −$1,395
- − Property taxes
- −$204
- − Insurance
- −$124
- − Repairs & maintenance
- −$1,174
- − Management
- −$1,174
- − Depreciation
- −$724
- Taxable income
- $9,882
- Est. tax owed @ 24.0%
- −$2,372
- After-tax cash flow
- $7,328/yr
For passive investors: Depreciation is non-cash, so a rental often shows a tax loss while cash-flowing — sheltering income. Rental losses are passive: they offset passive income freely, and up to $25,000/yr can offset ordinary (W-2) income if you actively participate and your MAGI is under $100k (phasing out to $0 by $150k); unused losses carry forward. On sale, claimed depreciation is recaptured at up to 25%, and gains may owe capital-gains tax (a 1031 exchange can defer both). Figures are a year-1 estimate at your 24.0% rate — not tax advice; consult a CPA.
Schools (NCES district)
- District
- St. Louis City
- NCES district ID
- 2929280
- Math proficiency
- 10% ▼ -6.00%
- Reading proficiency
- 18% ▼ -3.00%
- Median HH income
- $35,685
- Composite
- 11.54/100
- National rank
- #9699
- State rank
- #312 of 324 in MO
Livability — St. Louis
No livability data for this city. (Only ~50 U.S. cities are tracked.)
Census & demographics
- Census place
- St. Louis, MO
- City population
- 283,259
- Population (ZIP)
- 11,610
Population outlook (St. Louis County) Hauer SSP2
- Today (2025)
- 315,737 people
- By 2030
- 313,865 · -0.6%
- By 2040
- 305,439 · -3.3%
- By 2050
- 296,529 · -6.1%
- By 2075
- 271,028 · -14.2%
- By 2100
- 255,359 · -19.1%
Race, ethnicity, and origin ACS 2023
- Neighborhood character
- Predominantly Black (91%)
- Race & ethnicity
- Black 91% White 6% Two or more races 2% Hispanic / Latino 1%
- Foreign-born
- 2% · Canada
Political lean MEDSL · St. Louis
- 2024 margin
- Solid D (+64.7) · D 81.4% · R 16.7% · Other 2.0%
- 2008→2024 swing
- -3.5pp toward R · 2008: 68.2pp · 2024: 64.7pp
- All cycles
- 2024: D+64.7 2020: D+66.2 2016: D+63.7 2012: D+66.6 2008: D+68.2
Not yet ingested
- Civics
- —
Market trends
- HPI YoY
- ▼ -2.14%
- Current HPI
- 107.1335
- Rent YoY
- —
- Metro
- —
- State GDP YoY
- ▲ 1.84%
- F500 in state
- 20
Industry mix (Fortune 500 HQ in MO)
| Industry | F500 HQs | Revenue |
|---|---|---|
| Healthcare | 1 | $163B |
|
||
| Insurance | 1 | $21B |
|
||
| Industrial Technology | 1 | $17B |
|
||
| Retail | 1 | $16B |
|
||
| Industrial Distribution | 1 | $10B |
|
||
| Utilities | 1 | $9B |
|
||
Price history
-33.4% since first listed5 events — show timeline
- 2026-05-12 Relisted — MARIS as Distributed by MLS Grid
- 2026-05-01 Pending — MARIS as Distributed by MLS Grid
- 2026-04-01 Price Changed $29,900 MARIS as Distributed by MLS Grid
- 2026-02-18 Price Changed $39,900 MARIS as Distributed by MLS Grid
- 2026-01-07 Listed $44,900 MARIS as Distributed by MLS Grid
Property tax history
-1.8%/yrLatest (2024): $204 · +4.4% YoY. Source: county tax records.
Cash-flow waterfall
monthlySold comps — $/sqft
last 12 mo · ≤1 miLoading sold comps…