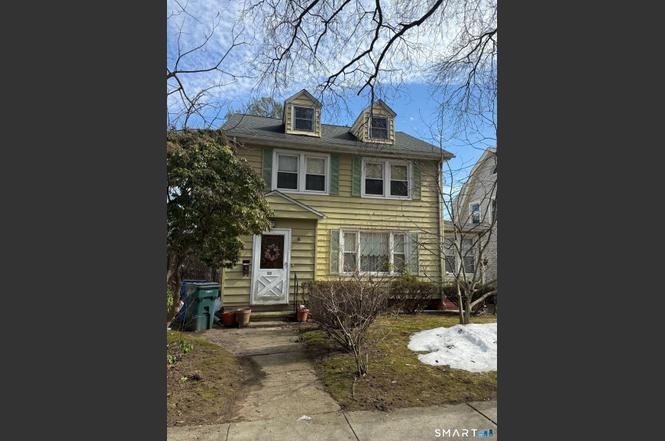
53 Park Rd · New Haven, CT
Flood risk 1/10 · Minimal
- FEMA flood zone
- X (unshaded)
- Chance of flooding over 30 yrs
- 0.0%
- Est. flood insurance / yr
- $473 – $860
Fire risk 2/10 · Minimal
- Est. fire insurance / yr
- $829 – $1,539
Heat risk 6/10 · Moderate
- Hot days now (above 99°F)
- 7 days/yr
- Hot days in 30 yrs
- 15 days/yr
Wind risk 6/10 · Moderate
- Chance of severe wind over 30 yrs
- 54.0%
Air-quality risk 5/10 · Moderate
- Unhealthy air days now
- 6 days/yr
- Unhealthy air days in 30 yrs
- 8 days/yr
Risk factors via First Street. Map © Google.
Why this score? — see what drove the B- grade
The composite is a weighted blend of 9 inputs, each scored 0–100. Each bar is that input's sub-score; the figure is the points it added to the 100-point composite (weight × sub-score).
- Cash flow +24.2/30.0
- ARV discount +15.0/15.0
- 1% rule +8.1/10.0
- DSCR +7.8/10.0
- Livability +4.0/5.0
- Schools +3.3/10.0
- Rent growth +2.6/5.0
- Condition / age +2.5/5.0
- Appreciation +0.0/10.0
$219,900
🖨 Deal sheet 📄 Offer letter ✓ Due diligence
Listing remarks
Tons of potential!!!! Solid home with nice floorplan needing a rehab. Property to be sold as-is and with all contents present at closing. Subject to probate court approval. * * * * Highest and Best offers to be submitted by 5pm, Sunday March 15th. * * * * *
Key facts
- 6,969 sq ft lot
- Garage
- Built 1929
Neighborhood map
What this means for you Summary
Snapshot
- This is a 3-bed/2.0-bath single-family listed at $220k.
Deal economics
- At list price, monthly cash flow is $437 ($5k/yr) — positive.
- The deal already cash-flows at list — no discount required.
- Meets the 1% rule at list price ($3k rent vs $220k).
- Cap rate 8.7% vs local median 4.8% in New Haven — top-decile yield for the area; either an underpriced asset or a hidden risk that comps aren't pricing in. Stress-test before assuming the spread holds.
Location & tenants
- Location reads 79/100 on livability (#31 in CT, #2,190 nationally) — a middle-class / working-renter tenant base. Strengths: amenities A+, commute A+, health & safety A+; Watch: schools D+, employment D, crime F.
- Hamden School District (suburban): math 30% / reading 43% proficiency, ranked #106 of 153 in CT (top 69%) — families likely to look elsewhere, expect single-tenant / working-renter base with shorter leases.
- Market conditions: Rents flat; 84 active listings in the ZIP; 40 comparable units currently listed for rent nearby; rentals at typical pace (median 23d on market — plan ~3-4 weeks tenant-placement turnaround); 45% of comp listings sitting > 30 days — soft ceiling on asking rent; solid renter incomes; 1,059 units permitted in South Central Connecticut Planning Region in 2024 (779 in 5+ unit buildings).
- This rent runs 33% of the median local income ($105k/yr) — at the standard rent-burdened threshold; future hikes will face affordability resistance.
Forward outlook
- Local home prices are declining (-3.0%/yr); year-one equity from $2k of loan paydown is wiped out by about $7k of value loss. Plan a longer hold.
Negotiation context
- Only 10 days on market — expect competitive offers; lowballing is unlikely to land.
Risks & watch-outs
- Watch-outs: property tax is 3.2% of price; built in 1929 — expect roof / HVAC / electrical / plumbing capex.
- Climate carrying-cost: major wind risk, 54% chance of damaging wind over 30y; extreme-heat days projected 7→15/yr by 2055 (HVAC capex compounding) — expect insurance premiums to compound above CPI over the hold.
Questions for the listing agent
- Built in 1929 — when were the roof, HVAC, electrical panel, plumbing, and water heater last replaced?
- Property tax is high relative to price — has the assessment been appealed recently, and will the sale trigger a re-assessment?
- Is there a deadline driving the sale (1031 exchange, divorce, estate, relocation)? That informs how much negotiation room exists.
- Schools are D-rated, which usually means shorter tenancies and higher turnover. Who's the typical renter profile here, and what's been the actual vacancy rate?
- Crime grade is F in this area — have there been break-ins, vandalism, or insurance claims at this property in the last 3 years? What carrier currently insures it and at what premium?
- What's the average days-on-market for RENTAL listings here right now (not sales)? A rising rental-DOM trend means longer vacancies and softer asking-rent achievability than the comps imply.
- What's the recent tenant-quality profile in this submarket — average credit score on applications, eviction rate, late-payment / NSF rate, and stable-employment percentage? A property-management company in the area should have these aggregated.
- How much new for-sale + rental construction is in the pipeline within 1–3 miles? Heavy new supply typically softens prices + rents 12–24 months out; constrained supply supports both.
Investment metrics
- 1% rule
- 1.31% ✓
- Cap rate
- 8.68%
- Cash-on-cash
- 8.51%
- DSCR
- 1.38
- GRM
- 6.4
CMA / ARV
- ARV (on-the-fly)
- $331,980
- Comps found
- 11
Show comp detail 11 sales within ~0.75 mi
| Address | Dist | Beds/Ba | Sqft | Sold | Price | $/sf | Match |
|---|---|---|---|---|---|---|---|
| 22 Webb St | 0.13mi | 3/2.0 | 1,320 (-12%) | 6mo | $347,000 | $263 | 68 |
| 1725 State St | 0.11mi | 4/1.5 (+1) | 1,419 (-6%) | 16mo | $290,000 | $204 | 65 |
| 37 Quaker Rd | 0.61mi | 3/3.0 | 1,538 (+2%) | 2mo | $430,000 | $280 | 62 |
| 58 Webb St | 0.19mi | 4/3.0 (+1) | 1,589 (+5%) | 16mo | $373,000 | $235 | 60 |
| 63 Park Rd | 0.02mi | 2/1.5 (-1) | 1,293 (-14%) | 10mo | $220,500 | $171 | 60 |
| 111 Quaker Rd | 0.47mi | 3/2.0 | 1,556 (+3%) | 19mo | $315,000 | $202 | 57 |
| 63-1/2 Canner St | 0.69mi | 3/2.0 | 1,405 (-7%) | 13mo | $725,000 | $516 | 45 |
| 159 Park Rd | 0.19mi | 2/1.0 (-1) | 1,314 (-13%) | 20mo | $275,000 | $209 | 44 |
| 114 Quaker Rd | 0.49mi | 3/2.0 | 1,313 (-13%) | 21mo | $289,000 | $220 | 38 |
| 25 Warren Pl | 0.74mi | 3/2.0 | 1,384 (-8%) | 17mo | $220,000 | $159 | 38 |
| 301 Davis St | 0.62mi | 3/2.0 | 1,308 (-13%) | 20mo | $350,000 | $268 | 33 |
Match score weights: distance 35% · size 25% · config 20% · recency 20%. Top-matched comps best support the ARV.
Projected returns pro-forma
-3.0% appreciation · 0.21% rent growth · sell at horizon
- IRR
- -7.0%
- Equity multiple
- 0.75×
- Total profit
- $-15,425
- Equity at exit
- $32,788
- IRR
- -2.0%
- Equity multiple
- 0.88×
- Total profit
- $-7,112
- Equity at exit
- $19,013
Cash invested: $61,572 (down + closing). Projections, not guarantees.
Landlord ↔ Tenant lean methodology
- Overall (STATE)
- 27 Tenant-Leaning
- State Connecticut
- 27 Tenant-Leaning · D+7
- County
- — inherits STATE
- City
- — inherits STATE
ZIP-level market 06517
- Rents YoY
- 0.2%
- Active inventory
- 84
- Price-to-rent
- 6.4×
Monthly cashflow live
- Estimated rent
- $2,875 high interval (Pro) →
- Mortgage (P&I)
- −$1,153
- Tax from tax record
- −$589 /mo · $7,072/yr
- Insurance
- −$92
- HOA
- −$0
- Vacancy / Maint / Mgmt
- −$604
- Net cashflow
- $437
Break-even live
UW: 25.0% down · 7.5% · 30yr · 1.5% tax · 5.0% vac · 8.0% maint · 8.0% mgmt
Financing live
Cash to close
- Down payment
- $54,975
- Closing costs
- $6,597
- Reserves months
- —
- Total cash needed
- —
Loan-product check · same deal, 3 products live
Conventional
25% down · 7.5% · 30yr
- Down + closing
- —
- Monthly P&I
- —
- Monthly cashflow
- —
- DSCR
- —
- Eligible?
- —
Personal DTI + credit; lowest rate.
DSCR
20% down · 8.5% · 30yr
- Down + closing
- —
- Monthly P&I
- —
- Monthly cashflow
- —
- DSCR
- —
- Eligible?
- —
No personal income docs; deal must DSCR.
Hard money
10% down · 12.0% · 12mo
- Down + closing
- —
- Monthly P&I
- —
- Monthly cashflow
- —
- DSCR
- —
- Eligible?
- —
Short-term bridge; refi at stabilization.
Rent comps 40 comps
| Address | Beds | Baths | Sqft | Rent | $/sqft | DOM | Units | Dist |
|---|---|---|---|---|---|---|---|---|
| 1835 State St Fl 3 Bedroom Hamden, CT | 3.0 | 1.0 | 1269 | $2,400 | $1.89 | 2d | 1 | 0.15mi |
| 261 View St New Haven, CT | 2.0 | 1.0 | 1100 | $2,400 | $2.18 | 43d | 1 | 0.60mi |
| 68 Anderson St Unit A New Haven, CT | 3.0 | 2.5 | 1693 | $4,500 | $2.66 | 43d | 1 | 0.66mi |
| 52 Canner St Unit 2 New Haven, CT | 2.0 | 1.0 | 1400 | $2,800 | $2.00 | 43d | 1 | 0.72mi |
| 826 Orange St Unit 2 New Haven, CT | 2.0 | 1.0 | 1600 | $3,000 | $1.88 | 43d | 1 | 0.77mi |
| 114 Canner St Unit 1 New Haven, CT | 3.0 | 1.5 | 1382 | $3,750 | $2.71 | 23d | 1 | 0.78mi |
| 253 Willow St Unit 3 New Haven, CT | 2.0 | 1.0 | 1090 | $2,200 | $2.02 | 3d | 1 | 0.82mi |
| 250 Willow St #3 New Haven, CT | 4.0 | 2.0 | 1234 | $3,600 | $2.92 | 3d | 1 | 0.85mi |
| 82 Mechanic St Unit 1 New Haven, CT | 2.0 | 1.0 | 1300 | $2,395 | $1.84 | 23d | 1 | 0.89mi |
| 641 Ferry St New Haven, CT | 4.0 | 1.0 | 1200 | $2,100 | $1.75 | 43d | 1 | 0.89mi |
| 74 Mechanic St Unit 1L New Haven, CT | 3.0 | 1.0 | 1100 | $2,095 | $1.90 | 14d | 1 | 0.90mi |
| 339 Willow St Unit 1 New Haven, CT | 4.0 | 2.0 | 2163 | $4,050 | $1.87 | 11d | 1 | 0.91mi |
| 751 Orange St Unit 2nd floor New Haven, CT | 3.0 | 1.0 | 1090 | $3,000 | $2.75 | 43d | 1 | 0.91mi |
| 751 Orange St Unit 1ST New Haven, CT | 3.0 | 1.0 | 1344 | $3,200 | $2.38 | 43d | 1 | 0.91mi |
| 85 Avon St Unit 2 New Haven, CT | 2.0 | 2.0 | 1288 | $2,725 | $2.12 | 18d | 1 | 0.93mi |
| 79 Avon St Unit 3D New Haven, CT | 2.0 | 1.0 | 1160 | $2,650 | $2.28 | 14d | 1 | 0.93mi |
| 59 Mechanic St New Haven, CT | 2.0 | 1.0 | 1050 | $2,800 | $2.67 | 23d | 1 | 0.94mi |
| 83 Foster St Unit 1 New Haven, CT | 2.0 | 1.0 | 1300 | $2,600 | $2.00 | 43d | 1 | 0.94mi |
| 60 Mechanic St Unit 1 New Haven, CT | 2.0 | 1.0 | 1050 | $1,895 | $1.80 | 23d | 1 | 0.94mi |
| 60 Mechanic St Unit 2 New Haven, CT | 4.0 | 2.0 | 1050 | $3,195 | $3.04 | 43d | 1 | 0.94mi |
| 54 Mechanic St Unit 2nd floor New Haven, CT | 4.0 | 2.0 | 1412 | $3,600 | $2.55 | 43d | 1 | 0.95mi |
| 493 Whitney Ave Unit 3 New Haven, CT | 2.0 | 1.5 | 1400 | $3,150 | $2.25 | 23d | 1 | 0.96mi |
| 1050 State St New Haven, CT | 3.0 | 1.0–2.0 | 919 | $4,854 | $5.28 | 2d | 21 | 0.98mi |
| 34 Cottage St New Haven, CT | 2.0 | 1.0 | 1128 | $2,350 | $2.08 | 43d | 1 | 0.99mi |
| 492 Whitney Ave Unit 4C New Haven, CT | 2.0 | 1.0 | 1060 | $2,600 | $2.45 | 23d | 1 | 1.01mi |
| 20 Lawrence St Unit 2 New Haven, CT | 2.0 | 1.0 | 1050 | $2,000 | $1.90 | 43d | 1 | 1.03mi |
| 437 Whitney Ave New Haven, CT | 2.0 | 1.0–2.0 | 1025 | $2,788 | $2.72 | 2d | 2 | 1.04mi |
| 106 Lawrence St Unit 1 New Haven, CT | 3.0 | 1.0 | 1200 | $3,295 | $2.75 | 43d | 1 | 1.05mi |
| 120 Downing St Unit 3 New Haven, CT | 3.0 | 2.0 | 1800 | $2,450 | $1.36 | 43d | 1 | 1.05mi |
| 187 Lawrence St New Haven, CT | 2.0 | 1.0 | 1500 | $2,950 | $1.97 | 11d | 1 | 1.06mi |
| 548 Ferry St Unit 1 New Haven, CT | 2.0 | 1.0 | 1610 | $2,150 | $1.34 | 14d | 1 | 1.07mi |
| 420 Whitney Ave Unit 424-3B New Haven, CT | 4.0 | 3.0 | 1800 | $4,700 | $2.61 | 3d | 1 | 1.08mi |
| 420 Whitney Ave New Haven, CT | 3.0–4.0 | 2.0–3.0 | 1800 | $2,395 | $1.33 | 11d | 2 | 1.08mi |
| 47 Edwards St Unit 2 New Haven, CT | 3.0 | 1.0 | 1170 | $2,200 | $1.88 | 43d | 1 | 1.09mi |
| 86 Edwards St Unit 1 New Haven, CT | 4.0 | 2.0 | 1080 | $4,500 | $4.17 | 43d | 1 | 1.11mi |
| 28 Edwards St Unit 2 New Haven, CT | 4.0 | 2.0 | 1800 | $3,850 | $2.14 | 14d | 1 | 1.11mi |
| 253 Lawrence St Unit 3 New Haven, CT | 3.0 | 2.0 | 1300 | $3,000 | $2.31 | 43d | 1 | 1.12mi |
| 426 Poplar St New Haven, CT | 3.0 | 1.0 | 1658 | $1,800 | $1.09 | 43d | 1 | 1.15mi |
| 426 Poplar St Unit 2 New Haven, CT | 4.0 | 2.0 | 1405 | $1,800 | $1.28 | 2d | 1 | 1.15mi |
| 122 Atwater St Unit 3 New Haven, CT | 2.0 | 1.0 | 1300 | $1,980 | $1.52 | 3d | 1 | 1.16mi |
Listing history 2 events
-
2026-03-21status Under Contract
-
2026-03-11$219,900 Active
ⓘ Source: listings_history table (triggers on properties + properties_extension) + one-shot
backfill from property_details.listing_events for pre-trigger history.
Tax reassessment forecast CT · Partial reset (capped growth)
- Current annual tax
- $7,072 · $589/mo
- Projected year-2 tax
- $7,072 · $589/mo
- Expected delta
- $0/yr ($0/mo · 0.0%)
ⓘ Screening estimate from a state-policy table — verify with the county assessor before closing.
Climate risk First Street
- Flood 1/10 Low FEMA zone X (unshaded) · 0% chance over 30 yrs
- Wildfire 2/10 Low
- Heat 6/10 Major 7 d/yr ≥99°F today · 15 d/yr by 30 yrs out
- Wind 6/10 Major 54% chance of damaging wind over 30 yrs
- Air quality 5/10 Major 6 unhealthy d/yr today · 8 by 30 yrs out
Nearby sold comps map
Loading sold comps map…
Walkable amenities ~0.75 mi
Loading nearby amenities…
Taxation est. · year 1
- Rental income
- $34,496
- − Mortgage interest
- −$12,318
- − Property taxes
- −$7,072
- − Insurance
- −$1,100
- − Repairs & maintenance
- −$2,760
- − Management
- −$2,760
- − Depreciation
- −$6,397
- Taxable income
- $2,090
- Est. tax owed @ 24.0%
- −$502
- After-tax cash flow
- $4,740/yr
For passive investors: Depreciation is non-cash, so a rental often shows a tax loss while cash-flowing — sheltering income. Rental losses are passive: they offset passive income freely, and up to $25,000/yr can offset ordinary (W-2) income if you actively participate and your MAGI is under $100k (phasing out to $0 by $150k); unused losses carry forward. On sale, claimed depreciation is recaptured at up to 25%, and gains may owe capital-gains tax (a 1031 exchange can defer both). Figures are a year-1 estimate at your 24.0% rate — not tax advice; consult a CPA.
Schools (NCES district)
- District
- Hamden School District
- NCES district ID
- 0901860
- Math proficiency
- 30% ▼ -13.00%
- Reading proficiency
- 43% ▼ -7.00%
- Median HH income
- $68,821
- Composite
- 33.34/100
- National rank
- #5490
- State rank
- #106 of 153 in CT
Livability — New Haven
- Score
- 79/100
- State rank
- #31
- US rank
- #2190
Category grades
Schools grade is shown separately in the Schools card above.
Census & demographics
- County
- New Haven County · 688,236 people
- City population
- 132,813
- Metro
- New Haven-Milford, CT
- Population (ZIP)
- 14,221
- Household income
- $104,550
- Rent vs Own
- Severe rent burden
- 531.0
Population outlook (South Central Connecticut County) Hauer SSP2
- By 2040
- 608,362
Race, ethnicity, and origin ACS 2023
- Neighborhood character
- Diverse neighborhood (Simpson 0.60)
- Race & ethnicity
- White 58% Black 19% Hispanic / Latino 17% Two or more races 7% Asian 2%
- Hispanic origin (detail)
- Puerto Rican 11% Dominican 2%
- Common ancestry
- Romanian 5% Scotch-Irish 2% Lithuanian 2%
- Foreign-born
- 12% · Canada, Jamaica, United Kingdom
- Languages at home
- 80% English-only · Spanish 12% French/Haitian/Cajun 2% Other Indo-European 1%
Political lean MEDSL · South Central Connecticut
- 2024 margin
- Strong D (+20.1) · D 59.0% · R 38.9% · Other 2.1%
- All cycles
- 2024: D+20.1
Not yet ingested
- Civics
- —
Market trends
- HPI YoY
- ▼ -204.00%
- Current HPI
- 255.2756
- Rent YoY
- ▲ 0.21%
- Metro
- New Haven-Milford, CT
- State GDP YoY
- ▲ 1.06%
- F500 in state
- 38
Industry mix (Fortune 500 HQ in CT)
| Industry | F500 HQs | Revenue |
|---|---|---|
| Industrial Machinery | 4 | $38B |
|
||
| Insurance | 3 | $71B |
|
||
| Financial Services | 2 | $25B |
|
||
| Transportation / Logistics | 2 | $18B |
|
||
| Healthcare | 1 | $247B |
|
||
| Telecommunications | 1 | $55B |
|
||
Price history
2 events — show timeline
- 2026-03-21 Pending — Smart MLS
- 2026-03-11 Listed $219,900 Smart MLS
Property tax history
+4.0%/yrLatest (2023): $7,072 · +1.6% YoY. Source: county tax records.
Cash-flow waterfall
monthlySold comps — $/sqft
last 12 mo · ≤1 miLoading sold comps…