8171 Chickadee Ct · Tittabawassee, MI
Flood risk 1/10 · Minimal
- FEMA flood zone
- X
- Chance of flooding over 30 yrs
- 0.0%
- Est. flood insurance / yr
- $507 – $1,088
Fire risk 1/10 · Minimal
- Est. fire insurance / yr
- $784 – $1,456
Heat risk 3/10 · Minor
- Hot days now (above 96°F)
- 7 days/yr
- Hot days in 30 yrs
- 14 days/yr
Wind risk 1/10 · Minimal
- Chance of severe wind over 30 yrs
- —
Air-quality risk 2/10 · Minimal
- Unhealthy air days now
- 1 days/yr
- Unhealthy air days in 30 yrs
- 1 days/yr
Risk factors via First Street. Map © Google.
Why this score? — see what drove the B+ grade
The composite is a weighted blend of 9 inputs, each scored 0–100. Each bar is that input's sub-score; the figure is the points it added to the 100-point composite (weight × sub-score).
- Cash flow +30.0/30.0
- ARV discount +15.0/15.0
- 1% rule +10.0/10.0
- DSCR +10.0/10.0
- Schools +5.1/10.0
- Condition / age +3.8/5.0
- Rent growth +2.5/5.0
- Livability +2.5/5.0
- Appreciation +0.0/10.0
$93,900
🖨 Deal sheet 📄 Offer letter ✓ Due diligence
Listing remarks
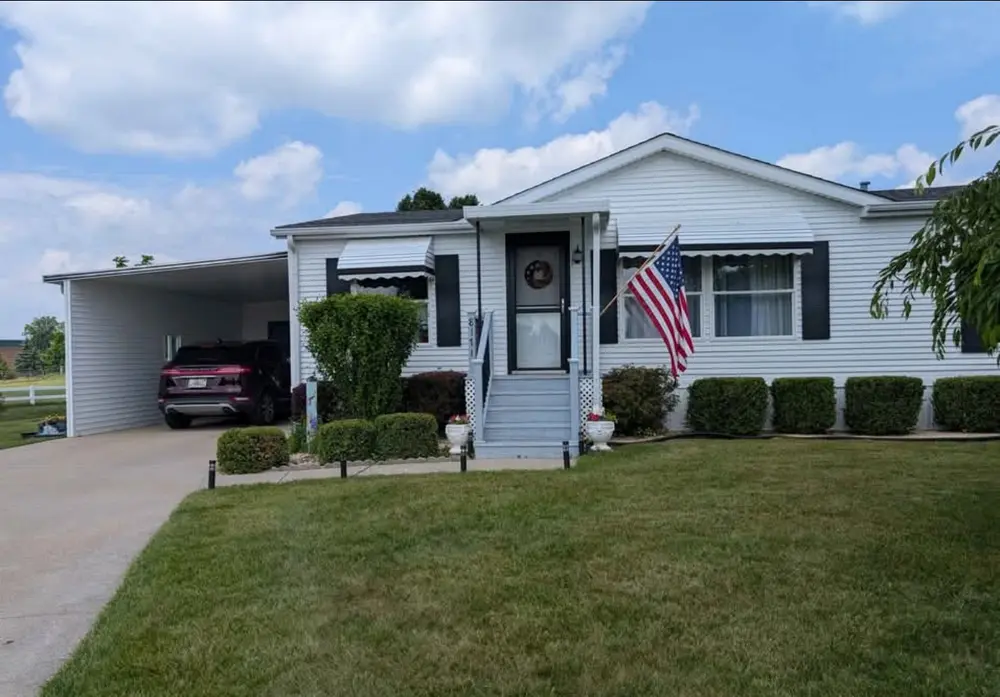
$99,900 Price reduce $20,000 79,900 Charming 3-bedroom, 2-bath home nestled in the well-established 55+ community of Falconview Estates. This beautifully maintained property features a covered carport, spacious covered back porch, and a convenient storage shed. Situated at the end of a quiet cul-de-sac on a generously sized lot, it offers both privacy and comfort. All appliances are included, making this home truly move-in ready. Please private message me for more information.
Key facts
- Quiet cul-de-sac
- Covered carport
- Generously sized lot
Tags
Neighborhood map
What this means for you Summary
Snapshot
- This is a 3-bed/2.0-bath single-family listed at $94k. Condition is rated good.
Deal economics
- At list price, monthly cash flow is $811 ($10k/yr) — positive.
- The deal already cash-flows at list — no discount required.
- Meets the 1% rule at list price ($2k rent vs $94k).
Location & tenants
- Location reads: area grade B — affects rentability + tenant quality, not the cash-flow math above.
- Freeland Community School District (suburban): math 54% / reading 61% proficiency, ranked #46 of 540 in MI (top 8%) — acceptable for families but not a draw, mixed tenant base, ~2y average lease; only 15% free/reduced lunch — higher-income household profile.
- Market conditions: 94 active listings in the ZIP; 154 units permitted in Saginaw County in 2024 (0 in 5+ unit buildings).
Forward outlook
- Local home prices are declining (-3.0%/yr); year-one equity from $649 of loan paydown is wiped out by about $3k of value loss. Plan a longer hold.
- Saginaw County population projected at -25% by 2050 — secular population decline; favor cash flow + early exit over multi-decade hold.
- At projected returns (-3.0% appreciation + 3.0% rent growth), your $26k cash investment doubles in ~4 years — after that, you're playing with house money.
Negotiation context
- Only 14 days on market — expect competitive offers; lowballing is unlikely to land.
Questions for the listing agent
- Built in 1972 — when were the roof, HVAC, electrical panel, plumbing, and water heater last replaced?
- Is there a deadline driving the sale (1031 exchange, divorce, estate, relocation)? That informs how much negotiation room exists.
- What's the average days-on-market for RENTAL listings here right now (not sales)? A rising rental-DOM trend means longer vacancies and softer asking-rent achievability than the comps imply.
- What's the recent tenant-quality profile in this submarket — average credit score on applications, eviction rate, late-payment / NSF rate, and stable-employment percentage? A property-management company in the area should have these aggregated.
- How much new for-sale + rental construction is in the pipeline within 1–3 miles? Heavy new supply typically softens prices + rents 12–24 months out; constrained supply supports both.
Investment metrics
- 1% rule
- 1.97% ✓
- Cap rate
- 16.66%
- Cash-on-cash
- 37.03%
- DSCR
- 2.65
- GRM
- 4.2
CMA / ARV
- ARV (on-the-fly)
- $178,000
- Comps found
- 4
Show comp detail 4 sales within ~0.75 mi
| Address | Dist | Beds/Ba | Sqft | Sold | Price | $/sf | Match |
|---|---|---|---|---|---|---|---|
| 205 N 4th St | 0.66mi | 3/1.0 | 1,096 (+10%) | 8mo | $195,000 | $178 | 42 |
| 175 N Fourth St | 0.67mi | 3/1.0 | 1,120 (+12%) | 12mo | $165,000 | $147 | 35 |
| 335 N Third St | 0.72mi | 2/1.0 (-1) | 912 (-9%) | 10mo | $165,000 | $181 | 35 |
| 175 N Third St | 0.72mi | 3/1.0 | 1,064 (+6%) | 23mo | $105,000 | $99 | 33 |
Match score weights: distance 35% · size 25% · config 20% · recency 20%. Top-matched comps best support the ARV.
Projected returns pro-forma
-3.0% appreciation · 3.0% rent growth · sell at horizon
- IRR
- 32.9%
- Equity multiple
- 2.39×
- Total profit
- $36,491
- Equity at exit
- $14,001
- IRR
- 39.9%
- Equity multiple
- 4.74×
- Total profit
- $98,434
- Equity at exit
- $8,119
Cash invested: $26,292 (down + closing). Projections, not guarantees.
Landlord ↔ Tenant lean methodology
- Overall (STATE)
- 62 Landlord-Friendly
- State Michigan
- 62 Landlord-Friendly · EVEN
- County
- — inherits STATE
- City
- — inherits STATE
ZIP-level market 48623
- Home prices YoY
- -26.7%
- Active inventory
- 94
- Price-to-rent
- 4.2×
Monthly cashflow live
- Estimated rent
- $1,849 medium interval (Pro) →
- Mortgage (P&I)
- −$492
- Tax est. 1.5%
- −$117 /mo · $1,408/yr
- Insurance
- −$39
- HOA
- −$0
- Vacancy / Maint / Mgmt
- −$388
- Net cashflow
- $811
Break-even live
UW: 25.0% down · 7.5% · 30yr · 1.5% tax · 5.0% vac · 8.0% maint · 8.0% mgmt
Financing live
Cash to close
- Down payment
- $23,475
- Closing costs
- $2,817
- Reserves months
- —
- Total cash needed
- —
Loan-product check · same deal, 3 products live
Conventional
25% down · 7.5% · 30yr
- Down + closing
- —
- Monthly P&I
- —
- Monthly cashflow
- —
- DSCR
- —
- Eligible?
- —
Personal DTI + credit; lowest rate.
DSCR
20% down · 8.5% · 30yr
- Down + closing
- —
- Monthly P&I
- —
- Monthly cashflow
- —
- DSCR
- —
- Eligible?
- —
No personal income docs; deal must DSCR.
Hard money
10% down · 12.0% · 12mo
- Down + closing
- —
- Monthly P&I
- —
- Monthly cashflow
- —
- DSCR
- —
- Eligible?
- —
Short-term bridge; refi at stabilization.
Listing history 11 events
-
2026-06-18days on market $93,900 Active 14 DOM
-
2026-06-17days on market $93,900 Active 13 DOM
-
2026-06-16days on market $93,900 Active 12 DOM
-
2026-06-15days on market $93,900 Active 11 DOM
-
2026-06-14days on market $93,900 Active 9 DOM
-
2026-06-12days on market $93,900 Active 8 DOM
-
2026-06-09days on market $93,900 Active 5 DOM
-
2026-06-08days on market $93,900 Active 4 DOM
-
2026-06-07days on market $93,900 Active 3 DOM
-
2026-06-05remarks 482-char remark
-
2026-06-05$93,900 Active 1 DOM
ⓘ Source: listings_history table (triggers on properties + properties_extension) + one-shot
backfill from property_details.listing_events for pre-trigger history.
Climate risk First Street
- Flood 1/10 Low FEMA zone X · 0% chance over 30 yrs
- Wildfire 1/10 Low
- Heat 3/10 Moderate 7 d/yr ≥96°F today · 14 d/yr by 30 yrs out
- Wind 1/10 Low
- Air quality 2/10 Low 1 unhealthy d/yr today · 1 by 30 yrs out
Nearby sold comps map
Loading sold comps map…
Walkable amenities ~0.75 mi
Loading nearby amenities…
Taxation est. · year 1
- Rental income
- $22,182
- − Mortgage interest
- −$5,260
- − Property taxes
- −$1,408
- − Insurance
- −$470
- − Repairs & maintenance
- −$1,775
- − Management
- −$1,775
- − Depreciation
- −$2,732
- Taxable income
- $8,764
- Est. tax owed @ 24.0%
- −$2,103
- After-tax cash flow
- $7,634/yr
For passive investors: Depreciation is non-cash, so a rental often shows a tax loss while cash-flowing — sheltering income. Rental losses are passive: they offset passive income freely, and up to $25,000/yr can offset ordinary (W-2) income if you actively participate and your MAGI is under $100k (phasing out to $0 by $150k); unused losses carry forward. On sale, claimed depreciation is recaptured at up to 25%, and gains may owe capital-gains tax (a 1031 exchange can defer both). Figures are a year-1 estimate at your 24.0% rate — not tax advice; consult a CPA.
Condition & rehab AI · 13 photos
This charming 3-bedroom, 2-bath home in Falconview Estates is move-in ready with a covered carport and spacious covered back porch. It offers a good condition with some minor repairs needed, and updates like fresh paint and modernizing the kitchen can significantly increase its value.
Repairs flagged
- Minor Carport roof — Some discoloration visible on the roof.
Value-add opportunities
- Resale Paint exterior siding — Fresh paint can significantly improve curb appeal.
- Resale Replace dated cabinetry and countertops in kitchen — Modernizing the kitchen can attract more buyers.
- Both Landscaping and lawn maintenance — A well-maintained yard can increase both resale and rental value.
- Both HVAC system maintenance — A clean and efficient HVAC system can improve comfort and energy efficiency, attracting more tenants and buyers.
Renovation cost estimate screening
| Repair item | Severity | Est. cost |
|---|---|---|
| Carport roof · Some discoloration visible on the roof. | Minor | $500–3,000 |
| Total estimated repair cost · 1 items | $500–3,000 |
Value-add ROI direction
- Resale Paint exterior siding — Fresh paint can significantly improve curb appeal. ↑
- Resale Replace dated cabinetry and countertops in kitchen — Modernizing the kitchen can attract more buyers. ↑
- Both Landscaping and lawn maintenance — A well-maintained yard can increase both resale and rental value. ↑
- Both HVAC system maintenance — A clean and efficient HVAC system can improve comfort and energy efficiency, attracting more tenants and buyers. ↑
ⓘ Cost ranges are severity-bucket heuristics (US national rule-of-thumb). Get contractor quotes + a written scope before underwriting a rehab budget.
Schools (NCES district)
- District
- Freeland Community School District
- NCES district ID
- 2615060
- Math proficiency
- 54% ▼ -4.00%
- Reading proficiency
- 61% ▼ -3.00%
- Median HH income
- $70,875
- Composite
- 50.98/100
- National rank
- #1779
- State rank
- #46 of 540 in MI
Livability — Tittabawassee
No livability data for this city. (Only ~50 U.S. cities are tracked.)
Census & demographics
- Census place
- Freeland, MI
- Population (ZIP)
- 15,126
Population outlook (Saginaw County) Hauer SSP2
- Today (2025)
- 180,568 people
- By 2030
- 172,302 · -4.6%
- By 2040
- 153,919 · -14.8%
- By 2050
- 135,519 · -24.9%
- By 2075
- 97,199 · -46.2%
- By 2100
- 65,037 · -64.0%
Race, ethnicity, and origin ACS 2023
- Neighborhood character
- Predominantly White (86%)
- Race & ethnicity
- White 86% Two or more races 5% Black 5% Hispanic / Latino 3%
- Common ancestry
- Romanian 11% Lithuanian 5% Slovak 2%
- Foreign-born
- 0%
- Languages at home
- 97% English-only · Spanish 2%
Political lean MEDSL · Saginaw
- 2024 margin
- Toss-up / Even · D 47.7% · R 51.0% · Other 1.4%
- 2008→2024 swing
- -20.6pp toward R · 2008: 17.3pp · 2024: -3.3pp
- All cycles
- 2024: R+3.3 2020: D+0.3 2016: R+1.1 2012: D+11.9 2008: D+17.3
Not yet ingested
- Civics
- —
Market trends
- HPI YoY
- ▼ -78.02%
- Current HPI
- 213.8908
- Rent YoY
- —
- Metro
- —
- State GDP YoY
- ▲ 1.37%
- F500 in state
- 28
Industry mix (Fortune 500 HQ in MI)
| Industry | F500 HQs | Revenue |
|---|---|---|
| Automotive Parts | 3 | $48B |
|
||
| Automotive | 2 | $372B |
|
||
| Chemicals | 1 | $45B |
|
||
| Automotive Retail | 1 | $29B |
|
||
| Healthcare / Medical Devices | 1 | $23B |
|
||
| Automotive Technology | 1 | $20B |
|
||
Price history
1 event — show timeline
- 2026-06-04 Listed $93,900 ForSaleByOwner.com
Cash-flow waterfall
monthlySold comps — $/sqft
last 12 mo · ≤1 miLoading sold comps…