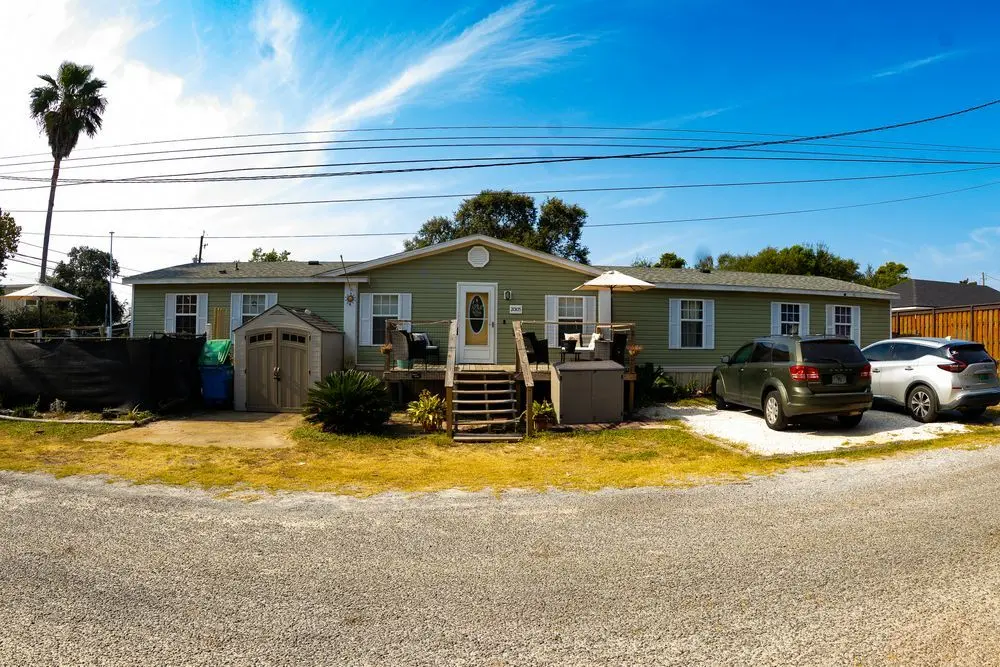
20105 Alta Vista Dr · Laguna Beach, FL
Flood risk 1/10 · Minimal
- FEMA flood zone
- X (unshaded)
- Chance of flooding over 30 yrs
- 0.0%
- Est. flood insurance / yr
- $507 – $1,088
Fire risk 3/10 · Minor
- Est. fire insurance / yr
- $947 – $1,759
Heat risk 10/10 · Severe
- Hot days now (above 105°F)
- 7 days/yr
- Hot days in 30 yrs
- 21 days/yr
Wind risk 10/10 · Severe
- Chance of severe wind over 30 yrs
- 99.0%
Air-quality risk 2/10 · Minimal
- Unhealthy air days now
- 1 days/yr
- Unhealthy air days in 30 yrs
- 1 days/yr
Risk factors via First Street. Map © Google.
Why this score? — see what drove the D+ grade
The composite is a weighted blend of 9 inputs, each scored 0–100. Each bar is that input's sub-score; the figure is the points it added to the 100-point composite (weight × sub-score).
- Cash flow +16.5/30.0
- ARV discount +7.5/15.0
- DSCR +5.1/10.0
- Schools +4.3/10.0
- 1% rule +3.9/10.0
- Livability +3.7/5.0
- Rent growth +2.6/5.0
- Condition / age +2.5/5.0
- Appreciation +0.0/10.0
$359,999
🖨 Deal sheet (PDF) 📄 Offer letter ✓ Due diligence
Listing remarks MLS
LOCATION! LOCATION! LOCATION! Beautiful doublewide mobile home situated on a large corner lot, only two blocks from the Gulf of Mexico. Whether you are looking for your own personal beach retreat or an investment property, this home is in an ideal location. If you have a large family or just want to invite lots of guests, no worries, with 4 bedrooms you can accommodate the entire crowd. This home features two separate family sitting areas, office space, laundry/utility room and a large kitchen with a center island and plenty of storage. The master bedroom can easily accommodate king size furnishings and has a large walk-in closet. The master bathroom offers a double vanity, separate water closet and garden tub. At the opposite end of the home, a full bath and three additional bedrooms Roof and siding replaced in 2022, sceptic inspected and cleaned out 2025
Key facts
- Office space
- Plenty of storage
- Large corner lot
Tags
Neighborhood map
What this means for you Summary
Snapshot
- This is a 3-bed/2.0-bath manufactured listed at $360k.
Deal economics
- At list price, monthly cash flow is $214 ($3k/yr) — positive.
- The deal already cash-flows at list — no discount required.
- To meet the 1% rule (rent ≥ 1% of price), the offer needs to be $320k (11.0% below list).
- Recommended offer: $317k (12.0% below list) — sets the bar for market timing.
- Cap rate 7.0% vs local median 0.9% in Laguna Beach — top-decile yield for the area; either an underpriced asset or a hidden risk that comps aren't pricing in. Stress-test before assuming the spread holds.
Location & tenants
- Location reads 74/100 on livability (#283 in FL, #4,522 nationally) — a middle-class / working-renter tenant base. Strengths: crime A+, housing A+, employment A; Watch: schools F, amenities F.
- Bay (suburban): math 51% / reading 51% proficiency, ranked #29 of 73 in FL (top 40%) — acceptable for families but not a draw, mixed tenant base, ~2y average lease.
- Market conditions: Rents flat; 1272 active listings in the ZIP; 7 comparable units currently listed for rent nearby; rentals at typical pace (median 15d on market — plan ~3-4 weeks tenant-placement turnaround); solid renter incomes; 2,473 units permitted in Bay County in 2024 (559 in 5+ unit buildings).
- At $3,204/mo this rent would consume 48% of the median local household income ($80k/yr) (locally 531% of renters already pay >50% of income on rent) — very limited rent-growth headroom before tenants either downsize or default.
Forward outlook
- Local home prices are declining (-3.0%/yr); year-one equity from $2k of loan paydown is wiped out by about $11k of value loss. Plan a longer hold.
- Bay County population projected at +24% by 2050 — long-run rental-demand tailwind backs the buy-and-hold thesis.
Negotiation context
- It's been on market 272 days — a 12% lower offer ($317k) is reasonable based on typical stale-listing flexibility.
- 14 sale attempts since 21y ago; this cycle's ask has dropped $40k (10%) from the opening price — seller is motivated, your offer sets the floor, not the list.
- Current owner paid $240k; 50% above their basis — modest negotiation headroom, anchor on the comps not their cost.
Risks & watch-outs
- Climate carrying-cost: severe wind risk, 99% chance of damaging wind over 30y; extreme-heat days projected 7→21/yr by 2055 (HVAC capex compounding) — expect insurance premiums to compound above CPI over the hold.
Questions for the listing agent
- It's been on market 272 days. Have you received any prior offers? Is the seller open to a 12% concession, seller financing, or rate buy-down credit?
- Why hasn't it sold? Are there any deal-killer items the seller is aware of (foundation, flood, title, zoning, code violations)?
- Is there a deadline driving the sale (1031 exchange, divorce, estate, relocation)? That informs how much negotiation room exists.
- Schools are F-rated, which usually means shorter tenancies and higher turnover. Who's the typical renter profile here, and what's been the actual vacancy rate?
- The area grade is low — what's the realistic commute time and amenity access for the typical tenant pool here? Any planned neighborhood developments (good or bad) we should know about?
- What's the average days-on-market for RENTAL listings here right now (not sales)? A rising rental-DOM trend means longer vacancies and softer asking-rent achievability than the comps imply.
- What's the recent tenant-quality profile in this submarket — average credit score on applications, eviction rate, late-payment / NSF rate, and stable-employment percentage? A property-management company in the area should have these aggregated.
- How much new for-sale + rental construction is in the pipeline within 1–3 miles? Heavy new supply typically softens prices + rents 12–24 months out; constrained supply supports both.
Investment metrics
- 1% rule
- 0.89% ✗
- Cap rate
- 7.01%
- Cash-on-cash
- 2.55%
- DSCR
- 1.11
- GRM
- 9.4
CMA / ARV
- ARV (median comp)
- $767,452
- List price
- $359,999
- Delta
- -53.09%
- Verdict
- UNDERPRICED
- Comps
- 20 within 1.0 mi
Show comp detail 2 sales within ~0.75 mi
| Address | Dist | Beds/Ba | Sqft | Sold | Price | $/sf | Match |
|---|---|---|---|---|---|---|---|
| 688 Malaga Pl | 0.56mi | 3/2.0 | 1,560 (-12%) | 4mo | $258,000 | $165 | 50 |
| 617 Malaga Pl | 0.55mi | 3/2.0 | 1,512 (-14%) | 2mo | $215,000 | $142 | 49 |
Match score weights: distance 35% · size 25% · config 20% · recency 20%. Top-matched comps best support the ARV.
Projected returns pro-forma
-3.0% appreciation · 0.52% rent growth · sell at horizon
- IRR
- -14.9%
- Equity multiple
- 0.48×
- Total profit
- $-52,565
- Equity at exit
- $53,677
- IRR
- -10.8%
- Equity multiple
- 0.42×
- Total profit
- $-58,915
- Equity at exit
- $31,126
Cash invested: $100,800 (down + closing). Projections, not guarantees.
Landlord ↔ Tenant lean methodology
- Overall (STATE)
- 87 Strongly Landlord-Friendly
- State Florida
- 87 Strongly Landlord-Friendly · R+3
- County
- — inherits STATE
- City
- — inherits STATE
ZIP-level market 32413
- Home prices YoY
- -34.4%
- Rents YoY
- 0.5%
- Active inventory
- 1272
- Price-to-rent
- 9.4×
Monthly cashflow live
- Estimated rent
- $3,204 high interval (Pro) →
- Mortgage (P&I)
- −$1,888
- Tax from tax record
- −$279 /mo · $3,348/yr
- Insurance
- −$150
- HOA
- −$0
- Vacancy / Maint / Mgmt
- −$673
- Net cashflow
- $214
Break-even live
Sensitivity live
| Price | -10% $418 | -5% $316 | +0% $214 | +5% $112 | +10% $10 |
|---|---|---|---|---|---|
| Rent | -10% $-39 | -5% $87 | +0% $214 | +5% $341 | +10% $467 |
| Rate | -1.0pp $395 | -0.5pp $306 | base $214 | +0.5pp $121 | +1.0pp $26 |
UW: 25.0% down · 7.5% · 30yr · 1.5% tax · 5.0% vac · 8.0% maint · 8.0% mgmt
Financing live
Cash to close
- Down payment
- $90,000
- Closing costs
- $10,800
- Reserves months
- —
- Total cash needed
- —
Loan-product check · same deal, 3 products live
Conventional
25% down · 7.5% · 30yr
- Down + closing
- —
- Monthly P&I
- —
- Monthly cashflow
- —
- DSCR
- —
- Eligible?
- —
Personal DTI + credit; lowest rate.
DSCR
20% down · 8.5% · 30yr
- Down + closing
- —
- Monthly P&I
- —
- Monthly cashflow
- —
- DSCR
- —
- Eligible?
- —
No personal income docs; deal must DSCR.
Hard money
10% down · 12.0% · 12mo
- Down + closing
- —
- Monthly P&I
- —
- Monthly cashflow
- —
- DSCR
- —
- Eligible?
- —
Short-term bridge; refi at stabilization.
Rent comps 7 comps
| Address | Beds | Baths | Sqft | Rent | $/sqft | DOM | Units | Dist |
|---|---|---|---|---|---|---|---|---|
| 216 Rose Ln Unit A Panama City Beach, FL | 3.0 | 1.0 | 1280 | $2,175 | $1.70 | 14d | 1 | 0.23mi |
| 238 Oleander Dr Unit 1462121P Panama City, FL | 4.0 | 4.0 | 1732 | $4,298 | $2.48 | 14d | 1 | 0.25mi |
| 121 Christmas Tree Ln Unit 1511625P Panama City Beach, FL | 3.0 | 2.0 | 1496 | $11,089 | $7.41 | 22d | 1 | 0.44mi |
| 100 Downing St #13 Panama City Beach, FL | 3.0 | 2.5 | 1360 | $1,950 | $1.43 | 22d | 1 | 0.74mi |
| 223 E Lakeshore Dr Unit 1511640P Panama City Beach, FL | 4.0 | 3.5 | 2594 | $7,599 | $2.93 | 22d | 1 | 0.79mi |
| 21101 Panama City Beach Pkwy Panama City Beach, FL | 1.0–3.0 | 1.0–2.0 | 1004 | $1,956 | $1.95 | 14d | 12 | 1.16mi |
| 21310 Pompano Ave Unit 1511639P Panama City Beach, FL | 3.0 | 2.0 | 1883 | $6,011 | $3.19 | 14d | 1 | 1.31mi |
Listing history 48 events
-
2026-06-21days on market $359,999 Active 272 DOM
-
2026-06-19days on market $359,999 Active 270 DOM
-
2026-06-18days on market $359,999 Active 269 DOM
-
2026-06-17days on market $359,999 Active 268 DOM
-
2026-06-16days on market $359,999 Active 267 DOM
-
2026-06-15days on market $359,999 Active 266 DOM
-
2026-06-14days on market $359,999 Active 264 DOM
-
2026-06-13days on market $359,999 Active 263 DOM
-
2026-06-10days on market $359,999 Active 261 DOM
-
2026-06-09days on market $359,999 Active 260 DOM
-
2026-06-08days on market $359,999 Active 259 DOM
-
2026-06-07days on market $359,999 Active 258 DOM
-
2026-06-05days on market $359,999 Active 255 DOM
-
2026-06-03days on market $359,999 Active 254 DOM
-
2026-06-02days on market $359,999 Active 253 DOM
-
2026-06-01days on market $359,999 Active 252 DOM
-
2026-05-31days on market $359,999 Active 251 DOM
-
2026-05-30days on market $359,999 Active 250 DOM
-
2025-11-12soldstatus $240,000
-
2025-10-08price $359,999 869-char remark
Show marketing remark (869 chars)
LOCATION! LOCATION! LOCATION! Beautiful doublewide mobile home situated on a large corner lot, only two blocks from the Gulf of Mexico. Whether you are looking for your own personal beach retreat or an investment property, this home is in an ideal location. If you have a large family or just want to invite lots of guests, no worries, with 4 bedrooms you can accommodate the entire crowd. This home features two separate family sitting areas, office space, laundry/utility room and a large kitchen with a center island and plenty of storage. The master bedroom can easily accommodate king size furnishings and has a large walk-in closet. The master bathroom offers a double vanity, separate water closet and garden tub. At the opposite end of the home, a full bath and three additional bedrooms Roof and siding replaced in 2022, sceptic inspected and cleaned out 2025
-
2025-09-22$399,999 Active 869-char remark
Show marketing remark (869 chars)
LOCATION! LOCATION! LOCATION! Beautiful doublewide mobile home situated on a large corner lot, only two blocks from the Gulf of Mexico. Whether you are looking for your own personal beach retreat or an investment property, this home is in an ideal location. If you have a large family or just want to invite lots of guests, no worries, with 4 bedrooms you can accommodate the entire crowd. This home features two separate family sitting areas, office space, laundry/utility room and a large kitchen with a center island and plenty of storage. The master bedroom can easily accommodate king size furnishings and has a large walk-in closet. The master bathroom offers a double vanity, separate water closet and garden tub. At the opposite end of the home, a full bath and three additional bedrooms Roof and siding replaced in 2022, sceptic inspected and cleaned out 2025
-
2021-12-14historical
-
2021-12-14historical
-
2021-12-14historical
-
2021-12-09historical
-
2021-12-09historical
-
2021-12-09historical
-
2021-12-09historical
-
2021-12-09historical
-
2019-04-15soldstatus $210,000
-
2019-04-09soldstatus $210,000
-
2019-04-09soldstatus $210,000
-
2018-11-16$219,000
-
2018-11-16$219,000
-
2016-01-19historical
-
2015-05-04$159,900
-
2014-07-21$174,900
-
2014-02-20$174,900
-
2011-08-08soldstatus $50,000
-
2007-01-06$190,000
-
2007-01-06$190,000
-
2006-01-10$219,000
-
2005-11-11historical
-
2005-07-01$239,900
-
2005-07-01$239,900
-
2005-07-01$239,900
-
2005-01-11$239,900
-
2005-01-11$249,900
ⓘ Source: listings_history table (triggers on properties + properties_extension) + one-shot
backfill from property_details.listing_events for pre-trigger history.
Tax reassessment forecast FL · Resets to sale price
- Current annual tax
- $3,348 · $279/mo
- Projected year-2 tax
- $3,348 · $279/mo
- Expected delta
- $0/yr ($0/mo · 0.0%)
ⓘ Screening estimate from a state-policy table — verify with the county assessor before closing.
Climate risk First Street
- Flood 1/10 Low FEMA zone X (unshaded) · 0% chance over 30 yrs
- Wildfire 3/10 Moderate
- Heat 10/10 Extreme 7 d/yr ≥105°F today · 21 d/yr by 30 yrs out
- Wind 10/10 Extreme 99% chance of damaging wind over 30 yrs
- Air quality 2/10 Low 1 unhealthy d/yr today · 1 by 30 yrs out
Nearby sold comps map
Loading sold comps map…
Walkable amenities ~0.75 mi
Loading nearby amenities…
Taxation est. · year 1
- Rental income
- $38,443
- − Mortgage interest
- −$20,166
- − Property taxes
- −$3,348
- − Insurance
- −$1,800
- − Repairs & maintenance
- −$3,075
- − Management
- −$3,075
- − Depreciation
- −$10,473
- Taxable loss
- −$3,494
- Est. tax savings @ 24.0%
- +$839
- After-tax cash flow
- $3,406/yr
For passive investors: Depreciation is non-cash, so a rental often shows a tax loss while cash-flowing — sheltering income. Rental losses are passive: they offset passive income freely, and up to $25,000/yr can offset ordinary (W-2) income if you actively participate and your MAGI is under $100k (phasing out to $0 by $150k); unused losses carry forward. On sale, claimed depreciation is recaptured at up to 25%, and gains may owe capital-gains tax (a 1031 exchange can defer both). Figures are a year-1 estimate at your 24.0% rate — not tax advice; consult a CPA.
Schools (NCES district)
- District
- Bay
- NCES district ID
- 1200090
- Math proficiency
- 51% ▼ -8.00%
- Reading proficiency
- 51% ▼ -7.00%
- Median HH income
- $47,740
- Composite
- 43.41/100
- National rank
- #3014
- State rank
- #29 of 73 in FL
Livability — Laguna Beach
- Score
- 74/100
- State rank
- #283
- US rank
- #4522
Category grades
Schools grade is shown separately in the Schools card above.
Census & demographics
- Census place
- Laguna Beach, FL
- County
- Bay County · 163,593 people
- Metro
- Panama City, FL
- Population (ZIP)
- 15,453
- Household income
- $80,039
- Rent vs Own
- Severe rent burden
- 531.0
Population outlook (Bay County) Hauer SSP2
- Today (2025)
- 206,264 people
- By 2030
- 217,740 · +5.6%
- By 2040
- 238,738 · +15.7%
- By 2050
- 255,545 · +23.9%
- By 2075
- 288,295 · +39.8%
- By 2100
- 288,638 · +39.9%
Race, ethnicity, and origin ACS 2023
- Neighborhood character
- Predominantly White (87%)
- Race & ethnicity
- White 87% Hispanic / Latino 8% Two or more races 6% Black 1%
- Hispanic origin (detail)
- Mexican 1% Puerto Rican 2%
- Common ancestry
- Slovak 3% Italian 3% Lithuanian 2%
- Foreign-born
- 8% · Canada, Jamaica
- Languages at home
- 91% English-only · Spanish 6% Other Indo-European 1% Russian/Polish/Slavic 0%
Political lean MEDSL · Bay
- 2024 margin
- Solid R (+47.4) · D 25.8% · R 73.1% · Other 1.1%
- 2008→2024 swing
- -6.6pp toward R · 2008: -40.7pp · 2024: -47.4pp
- All cycles
- 2024: R+47.4 2020: R+43.5 2016: R+46.3 2012: R+43.6 2008: R+40.7
Not yet ingested
- Civics
- —
Market trends
- HPI YoY
- ▼ -185.97%
- Current HPI
- 354.7469
- Rent YoY
- ▲ 0.52%
- Metro
- Panama City, FL
- State GDP YoY
- ▲ 3.28%
- F500 in state
- 36
Industry mix (Fortune 500 HQ in FL)
| Industry | F500 HQs | Revenue |
|---|---|---|
| Industrial Technology | 2 | $29B |
|
||
| Insurance | 2 | $17B |
|
||
| Retail | 1 | $60B |
|
||
| Technology Distribution | 1 | $58B |
|
||
| Homebuilding | 1 | $35B |
|
||
| Technology Manufacturing | 1 | $35B |
|
||
Price history
+0.0% since first listed30 events — show timeline
- 2025-11-12 Sold (Public Records) $240,000 Public Records
- 2025-10-08 Price Changed $359,999 ForSaleByOwner.com
- 2025-09-22 Listed $399,999 ForSaleByOwner.com
- 2021-12-14 Listing Removed — CPARMLS
- 2021-12-14 Listing Removed — CPARMLS
- 2021-12-14 Listing Removed — CPARMLS
- 2021-12-09 Listing Removed — CPARMLS
- 2021-12-09 Listing Removed — CPARMLS
- 2021-12-09 Listing Removed — CPARMLS
- 2021-12-09 Listing Removed — CPARMLS
- 2021-12-09 Listing Removed — CPARMLS
- 2019-04-15 Sold (Public Records) $210,000 Public Records
- 2019-04-09 Sold (MLS) $210,000 ECAR
- 2019-04-09 Sold (MLS) $210,000 NAMLS
- 2018-11-16 Listed $219,000 ECAR
- 2018-11-16 Listed $219,000 NAMLS
- 2016-01-19 Listing Removed — CPARMLS
- 2015-05-04 Listed $159,900 CPARMLS
- 2014-07-21 Listed $174,900 CPARMLS
- 2014-02-20 Listed $174,900 CPARMLS
- 2011-08-08 Sold (Public Records) $50,000 Public Records
- 2007-01-06 Listed $190,000 CPARMLS
- 2007-01-06 Listed $190,000 CPARMLS
- 2006-01-10 Listed $219,000 CPARMLS
- 2005-11-11 Listing Removed — NAMLS
- 2005-07-01 Listed $239,900 NAMLS
- 2005-07-01 Listed $239,900 ECAR
- 2005-07-01 Listed $239,900 CPARMLS
- 2005-01-11 Listed $249,900 CPARMLS
- 2005-01-11 Listed $239,900 CPARMLS
Property tax history
+7.7%/yrLatest (2025): $3,348 · +8.9% YoY. Source: county tax records.
Cash-flow waterfall
monthlySold comps — $/sqft
last 12 mo · ≤1 miLoading sold comps…