9128 Slateville Rd · Lynn, PA
Flood risk 4/10 · Minor
- FEMA flood zone
- X (unshaded)
- Chance of flooding over 30 yrs
- 0.22%
- Est. flood insurance / yr
- $473 – $860
Fire risk 3/10 · Minor
- Est. fire insurance / yr
- $511 – $949
Heat risk 4/10 · Minor
- Hot days now (above 98°F)
- 7 days/yr
- Hot days in 30 yrs
- 15 days/yr
Wind risk 4/10 · Minor
- Chance of severe wind over 30 yrs
- 13.0%
Air-quality risk 2/10 · Minimal
- Unhealthy air days now
- 1 days/yr
- Unhealthy air days in 30 yrs
- 3 days/yr
Risk factors via First Street. Map © Google.
Why this score? — see what drove the C- grade
The composite is a weighted blend of 9 inputs, each scored 0–100. Each bar is that input's sub-score; the figure is the points it added to the 100-point composite (weight × sub-score).
- ARV discount +15.0/15.0
- Cash flow +11.0/30.0
- Appreciation +7.4/10.0
- Schools +4.6/10.0
- DSCR +3.2/10.0
- 1% rule +2.6/10.0
- Rent growth +2.5/5.0
- Livability +2.5/5.0
- Condition / age +2.5/5.0
$185,000
🖨 Deal sheet (PDF) 📄 Offer letter ✓ Due diligence
Listing remarks MLS
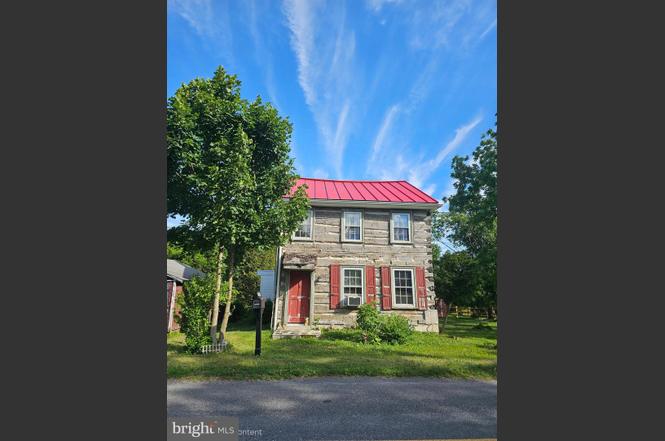
Located in the highly sought-after Northwestern Lehigh School District, this rare circa-1880 log home offers historic character, flexible living space, and a unique opportunity to own a piece of local history. Situated on approximately 1/4 acre lot across two parcels, the property features 4 bedrooms, 1 full bath, and a finished third level with fixtures in place for a potential second bathroom that are not currently connected. Used primarily as a seasonal retreat in recent years, the home retains much of its original charm and authenticity. Inside, you'll find exposed hand-hewn log walls, original wood beams, wide-plank floors, and architectural details that showcase the craftsmanship of a bygone era. Multiple living areas provide flexibility for everyday living, while the updated full bathroom offers modern convenience. The rustic kitchen and historic interior create a warm and inviting atmosphere for those who appreciate the character and charm of older homes. Outside, the home's striking log exterior and metal roof contribute to its timeless appeal. Mature trees and yard space spanning two lots provide room for gardening, outdoor enjoyment, and future possibilities. The additional parcel enhances the sense of space and privacy while offering flexibility rarely found with historic village properties. Whether you're searching for a full-time residence, a weekend getaway, a seasonal retreat, or a unique property to restore and personalize, this one-of-a-kind home offers character, history, and potential in a desirable Northwestern Lehigh location. Rich in original craftsmanship and ready for its next chapter, the property presents an opportunity to preserve a remarkable piece of the past while adding your own vision for the future!
Key facts
- Original wood beams
- Wide plank floors
- Circa 1880 log home
Tags
Property features AI
Exterior
- Parking: Off-street parking
- Utilities: Well water; On-site septic; Electric service
- Home design: Detached structure; Finished above-grade area approximately 1,188; Below-grade area approximately 600
- Construction: Log siding and shake siding; Metal roof; Permanent foundation; Above- and below-grade structures
- Exterior features: Patio(s); Lot dimensions approximately 37 x 116
Interior
- Kitchen: Cooktop
- Bedrooms: Three bedrooms on the first upper level; One bedroom on the second upper level
- Flooring: Hardwood floors
- Bathrooms: One full bathroom (all upper levels)
- Heating & cooling: Electric baseboard heating; Window cooling units
- Interior features: Beamed ceilings; Log wall construction; Estimated living area
- Laundry & utility: Basement present (full); Electric hot water
Neighborhood map
What this means for you Summary
Snapshot
- This is a 3-bed/1.0-bath single-family listed at $185k.
Deal economics
- At list price, monthly cash flow is $-79 ($-945/yr) — negative.
- To cash-flow at today's rent, offer at most $171k (7.5% below list).
- To meet the 1% rule (rent ≥ 1% of price), the offer needs to be $141k (23.7% below list).
- Recommended offer: $141k (23.7% below list) — sets the bar for 1% rule.
Location & tenants
- Location reads: area grade C — affects rentability + tenant quality, not the cash-flow math above.
- Northwestern Lehigh SD (rural): math 42% / reading 60% proficiency, ranked #128 of 539 in PA (top 24%) — acceptable for families but not a draw, mixed tenant base, ~2y average lease; only 11% free/reduced lunch — higher-income household profile.
- Zoned schools: Northwestern Lehigh El Sch (math 32% / reading 52%, grade F, #883 of 1,518 statewide, top 61%, 423 students, 26% FRL); Northwestern Lehigh Ms (math 36% / reading 58%, grade D+, #163 of 512 statewide, top 33%, 465 students, 25% FRL); Northwestern Lehigh Hs (math 67%, 695 students, 14% FRL).
- Market conditions: 11 active listings in the ZIP; 765 units permitted in Lehigh County in 2024 (286 in 5+ unit buildings).
Forward outlook
- In year one you build about $10k of equity ($1k loan paydown + $9k appreciation (4.9% local appreciation)).
- Lehigh County population projected at +21% by 2050 — long-run rental-demand tailwind backs the buy-and-hold thesis.
- At projected returns (4.9% appreciation + 3.0% rent growth), your $52k cash investment doubles in ~5 years — after that, you're playing with house money.
- By year 4, paydown + projected appreciation supports a ~$35k cash-out refi (75% LTV) — recoverable capital for the next deal without selling this one.
Negotiation context
- Only 1 days on market — expect competitive offers; lowballing is unlikely to land.
- 3 sale attempts with the ask held roughly flat each time — persistent listings suggest the price (not the market) is what's stuck; bring a comps-based counter.
- Current owner paid $69k; list at $185k implies a 168% gain — meaningful room to come down on a strong offer.
Risks & watch-outs
- Watch-outs: built in 1860 — expect roof / HVAC / electrical / plumbing capex.
Questions for the listing agent
- What do current leases actually rent for vs. the listed asking? Can we see a recent rent roll and the last 12 months of T-12 income?
- Built in 1860 — when were the roof, HVAC, electrical panel, plumbing, and water heater last replaced?
- Is there a deadline driving the sale (1031 exchange, divorce, estate, relocation)? That informs how much negotiation room exists.
- What's the average days-on-market for RENTAL listings here right now (not sales)? A rising rental-DOM trend means longer vacancies and softer asking-rent achievability than the comps imply.
- What's the recent tenant-quality profile in this submarket — average credit score on applications, eviction rate, late-payment / NSF rate, and stable-employment percentage? A property-management company in the area should have these aggregated.
- How much new for-sale + rental construction is in the pipeline within 1–3 miles? Heavy new supply typically softens prices + rents 12–24 months out; constrained supply supports both.
Investment metrics
- 1% rule
- 0.76% ✗
- Cap rate
- 5.78%
- Cash-on-cash
- -1.82%
- DSCR
- 0.92
- GRM
- 10.9
CMA / ARV
- ARV (on-the-fly)
- $272,052
- Comps found
- 2
Show comp detail 2 sales within ~0.75 mi
| Address | Dist | Beds/Ba | Sqft | Sold | Price | $/sf | Match |
|---|---|---|---|---|---|---|---|
| 7822 Dresher Rd | 0.14mi | 3/1.0 | 1,078 (-9%) | 23mo | $247,000 | $229 | 59 |
| 7534 Dresher Rd | 0.25mi | 3/2.0 | 1,358 (+14%) | 22mo | $275,000 | $203 | 42 |
Match score weights: distance 35% · size 25% · config 20% · recency 20%. Top-matched comps best support the ARV.
Projected returns pro-forma
4.9% appreciation · 3.0% rent growth · sell at horizon
- IRR
- 11.1%
- Equity multiple
- 1.70×
- Total profit
- $36,481
- Equity at exit
- $103,653
- IRR
- 12.4%
- Equity multiple
- 3.22×
- Total profit
- $115,128
- Equity at exit
- $177,920
Cash invested: $51,800 (down + closing). Projections, not guarantees.
Landlord ↔ Tenant lean methodology
- Overall (STATE)
- 62 Landlord-Friendly
- State Pennsylvania
- 62 Landlord-Friendly · EVEN
- County
- — inherits STATE
- City
- — inherits STATE
ZIP-level market 19529
- Home prices YoY
- 1.7%
- Active inventory
- 11
- Price-to-rent
- 10.9×
Monthly cashflow live
- Estimated rent
- $1,411 medium interval (Pro) →
- Mortgage (P&I)
- −$970
- Tax from tax record
- −$146 /mo · $1,752/yr
- Insurance
- −$77
- HOA
- −$0
- Vacancy / Maint / Mgmt
- −$296
- Net cashflow
- $-79
Break-even live
Sensitivity live
| Price | -10% $26 | -5% $-26 | +0% $-79 | +5% $-131 | +10% $-183 |
|---|---|---|---|---|---|
| Rent | -10% $-190 | -5% $-134 | +0% $-79 | +5% $-23 | +10% $33 |
| Rate | -1.0pp $14 | -0.5pp $-32 | base $-79 | +0.5pp $-127 | +1.0pp $-175 |
UW: 25.0% down · 7.5% · 30yr · 1.5% tax · 5.0% vac · 8.0% maint · 8.0% mgmt
Financing live
Cash to close
- Down payment
- $46,250
- Closing costs
- $5,550
- Reserves months
- —
- Total cash needed
- —
Loan-product check · same deal, 3 products live
Conventional
25% down · 7.5% · 30yr
- Down + closing
- —
- Monthly P&I
- —
- Monthly cashflow
- —
- DSCR
- —
- Eligible?
- —
Personal DTI + credit; lowest rate.
DSCR
20% down · 8.5% · 30yr
- Down + closing
- —
- Monthly P&I
- —
- Monthly cashflow
- —
- DSCR
- —
- Eligible?
- —
No personal income docs; deal must DSCR.
Hard money
10% down · 12.0% · 12mo
- Down + closing
- —
- Monthly P&I
- —
- Monthly cashflow
- —
- DSCR
- —
- Eligible?
- —
Short-term bridge; refi at stabilization.
Listing history 2 events
-
2026-06-22remarks 699-char remark
-
2026-06-22$185,000 Active 1 DOM
ⓘ Source: listings_history table (triggers on properties + properties_extension) + one-shot
backfill from property_details.listing_events for pre-trigger history.
Tax reassessment forecast PA · Partial reset (capped growth)
- Current annual tax
- $1,752 · $146/mo
- Projected year-2 tax
- $2,338 · $195/mo
- Expected delta
- +$585/yr (+$49/mo · 33.4%)
ⓘ Screening estimate from a state-policy table — verify with the county assessor before closing.
Climate risk First Street
- Flood 4/10 Moderate FEMA zone X (unshaded) · 22% chance over 30 yrs
- Wildfire 3/10 Moderate
- Heat 4/10 Moderate 7 d/yr ≥98°F today · 15 d/yr by 30 yrs out
- Wind 4/10 Moderate 13% chance of damaging wind over 30 yrs
- Air quality 2/10 Low 1 unhealthy d/yr today · 3 by 30 yrs out
Nearby sold comps map
Loading sold comps map…
Walkable amenities ~0.75 mi
Loading nearby amenities…
Taxation est. · year 1
- Rental income
- $16,930
- − Mortgage interest
- −$10,363
- − Property taxes
- −$1,752
- − Insurance
- −$925
- − Repairs & maintenance
- −$1,354
- − Management
- −$1,354
- − Depreciation
- −$5,382
- Taxable loss
- −$4,201
- Est. tax savings @ 24.0%
- +$1,008
- After-tax cash flow
- $63/yr
For passive investors: Depreciation is non-cash, so a rental often shows a tax loss while cash-flowing — sheltering income. Rental losses are passive: they offset passive income freely, and up to $25,000/yr can offset ordinary (W-2) income if you actively participate and your MAGI is under $100k (phasing out to $0 by $150k); unused losses carry forward. On sale, claimed depreciation is recaptured at up to 25%, and gains may owe capital-gains tax (a 1031 exchange can defer both). Figures are a year-1 estimate at your 24.0% rate — not tax advice; consult a CPA.
Schools (NCES district)
- District
- Northwestern Lehigh SD
- NCES district ID
- 4217850
- Math proficiency
- 42% ▼ -17.00%
- Reading proficiency
- 60% ▼ -15.00%
- Median HH income
- $76,852
- Composite
- 46.11/100
- National rank
- #2508
- State rank
- #128 of 539 in PA
Livability — Lynn
No livability data for this city. (Only ~50 U.S. cities are tracked.)
Census & demographics
- Population (ZIP)
- 3,228
Population outlook (Lehigh County) Hauer SSP2
- Today (2025)
- 392,957 people
- By 2030
- 408,319 · +3.9%
- By 2040
- 440,007 · +12.0%
- By 2050
- 475,940 · +21.1%
- By 2075
- 590,448 · +50.3%
- By 2100
- 690,314 · +75.7%
Race, ethnicity, and origin ACS 2023
- Neighborhood character
- Predominantly White (90%)
- Race & ethnicity
- White 90% Two or more races 3%
- Common ancestry
- Polish 5% Iranian 5% Italian 4%
- Foreign-born
- 2%
- Languages at home
- 97% English-only · German/W. Germanic 3%
Political lean MEDSL · Lehigh
- 2024 margin
- Toss-up / Even · D 50.7% · R 48.0% · Other 1.2%
- 2008→2024 swing
- -12.9pp toward R · 2008: 15.6pp · 2024: 2.7pp
- All cycles
- 2024: D+2.7 2020: D+7.6 2016: D+4.4 2012: D+7.5 2008: D+15.6
Not yet ingested
- Civics
- —
Market trends
- HPI YoY
- ▲ 4.90%
- Current HPI
- 292.9695
- Rent YoY
- —
- Metro
- —
- State GDP YoY
- ▲ 1.68%
- F500 in state
- 34
Industry mix (Fortune 500 HQ in PA)
| Industry | F500 HQs | Revenue |
|---|---|---|
| Healthcare | 2 | $309B |
|
||
| Insurance | 2 | $27B |
|
||
| Telecommunications / Media | 1 | $124B |
|
||
| Industrial Distribution | 1 | $22B |
|
||
| Financial Services | 1 | $20B |
|
||
| Chemicals / Materials | 1 | $18B |
|
||
Price history
+325.3% since first listed5 events — show timeline
- 2026-06-20 Listed $185,000 PMAR
- 2026-06-20 Listed $185,000 BRIGHT MLS
- 2026-06-20 Listed $185,000 GLVRMLS
- 1998-01-29 Sold (Public Records) $69,000 Public Records
- 1989-07-01 Sold (Public Records) $43,500 Public Records
Property tax history
+2.0%/yrLatest (2026): $1,752 · +2.9% YoY. Source: county tax records.
Cash-flow waterfall
monthlySold comps — $/sqft
last 12 mo · ≤1 miLoading sold comps…