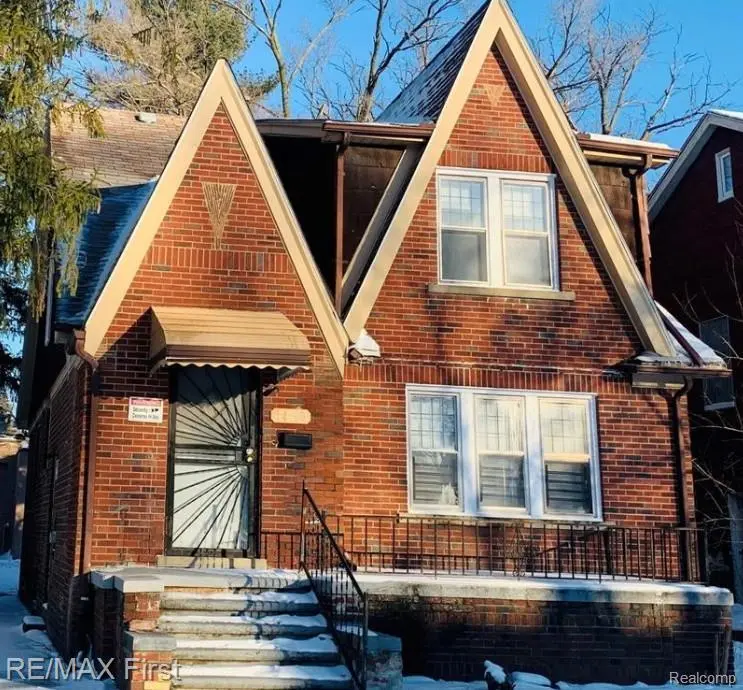
14960 Tracey St · Detroit, MI
Flood risk 1/10 · Minimal
- FEMA flood zone
- X (unshaded)
- Chance of flooding over 30 yrs
- 0.0%
- Est. flood insurance / yr
- $473 – $860
Fire risk 1/10 · Minimal
- Est. fire insurance / yr
- $784 – $1,456
Heat risk 3/10 · Minor
- Hot days now (above 97°F)
- 7 days/yr
- Hot days in 30 yrs
- 15 days/yr
Wind risk 2/10 · Minimal
- Chance of severe wind over 30 yrs
- —
Air-quality risk 3/10 · Minor
- Unhealthy air days now
- 2 days/yr
- Unhealthy air days in 30 yrs
- 5 days/yr
Risk factors via First Street. Map © Google.
Why this score? — see what drove the C+ grade
The composite is a weighted blend of 9 inputs, each scored 0–100. Each bar is that input's sub-score; the figure is the points it added to the 100-point composite (weight × sub-score).
- Cash flow +30.0/30.0
- 1% rule +10.0/10.0
- DSCR +10.0/10.0
- Rent growth +3.9/5.0
- Livability +3.7/5.0
- Condition / age +2.5/5.0
- Schools +1.3/10.0
- ARV discount +0.0/15.0
- Appreciation +0.0/10.0
$81,900
🖨 Deal sheet (PDF) 📄 Offer letter ✓ Due diligence
Listing remarks MLS
Lovely four-bedroom brick, updated kitchen, partially finished basement. Perfect starter home or great investment. The accuracy of all information, regardless of the source, is not guaranteed or warranted. All information should be independently verified. Tenant occupied, paying $1000 per month. Need 72 hours notification for showings.
Key facts
- 3,485 sq ft lot
- 2 garage spots
- Built 1928
Property features AI
Finance
- Other: Lot approximately 0.08 acres (35 x 106)
- Financial info: Tax amount available but excluded per instructions
- HOA & community: No HOA information provided
Exterior
- Parking: Detached 2-car garage; Driveway
- Security: Not specified
- Utilities: Public water; Public sewer; Cable available
- Home design: Single-family residence; Two levels; Ground-level entry with steps; Brick construction; Facing/entry direction not specified
- Construction: Brick exterior; Asphalt roof; Block foundation; Unfinished basement
- Exterior features: Porch; Paved road access
Interior
- Kitchen: No kitchen appliance list provided
- Bedrooms: Total of 7 rooms (bedroom count not specified)
- Flooring: Not specified
- Bathrooms: 1 full bathroom; 2 half bathrooms
- Heating & cooling: Forced air heating; Natural gas heating; No central cooling
- Interior features: Gas water heater; Awning(s)
- Laundry & utility: Washer hookup; Gas dryer hookup
Neighborhood map
What this means for you Summary
Snapshot
- This is a 4-bed/1.0-bath single-family listed at $82k.
Deal economics
- At list price, monthly cash flow is $433 ($5k/yr) — positive.
- The deal already cash-flows at list — no discount required.
- Meets the 1% rule at list price ($1k rent vs $82k).
- Recommended offer: $81k (1.5% below list) — sets the bar for market timing.
- Cap rate 12.6% vs local median 10.0% in Detroit — meaningfully above typical; check what's discounted (condition, days-on-market, listing class) to confirm the premium yield is real.
Location & tenants
- Location reads 73/100 on livability (#218 in MI) — a middle-class / working-renter tenant base. Strengths: amenities A+, commute A+, cost of living A+; Watch: schools F, crime F, employment F.
- Detroit Public Schools Community District (urban): math 10% / reading 24% proficiency, ranked #499 of 540 in MI (top 92%) — low school quality limits family demand, transient renter base, plan for 1-2y turnover; 90% free/reduced lunch — lower-income household profile, screen leases tightly.
- Market conditions: Rents rising fast (+5.6%/yr); 392 active listings in the ZIP; 40 comparable units currently listed for rent nearby; rentals at typical pace (median 19d on market — plan ~3-4 weeks tenant-placement turnaround); lower-income renter base — watch delinquency; 2,639 units permitted in Wayne County in 2024 (1,216 in 5+ unit buildings).
- At $1,387/mo this rent would consume 46% of the median local household income ($37k/yr) (locally 2371% of renters already pay >50% of income on rent) — very limited rent-growth headroom before tenants either downsize or default.
Forward outlook
- Local home prices are declining (-3.0%/yr); year-one equity from $566 of loan paydown is wiped out by about $2k of value loss. Plan a longer hold.
- Wayne County population projected at -17% by 2050 — secular population decline; favor cash flow + early exit over multi-decade hold.
- At projected returns (-3.0% appreciation + 5.6% rent growth), your $23k cash investment doubles in ~5 years — after that, you're playing with house money.
Negotiation context
- It's been on market 18 days — a 2% lower offer ($81k) is reasonable based on typical stale-listing flexibility.
- 13 sale attempts since 20y ago with the ask held roughly flat each time — persistent listings suggest the price (not the market) is what's stuck; bring a comps-based counter.
Risks & watch-outs
- Watch-outs: property tax is 2.9% of price; built in 1928 — expect roof / HVAC / electrical / plumbing capex.
Questions for the listing agent
- Built in 1928 — when were the roof, HVAC, electrical panel, plumbing, and water heater last replaced?
- Property tax is high relative to price — has the assessment been appealed recently, and will the sale trigger a re-assessment?
- Is there a deadline driving the sale (1031 exchange, divorce, estate, relocation)? That informs how much negotiation room exists.
- Schools are F-rated, which usually means shorter tenancies and higher turnover. Who's the typical renter profile here, and what's been the actual vacancy rate?
- Crime grade is F in this area — have there been break-ins, vandalism, or insurance claims at this property in the last 3 years? What carrier currently insures it and at what premium?
- What's the average days-on-market for RENTAL listings here right now (not sales)? A rising rental-DOM trend means longer vacancies and softer asking-rent achievability than the comps imply.
- What's the recent tenant-quality profile in this submarket — average credit score on applications, eviction rate, late-payment / NSF rate, and stable-employment percentage? A property-management company in the area should have these aggregated.
- How much new for-sale + rental construction is in the pipeline within 1–3 miles? Heavy new supply typically softens prices + rents 12–24 months out; constrained supply supports both.
Investment metrics
- 1% rule
- 1.69% ✓
- Cap rate
- 12.64%
- Cash-on-cash
- 22.66%
- DSCR
- 2.01
- GRM
- 4.9
CMA / ARV
- ARV (median comp)
- $55,332
- List price
- $81,900
- Delta
- 48.01%
- Verdict
- OVERPRICED
- Comps
- 20 within 1.0 mi
Show comp detail 12 sales within ~0.75 mi
| Address | Dist | Beds/Ba | Sqft | Sold | Price | $/sf | Match |
|---|---|---|---|---|---|---|---|
| 15041 Lesure St | 0.10mi | 3/1.0 (-1) | 1,021 (-13%) | 2mo | $50,000 | $49 | 67 |
| 15053 Littlefield St | 0.21mi | 3/2.0 (-1) | 1,286 (+10%) | 2mo | $75,000 | $58 | 63 |
| 15775 Hartwell St | 0.52mi | 3/1.0 (-1) | 1,123 (-4%) | 3mo | $88,000 | $78 | 61 |
| 14644 Hubbell St | 0.48mi | 3/1.0 (-1) | 1,248 (+6%) | 2mo | $45,000 | $36 | 61 |
| 15824 Snowden St | 0.60mi | 3/1.0 (-1) | 1,127 (-4%) | 1mo | $61,000 | $54 | 60 |
| 15824 Snowden St | 0.60mi | 3/1.0 (-1) | 1,127 (-4%) | 1mo | $61,000 | $54 | 60 |
| 15770 Stansbury St | 0.53mi | 3/1.0 (-1) | 1,100 (-6%) | 1mo | $50,000 | $45 | 59 |
| 14974 Cheyenne St | 0.28mi | 3/2.5 (-1) | 1,300 (+11%) | 4mo | $155,000 | $119 | 55 |
| 14421 Marlowe St | 0.64mi | 4/1.0 | 1,060 (-10%) | 3mo | $66,000 | $62 | 52 |
| 15430 Mark Twain St | 0.47mi | 3/1.0 (-1) | 1,026 (-13%) | 1mo | $95,000 | $93 | 51 |
| 13991 Ardmore St | 0.75mi | 3/1.0 (-1) | 1,080 (-8%) | 2mo | $10,000 | $9 | 45 |
| 14931 Monte Vista St | 0.64mi | 3/1.5 (-1) | 1,307 (+11%) | 0mo | $35,000 | $27 | 44 |
Match score weights: distance 35% · size 25% · config 20% · recency 20%. Top-matched comps best support the ARV.
Projected returns pro-forma
-3.0% appreciation · 5.59% rent growth · sell at horizon
- IRR
- 18.8%
- Equity multiple
- 1.79×
- Total profit
- $18,101
- Equity at exit
- $12,212
- IRR
- 29.1%
- Equity multiple
- 3.95×
- Total profit
- $67,650
- Equity at exit
- $7,081
Cash invested: $22,932 (down + closing). Projections, not guarantees.
Landlord ↔ Tenant lean methodology
- Overall (STATE)
- 62 Landlord-Friendly
- State Michigan
- 62 Landlord-Friendly · EVEN
- County
- — inherits STATE
- City
- — inherits STATE
ZIP-level market 48227
- Rents YoY
- 5.6%
- Active inventory
- 392
- Price-to-rent
- 4.9×
Monthly cashflow live
- Estimated rent
- $1,387 high interval (Pro) →
- Mortgage (P&I)
- −$429
- Tax from tax record
- −$199 /mo · $2,385/yr
- Insurance
- −$34
- HOA
- −$0
- Vacancy / Maint / Mgmt
- −$291
- Net cashflow
- $433
Break-even live
Sensitivity live
| Price | -10% $479 | -5% $456 | +0% $433 | +5% $410 | +10% $387 |
|---|---|---|---|---|---|
| Rent | -10% $324 | -5% $378 | +0% $433 | +5% $488 | +10% $543 |
| Rate | -1.0pp $474 | -0.5pp $454 | base $433 | +0.5pp $412 | +1.0pp $390 |
UW: 25.0% down · 7.5% · 30yr · 1.5% tax · 5.0% vac · 8.0% maint · 8.0% mgmt
Financing live
Cash to close
- Down payment
- $20,475
- Closing costs
- $2,457
- Reserves months
- —
- Total cash needed
- —
Loan-product check · same deal, 3 products live
Conventional
25% down · 7.5% · 30yr
- Down + closing
- —
- Monthly P&I
- —
- Monthly cashflow
- —
- DSCR
- —
- Eligible?
- —
Personal DTI + credit; lowest rate.
DSCR
20% down · 8.5% · 30yr
- Down + closing
- —
- Monthly P&I
- —
- Monthly cashflow
- —
- DSCR
- —
- Eligible?
- —
No personal income docs; deal must DSCR.
Hard money
10% down · 12.0% · 12mo
- Down + closing
- —
- Monthly P&I
- —
- Monthly cashflow
- —
- DSCR
- —
- Eligible?
- —
Short-term bridge; refi at stabilization.
Rent comps 40 comps
| Address | Beds | Baths | Sqft | Rent | $/sqft | DOM | Units | Dist |
|---|---|---|---|---|---|---|---|---|
| 14903 Tracey St Detroit, MI | 3.0 | 1.0 | 1004 | $1,100 | $1.10 | 18d | 1 | 0.09mi |
| 14891 Hartwell St Detroit, MI | 3.0 | 1.0 | 1000 | $1,150 | $1.15 | 45d | 1 | 0.13mi |
| 15387 Lesure St Detroit, MI | 3.0 | 1.0 | 1064 | $1,350 | $1.27 | 14d | 1 | 0.25mi |
| 14847 Cheyenne St Detroit, MI | 3.0 | 2.0 | 849 | $1,150 | $1.35 | 19d | 1 | 0.30mi |
| 14590 Ardmore St Detroit, MI | 3.0 | 1.0 | 1200 | $1,195 | $1.00 | 4d | 1 | 0.34mi |
| 14600 Strathmoor St Detroit, MI | 4.0 | 1.0 | 1300 | $1,450 | $1.12 | 45d | 1 | 0.46mi |
| 14284 Cruse St Detroit, MI | 3.0 | 1.0 | 1121 | $1,150 | $1.03 | 18d | 1 | 0.54mi |
| 15762 Mark Twain St Detroit, MI | 3.0 | 2.0 | 1430 | $1,250 | $0.87 | 18d | 1 | 0.58mi |
| 15738 Sorrento Ave Detroit, MI | 3.0 | 1.0 | 762 | $1,175 | $1.54 | 45d | 1 | 0.59mi |
| 15341 Lauder St Detroit, MI | 4.0 | 1.5 | 1080 | $1,475 | $1.37 | 18d | 1 | 0.62mi |
| 15328 Coyle St Detroit, MI | 3.0 | 1.0 | 1000 | $1,450 | $1.45 | 19d | 1 | 0.71mi |
| 15330 Coyle St Unit 2 Detroit, MI | 3.0 | 1.0 | 1000 | $1,450 | $1.45 | 26d | 1 | 0.72mi |
| 15330 Coyle St Unit 1 Detroit, MI | 3.0 | 1.0 | 1000 | $1,425 | $1.43 | 14d | 1 | 0.72mi |
| 15330 Coyle St Unit 1 Detroit, MI | 3.0 | 1.0 | 1000 | $1,375 | $1.38 | 26d | 1 | 0.72mi |
| 14375 Terry St Detroit, MI | 3.0 | 2.0 | 1300 | $1,425 | $1.10 | 45d | 1 | 0.76mi |
| 14881 Mendota St Detroit, MI | 3.0 | 1.0 | 1026 | $1,100 | $1.07 | 26d | 1 | 0.76mi |
| 14814 Sussex St Unit 2 Detroit, MI | 3.0 | 1.0 | 1100 | $1,000 | $0.91 | 45d | 1 | 0.77mi |
| 15810 Robson St Detroit, MI | 3.0 | 1.0 | 1142 | $1,500 | $1.31 | 26d | 1 | 0.82mi |
| 16505 Stansbury St Detroit, MI | 3.0 | 1.0 | 1100 | $1,250 | $1.14 | 12d | 1 | 0.83mi |
| 16204 Steel St Detroit, MI | 3.0 | 1.0 | 969 | $1,150 | $1.19 | 45d | 1 | 0.87mi |
| 14893 Prest St Detroit, MI | 3.0 | 1.0 | 1100 | $1,000 | $0.91 | 16d | 1 | 0.92mi |
| 15708 Birwood St Detroit, MI | 3.0 | 1.0 | 1255 | $1,100 | $0.88 | 6d | 1 | 0.93mi |
| 16151 Robson St Detroit, MI | 3.0 | 1.0 | 1300 | $1,525 | $1.17 | 16d | 1 | 0.95mi |
| 14104 Coyle St Detroit, MI | 3.0 | 1.0 | 1327 | $1,350 | $1.02 | 6d | 1 | 0.99mi |
| 13331 Strathmoor St Detroit, MI | 3.0 | 1.0 | 1084 | $1,100 | $1.01 | 18d | 1 | 1.05mi |
| 13965 Mendota St Detroit, MI | 3.0 | 1.0 | 1222 | $1,294 | $1.06 | 19d | 1 | 1.07mi |
| 15375 Prevost St Detroit, MI | 4.0 | 1.0 | 907 | $1,300 | $1.43 | 18d | 1 | 1.21mi |
| 13279 Coyle St Detroit, MI | 3.0 | 1.0 | 1444 | $1,373 | $0.95 | 45d | 1 | 1.25mi |
| 16014 Hackett St Detroit, MI | 4.0 | 2.0 | 1142 | $1,500 | $1.31 | 45d | 1 | 1.25mi |
| 15752 Rutherford St Detroit, MI | 3.0 | 2.0 | 1174 | $1,386 | $1.18 | 6d | 1 | 1.30mi |
| 12754 Marlowe St Detroit, MI | 3.0 | 2.0 | 1008 | $1,400 | $1.39 | 18d | 1 | 1.31mi |
| Ohio St Unit 4 Detroit, MI | 4.0 | 1.5 | 1400 | $750 | $0.54 | 45d | 1 | 1.31mi |
| 15332 Saint Marys St Detroit, MI | 3.0 | 1.0 | 1200 | $1,200 | $1.00 | 18d | 1 | 1.34mi |
| 14570 Cherrylawn St Detroit, MI | 3.0 | 1.0 | 840 | $1,250 | $1.49 | 14d | 1 | 1.35mi |
| 14504 Saint Marys St Detroit, MI | 4.0 | 1.0 | 1362 | $1,473 | $1.08 | 45d | 1 | 1.37mi |
| 14242 Ohio St Detroit, MI | 4.0 | 1.0 | 1400 | $1,000 | $0.71 | 45d | 1 | 1.38mi |
| 15866 Mansfield St Detroit, MI | 3.0 | 1.0 | 1324 | $1,425 | $1.08 | 26d | 1 | 1.40mi |
| 16183 Wisconsin St Detroit, MI | 3.0 | 1.5 | 1370 | $1,400 | $1.02 | 45d | 1 | 1.40mi |
| 14550 Northlawn St Detroit, MI | 3.0 | 2.0 | 950 | $1,200 | $1.26 | 18d | 1 | 1.41mi |
| 13620 Kentucky St Detroit, MI | 3.0 | 1.0 | 1248 | $1,200 | $0.96 | 6d | 1 | 1.41mi |
Listing history 45 events
-
2026-06-21days on market $81,900 Active 18 DOM
-
2026-06-18days on market $81,900 Active 15 DOM
-
2026-06-17days on market $81,900 Active 14 DOM
-
2026-06-16days on market $81,900 Active 13 DOM
-
2026-06-15days on market $81,900 Active 12 DOM
-
2026-06-13days on market $81,900 Active 10 DOM
-
2026-06-13days on market $81,900 Active 9 DOM
-
2026-06-09days on market $81,900 Active 6 DOM
-
2026-06-08days on market $81,900 Active 5 DOM
-
2026-06-07days on market $81,900 Active 4 DOM
-
2026-06-04days on market $81,900 Active 1 DOM
-
2026-06-01days on market $81,900 Active 173 DOM
-
2026-05-31days on market $81,900 Active 172 DOM
-
2026-03-21price $81,900 356-char remark
-
2026-03-21price $81,900 356-char remark
-
2026-02-21status Active 356-char remark
-
2026-02-21historical 356-char remark
-
2025-12-10$82,900 Active 356-char remark
-
2025-12-10$82,900 Active 356-char remark
-
2018-03-26soldstatus $200,000
-
2017-08-03historical
-
2017-08-03historical
-
2017-07-08price $10,800
-
2017-07-07price $10,800
-
2017-07-07status Active
-
2017-07-07historical
-
2017-03-03$24,000 Active
-
2017-03-02$24,000 Active
-
2016-02-19historical
-
2016-02-19historical
-
2016-02-14status Pending
-
2016-02-08historical
-
2016-01-06status Pending
-
2015-10-20historical
-
2015-07-23$22,000 Active
-
2015-07-23$22,000
-
2015-03-17historical
-
2015-03-17soldstatus $15,000 Sold
-
2015-03-17soldstatus $15,000
-
2015-03-16historical
-
2015-01-14price $15,000
-
2014-10-30$20,000 Active
-
2014-10-30$15,000
-
2007-01-27historical
-
2006-03-28$84,900
ⓘ Source: listings_history table (triggers on properties + properties_extension) + one-shot
backfill from property_details.listing_events for pre-trigger history.
Tax reassessment forecast MI · Partial reset (capped growth)
- Current annual tax
- $2,385 · $199/mo
- Projected year-2 tax
- $2,385 · $199/mo
- Expected delta
- $0/yr ($0/mo · 0.0%)
ⓘ Screening estimate from a state-policy table — verify with the county assessor before closing.
Climate risk First Street
- Flood 1/10 Low FEMA zone X (unshaded) · 0% chance over 30 yrs
- Wildfire 1/10 Low
- Heat 3/10 Moderate 7 d/yr ≥97°F today · 15 d/yr by 30 yrs out
- Wind 2/10 Low
- Air quality 3/10 Moderate 2 unhealthy d/yr today · 5 by 30 yrs out
Nearby sold comps map
Loading sold comps map…
Walkable amenities ~0.75 mi
Loading nearby amenities…
Taxation est. · year 1
- Rental income
- $16,640
- − Mortgage interest
- −$4,588
- − Property taxes
- −$2,385
- − Insurance
- −$410
- − Repairs & maintenance
- −$1,331
- − Management
- −$1,331
- − Depreciation
- −$2,383
- Taxable income
- $4,213
- Est. tax owed @ 24.0%
- −$1,011
- After-tax cash flow
- $4,186/yr
For passive investors: Depreciation is non-cash, so a rental often shows a tax loss while cash-flowing — sheltering income. Rental losses are passive: they offset passive income freely, and up to $25,000/yr can offset ordinary (W-2) income if you actively participate and your MAGI is under $100k (phasing out to $0 by $150k); unused losses carry forward. On sale, claimed depreciation is recaptured at up to 25%, and gains may owe capital-gains tax (a 1031 exchange can defer both). Figures are a year-1 estimate at your 24.0% rate — not tax advice; consult a CPA.
Schools (NCES district)
- District
- Detroit Public Schools Community District
- NCES district ID
- 2601103
- Math proficiency
- 10% ▼ -2.00%
- Reading proficiency
- 24% ▲ 6.00%
- Median HH income
- $25,815
- Composite
- 13.06/100
- National rank
- #9564
- State rank
- #499 of 540 in MI
Livability — Detroit
- Score
- 73/100
- State rank
- #218
- US rank
- #5427
Category grades
Schools grade is shown separately in the Schools card above.
Census & demographics
- Census place
- Detroit, MI
- County
- Wayne County · 1,562,939 people
- City population
- 572,865
- Metro
- Detroit-Warren-Dearborn, MI
- Population (ZIP)
- 40,302
- Household income
- $36,527
- Rent vs Own
- Severe rent burden
- 2371.0
Population outlook (Wayne County) Hauer SSP2
- Today (2025)
- 1,675,273 people
- By 2030
- 1,620,300 · -3.3%
- By 2040
- 1,502,341 · -10.3%
- By 2050
- 1,384,039 · -17.4%
- By 2075
- 1,124,592 · -32.9%
- By 2100
- 881,193 · -47.4%
Race, ethnicity, and origin ACS 2023
- Neighborhood character
- Predominantly Black (95%)
- Race & ethnicity
- Black 95% Two or more races 3% White 1%
- Foreign-born
- 1%
- Languages at home
- 98% English-only · Spanish 1% French/Haitian/Cajun 1%
Political lean MEDSL · Wayne
- 2024 margin
- Strong D (+29.0) · D 62.7% · R 33.7% · Other 3.6%
- 2008→2024 swing
- -20.5pp toward R · 2008: 49.5pp · 2024: 29.0pp
- All cycles
- 2024: D+29.0 2020: D+38.1 2016: D+37.3 2012: D+46.9 2008: D+49.5
Not yet ingested
- Civics
- —
Market trends
- HPI YoY
- ▼ -125.00%
- Current HPI
- 186.4158
- Rent YoY
- ▲ 5.59%
- Metro
- Detroit-Warren-Dearborn, MI
- State GDP YoY
- ▲ 1.37%
- F500 in state
- 28
Industry mix (Fortune 500 HQ in MI)
| Industry | F500 HQs | Revenue |
|---|---|---|
| Automotive Parts | 3 | $48B |
|
||
| Automotive | 2 | $372B |
|
||
| Chemicals | 1 | $45B |
|
||
| Automotive Retail | 1 | $29B |
|
||
| Healthcare / Medical Devices | 1 | $23B |
|
||
| Automotive Technology | 1 | $20B |
|
||
Price history
-3.5% since first listed36 events — show timeline
- 2026-06-03 Listed $81,900 REALCOMP
- 2026-06-03 Listing Removed — MiRealSource-MiMLS
- 2026-06-03 Listing Removed — REALCOMP
- 2026-06-03 Listed $81,900 MiRealSource-MiMLS
- 2026-03-21 Price Changed $81,900 MiRealSource-MiMLS
- 2026-03-21 Price Changed $81,900 REALCOMP
- 2026-02-21 Relisted — REALCOMP
- 2026-02-21 Listing Removed — REALCOMP
- 2025-12-10 Listed $82,900 REALCOMP
- 2025-12-10 Listed $82,900 MiRealSource-MiMLS
- 2018-03-26 Sold (Public Records) $200,000 Public Records
- 2017-08-03 Listing Removed — REALCOMP
- 2017-08-03 Listing Removed — MiRealSource-MiMLS
- 2017-07-08 Price Changed $10,800 MiRealSource-MiMLS
- 2017-07-07 Price Changed $10,800 REALCOMP
- 2017-07-07 Relisted — MiRealSource-MiMLS
- 2017-07-07 Listing Removed — MiRealSource-MiMLS
- 2017-03-03 Listed $24,000 MiRealSource-MiMLS
- 2017-03-02 Listed $24,000 REALCOMP
- 2016-02-19 Listing Removed — REALCOMP
- 2016-02-19 Listing Removed — MiRealSource-MiMLS
- 2016-02-14 Pending — REALCOMP
- 2016-02-08 Listing Removed — REALCOMP
- 2016-01-06 Pending — REALCOMP
- 2015-10-20 Listing Removed — REALCOMP
- 2015-07-23 Listed $22,000 REALCOMP
- 2015-07-23 Listed $22,000 MiRealSource-MiMLS
- 2015-03-17 Listing Removed — REALCOMP
- 2015-03-17 Sold (MLS) $15,000 MiRealSource-MiMLS
- 2015-03-17 Sold (MLS) $15,000 REALCOMP
- 2015-03-16 Listing Removed — MiRealSource-MiMLS
- 2015-01-14 Price Changed $15,000 REALCOMP
- 2014-10-30 Listed $15,000 MiRealSource-MiMLS
- 2014-10-30 Listed $20,000 REALCOMP
- 2007-01-27 Listing Removed — REALCOMP
- 2006-03-28 Listed $84,900 REALCOMP
Property tax history
+8.3%/yrLatest (2025): $2,385 · +0.9% YoY. Source: county tax records.
Cash-flow waterfall
monthlySold comps — $/sqft
last 12 mo · ≤1 miLoading sold comps…