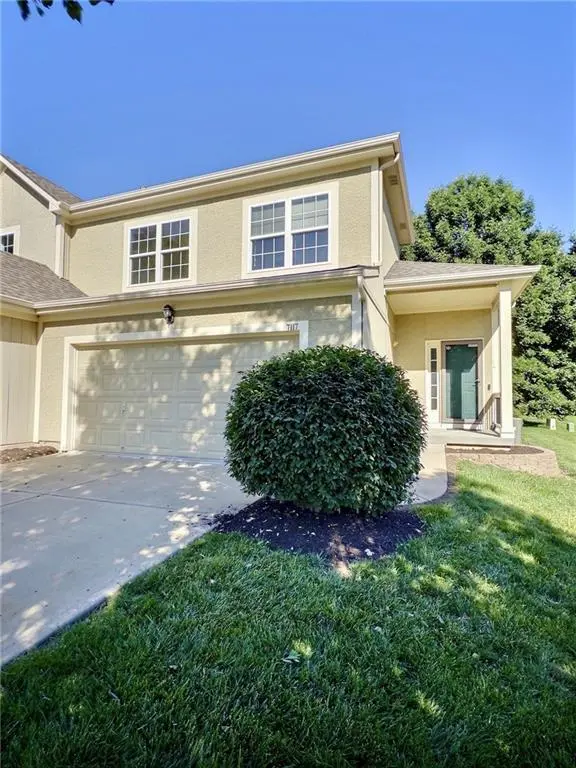
7117 Mccoy St · Shawnee, KS
Flood risk 1/10 · Minimal
- FEMA flood zone
- X (unshaded)
- Chance of flooding over 30 yrs
- 0.0%
- Est. flood insurance / yr
- $473 – $860
Fire risk 3/10 · Minor
- Est. fire insurance / yr
- $1,154 – $2,142
Heat risk 4/10 · Minor
- Hot days now (above 107°F)
- 7 days/yr
- Hot days in 30 yrs
- 17 days/yr
Wind risk 2/10 · Minimal
- Chance of severe wind over 30 yrs
- —
Air-quality risk 2/10 · Minimal
- Unhealthy air days now
- 2 days/yr
- Unhealthy air days in 30 yrs
- 2 days/yr
Risk factors via First Street. Map © Google.
Why this score? — see what drove the D- grade
The composite is a weighted blend of 9 inputs, each scored 0–100. Each bar is that input's sub-score; the figure is the points it added to the 100-point composite (weight × sub-score).
- Cash flow +11.5/30.0
- Schools +4.8/10.0
- Livability +4.4/5.0
- 1% rule +3.4/10.0
- DSCR +3.4/10.0
- ARV discount +3.4/15.0
- Rent growth +2.5/5.0
- Condition / age +2.5/5.0
- Appreciation +0.0/10.0
$325,000
🖨 Deal sheet 📄 Offer letter ✓ Due diligence
Listing remarks MLS
Well kept, townhome in a great location. Vaulted ceilings, full basement, backs up to green space. Easy for commute, jump on to K7 or 435 within just a couple minutes of your driveway!!
Key facts
- $80 HOA
- 2 garage spots
- Built 2005
Property features AI
Finance
- HOA & community: Willow Ridge HOA; Play area and trails; HOA provides lawn service, snow removal, curbside recycling and trash
Exterior
- Parking: Attached front-facing garage; 2-car garage
- Utilities: Public water; Public sewer
- Home design: Attached townhouse; 2-story; Public records for finished area
- Construction: Frame construction; Composition roof; Full basement with inside entrance
- Exterior features: Patio; Wood fencing; City lot; Cul-de-sac location; Not in a flood plain
Interior
- Kitchen: Dishwasher; Disposal; Microwave; Electric range; Kitchen/dining combo
- Bedrooms: 3 bedrooms
- Flooring: Carpet; Luxury vinyl; Tile
- Bathrooms: 2 full bathrooms; 1 half bathroom
- Heating & cooling: Natural gas heating; Electric cooling
- Interior features: Ceiling fans; Stained cabinets; Vaulted ceilings; Walk-in closets; Window coverings
- Laundry & utility: Main-level laundry room
Neighborhood map
What this means for you Summary
Snapshot
- This is a 3-bed/2.5-bath townhouse listed at $325k.
Deal economics
- At list price, monthly cash flow is $-106 ($-1k/yr) — negative.
- To cash-flow at today's rent, offer at most $306k (5.7% below list).
- To meet the 1% rule (rent ≥ 1% of price), the offer needs to be $273k (15.9% below list).
- Recommended offer: $273k (15.9% below list) — sets the bar for 1% rule.
- Cap rate 5.9% vs local median 3.2% in Shawnee — top-decile yield for the area; either an underpriced asset or a hidden risk that comps aren't pricing in. Stress-test before assuming the spread holds.
Location & tenants
- Location reads 87/100 on livability (#2 in KS, #276 nationally) — a professional / high-income tenant draw. Strengths: commute A+, employment A+, housing A+.
- De Soto (suburban): math 49% / reading 53% proficiency, ranked #3 of 169 in KS (top 2%) — acceptable for families but not a draw, mixed tenant base, ~2y average lease; only 10% free/reduced lunch — higher-income household profile.
- Zoned schools: Horizon Elementary (math 62% / reading 72%, grade B+, #31 of 684 statewide, top 6%, 372 students, 13% FRL); Mill Valley High School (math 41% / reading 40%, grade F, #19 of 327 statewide, top 6%, 1,355 students, 7% FRL) — zoned schools at 10% FRL track the district average.
- Market conditions: 103 active listings in the ZIP; 2 comparable units currently listed for rent nearby; high-income renter base; 2,969 units permitted in Johnson County in 2024 (1,066 in 5+ unit buildings).
Forward outlook
- Local home prices are declining (-3.0%/yr); year-one equity from $2k of loan paydown is wiped out by about $10k of value loss. Plan a longer hold.
- Johnson County population projected at +27% by 2050 — long-run rental-demand tailwind backs the buy-and-hold thesis.
Negotiation context
- Only 2 days on market — expect competitive offers; lowballing is unlikely to land.
- 3 sale attempts since 22y ago with the ask held roughly flat each time — persistent listings suggest the price (not the market) is what's stuck; bring a comps-based counter.
Questions for the listing agent
- What do current leases actually rent for vs. the listed asking? Can we see a recent rent roll and the last 12 months of T-12 income?
- What does the HOA fee cover, when was the last increase, and are there any pending special assessments or reserve-fund shortfalls?
- Is there a deadline driving the sale (1031 exchange, divorce, estate, relocation)? That informs how much negotiation room exists.
- Schools are B-rated — typically a magnet for longer-tenancy family renters. What's the average tenant stay here, and is there a school-zone premium baked into asking?
- The area grade is low — what's the realistic commute time and amenity access for the typical tenant pool here? Any planned neighborhood developments (good or bad) we should know about?
- What's the average days-on-market for RENTAL listings here right now (not sales)? A rising rental-DOM trend means longer vacancies and softer asking-rent achievability than the comps imply.
- What's the recent tenant-quality profile in this submarket — average credit score on applications, eviction rate, late-payment / NSF rate, and stable-employment percentage? A property-management company in the area should have these aggregated.
- How much new for-sale + rental construction is in the pipeline within 1–3 miles? Heavy new supply typically softens prices + rents 12–24 months out; constrained supply supports both.
Investment metrics
- 1% rule
- 0.84% ✗
- Cap rate
- 5.90%
- Cash-on-cash
- -1.39%
- DSCR
- 0.94
- GRM
- 9.9
CMA / ARV
- ARV (on-the-fly)
- $297,792
- Comps found
- 12
Show comp detail 12 sales within ~0.75 mi
| Address | Dist | Beds/Ba | Sqft | Sold | Price | $/sf | Match |
|---|---|---|---|---|---|---|---|
| 22608 W 73rd St | 0.23mi | 2/2.5 (-1) | 1,562 (+4%) | 12mo | $350,000 | $224 | 68 |
| 22802 W 72nd Ter | 0.17mi | 3/2.5 | 1,646 (+9%) | 11mo | $325,000 | $197 | 67 |
| 7355 Mccoy St | 0.34mi | 3/2.5 | 1,562 (+4%) | 18mo | $300,000 | $192 | 62 |
| 7342 Mccoy St | 0.34mi | 3/2.5 | 1,660 (+10%) | 6mo | $315,000 | $190 | 62 |
| 22526 W 72nd St | 0.11mi | 2/2.5 (-1) | 1,340 (-11%) | 13mo | $265,000 | $198 | 61 |
| 7512 Mccoy St | 0.51mi | 3/2.5 | 1,662 (+10%) | 7mo | $335,000 | $202 | 53 |
| 22402 W 76th St | 0.63mi | 3/2.5 | 1,655 (+10%) | 1mo | $399,000 | $241 | 53 |
| 7620 Mccoy St | 0.64mi | 3/2.0 | 1,607 (+7%) | 8mo | $315,000 | $196 | 50 |
| 7114 Meadow View St | 0.47mi | 2/2.0 (-1) | 1,606 (+7%) | 12mo | $365,000 | $227 | 50 |
| 7531 Anderson St | 0.56mi | 3/2.5 | 1,619 (+8%) | 14mo | $305,000 | $188 | 50 |
| 22708 W 73rd St | 0.24mi | 2/2.5 (-1) | 1,314 (-13%) | 19mo | $260,000 | $198 | 47 |
| 22415 W 76th Ter | 0.65mi | 3/2.0 | 1,566 (+4%) | 17mo | $315,000 | $201 | 47 |
Match score weights: distance 35% · size 25% · config 20% · recency 20%. Top-matched comps best support the ARV.
Projected returns pro-forma
-3.0% appreciation · 3.0% rent growth · sell at horizon
- IRR
- -18.6%
- Equity multiple
- 0.35×
- Total profit
- $-59,348
- Equity at exit
- $48,459
- IRR
- -10.9%
- Equity multiple
- 0.34×
- Total profit
- $-60,139
- Equity at exit
- $28,100
Cash invested: $91,000 (down + closing). Projections, not guarantees.
Landlord ↔ Tenant lean methodology
- Overall (STATE)
- 83 Strongly Landlord-Friendly
- State Kansas
- 83 Strongly Landlord-Friendly · R+10
- County
- — inherits STATE
- City
- — inherits STATE
ZIP-level market 66227
- Home prices YoY
- -25.7%
- Active inventory
- 103
- Price-to-rent
- 9.9×
Monthly cashflow live
- Estimated rent
- $2,733 medium interval (Pro) →
- Mortgage (P&I)
- −$1,704
- Tax from tax record
- −$345 /mo · $4,141/yr
- Insurance
- −$135
- HOA
- −$80
- Vacancy / Maint / Mgmt
- −$574
- Net cashflow
- $-106
Break-even live
UW: 25.0% down · 7.5% · 30yr · 1.5% tax · 5.0% vac · 8.0% maint · 8.0% mgmt
Financing live
Cash to close
- Down payment
- $81,250
- Closing costs
- $9,750
- Reserves months
- —
- Total cash needed
- —
Loan-product check · same deal, 3 products live
Conventional
25% down · 7.5% · 30yr
- Down + closing
- —
- Monthly P&I
- —
- Monthly cashflow
- —
- DSCR
- —
- Eligible?
- —
Personal DTI + credit; lowest rate.
DSCR
20% down · 8.5% · 30yr
- Down + closing
- —
- Monthly P&I
- —
- Monthly cashflow
- —
- DSCR
- —
- Eligible?
- —
No personal income docs; deal must DSCR.
Hard money
10% down · 12.0% · 12mo
- Down + closing
- —
- Monthly P&I
- —
- Monthly cashflow
- —
- DSCR
- —
- Eligible?
- —
Short-term bridge; refi at stabilization.
Rent comps 2 comps
| Address | Beds | Baths | Sqft | Rent | $/sqft | DOM | Units | Dist |
|---|---|---|---|---|---|---|---|---|
| 22907 W 72nd Ter Shawnee, KS | 4.0 | 4.0 | 2200 | $2,695 | $1.23 | 24d | 1 | 0.24mi |
| 6522 Noble St Shawnee, KS | 3.0–4.0 | 2.5 | 1689 | $2,200 | $1.30 | 2d | 1 | 0.99mi |
HOA detail
- Monthly dues
- $80 · $960/yr
Listing history 9 events
-
2026-05-31status $325,000 Pending 2 DOM
-
2026-05-29$325,000 Active
-
2026-05-27historical $325,000
-
2015-11-30soldstatus
-
2015-11-25soldstatus 185-char remark
Show marketing remark (185 chars)
Well kept, townhome in a great location. Vaulted ceilings, full basement, backs up to green space. Easy for commute, jump on to K7 or 435 within just a couple minutes of your driveway!!
-
2015-10-20$169,900 185-char remark
Show marketing remark (185 chars)
Well kept, townhome in a great location. Vaulted ceilings, full basement, backs up to green space. Easy for commute, jump on to K7 or 435 within just a couple minutes of your driveway!!
-
2013-10-21soldstatus
-
2005-06-30soldstatus 288-char remark
Show marketing remark (288 chars)
All units have Magnificent Cabinetry w/ hidden hinges, full basements, Stucco Fronts, Tile Entry, Acrylic Exterior Paint, 30yr Comp Roof. No where else in JOCO at this price!! Models open daily Mon-Sat 11-5 and Sun 12-5. www. willowridgetownhomes. com Subdivision information 913-441-8400
-
2004-09-01$179,900 288-char remark
Show marketing remark (288 chars)
All units have Magnificent Cabinetry w/ hidden hinges, full basements, Stucco Fronts, Tile Entry, Acrylic Exterior Paint, 30yr Comp Roof. No where else in JOCO at this price!! Models open daily Mon-Sat 11-5 and Sun 12-5. www. willowridgetownhomes. com Subdivision information 913-441-8400
ⓘ Source: listings_history table (triggers on properties + properties_extension) + one-shot
backfill from property_details.listing_events for pre-trigger history.
Tax reassessment forecast KS · Resets to sale price
- Current annual tax
- $4,141 · $345/mo
- Projected year-2 tax
- $4,582 · $382/mo
- Expected delta
- +$442/yr (+$37/mo · 10.7%)
ⓘ Screening estimate from a state-policy table — verify with the county assessor before closing.
Climate risk First Street
- Flood 1/10 Low FEMA zone X (unshaded) · 0% chance over 30 yrs
- Wildfire 3/10 Moderate
- Heat 4/10 Moderate 7 d/yr ≥107°F today · 17 d/yr by 30 yrs out
- Wind 2/10 Low
- Air quality 2/10 Low 2 unhealthy d/yr today · 2 by 30 yrs out
Nearby sold comps map
Loading sold comps map…
Walkable amenities ~0.75 mi
Loading nearby amenities…
Taxation est. · year 1
- Rental income
- $32,795
- − Mortgage interest
- −$18,205
- − Property taxes
- −$4,141
- − Insurance
- −$1,625
- − Repairs & maintenance
- −$2,624
- − Management
- −$2,624
- − HOA
- −$960
- − Depreciation
- −$9,455
- Taxable loss
- −$6,837
- Est. tax savings @ 24.0%
- +$1,641
- After-tax cash flow
- $372/yr
For passive investors: Depreciation is non-cash, so a rental often shows a tax loss while cash-flowing — sheltering income. Rental losses are passive: they offset passive income freely, and up to $25,000/yr can offset ordinary (W-2) income if you actively participate and your MAGI is under $100k (phasing out to $0 by $150k); unused losses carry forward. On sale, claimed depreciation is recaptured at up to 25%, and gains may owe capital-gains tax (a 1031 exchange can defer both). Figures are a year-1 estimate at your 24.0% rate — not tax advice; consult a CPA.
Schools (NCES district)
- District
- De Soto
- NCES district ID
- 2005490
- Math proficiency
- 49% ▼ -1.00%
- Reading proficiency
- 53% ▼ -1.00%
- Median HH income
- $96,361
- Composite
- 48.04/100
- National rank
- #2192
- State rank
- #3 of 169 in KS
Livability — Shawnee
- Score
- 87/100
- State rank
- #2
- US rank
- #276
Category grades
Schools grade is shown separately in the Schools card above.
Census & demographics
- Census place
- Shawnee, KS
- County
- Johnson County · 574,662 people
- City population
- 60,541
- Metro
- Kansas City, MO-KS
- Population (ZIP)
- 9,595
- Household income
- $139,883
- Rent vs Own
- Severe rent burden
- 14.0
Population outlook (Johnson County) Hauer SSP2
- Today (2025)
- 663,396 people
- By 2030
- 702,585 · +5.9%
- By 2040
- 775,386 · +16.9%
- By 2050
- 841,772 · +26.9%
- By 2075
- 994,137 · +49.9%
- By 2100
- 1,073,036 · +61.7%
Race, ethnicity, and origin ACS 2023
- Neighborhood character
- Predominantly White (85%)
- Race & ethnicity
- White 85% Two or more races 6% Black 5% Hispanic / Latino 4% Asian 2%
- Common ancestry
- Romanian 4% English 4% Italian 3%
- Foreign-born
- 4% · Canada, China
- Languages at home
- 94% English-only · Spanish 4% German/W. Germanic 1% Tagalog/Filipino 1%
Political lean MEDSL · Johnson
- 2024 margin
- Lean D (+8.5) · D 53.4% · R 44.9% · Other 1.8%
- 2008→2024 swing
- +17.5pp toward D · 2008: -9.0pp · 2024: 8.5pp
- All cycles
- 2024: D+8.5 2020: D+8.2 2016: R+2.7 2012: R+17.8 2008: R+9.0
Not yet ingested
- Civics
- —
Market trends
- HPI YoY
- ▼ -87.02%
- Current HPI
- 251.8801
- Rent YoY
- —
- Metro
- Kansas City, MO-KS
- State GDP YoY
- —
- F500 in state
- 0
Price history
+80.7% since first listed8 events — show timeline
- 2026-05-29 Listed $325,000 Heartland MLS as Distributed by MLS Grid
- 2026-05-27 Coming Soon $325,000 Heartland MLS as Distributed by MLS Grid
- 2015-11-30 Sold (Public Records) — Public Records
- 2015-11-25 Sold (MLS) — Heartland MLS as Distributed by MLS Grid
- 2015-10-20 Listed $169,900 Heartland MLS as Distributed by MLS Grid
- 2013-10-21 Sold (Public Records) — Public Records
- 2005-06-30 Sold (MLS) — Heartland MLS as Distributed by MLS Grid
- 2004-09-01 Listed $179,900 Heartland MLS as Distributed by MLS Grid
Property tax history
+4.7%/yrLatest (2025): $4,141 · +14.3% YoY. Source: county tax records.
Cash-flow waterfall
monthlySold comps — $/sqft
last 12 mo · ≤1 miLoading sold comps…