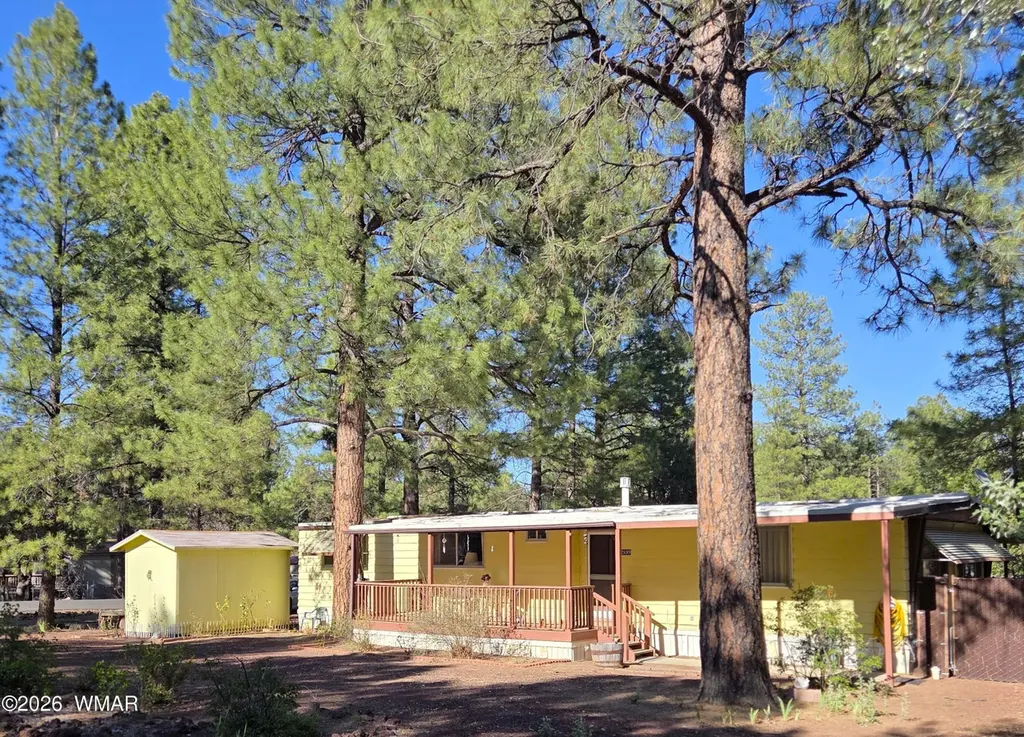
2899 W Whipple St · Show Low, AZ
Flood risk 1/10 · Minimal
- FEMA flood zone
- X (unshaded)
- Chance of flooding over 30 yrs
- 0.0%
- Est. flood insurance / yr
- $507 – $1,088
Fire risk 6/10 · Moderate
- Est. fire insurance / yr
- $610 – $1,132
Heat risk 2/10 · Minimal
- Hot days now (above 89°F)
- 7 days/yr
- Hot days in 30 yrs
- 18 days/yr
Wind risk 1/10 · Minimal
- Chance of severe wind over 30 yrs
- —
Air-quality risk 1/10 · Minimal
- Unhealthy air days now
- 0 days/yr
- Unhealthy air days in 30 yrs
- 0 days/yr
Risk factors via First Street. Map © Google.
Why this score? — see what drove the B+ grade
The composite is a weighted blend of 9 inputs, each scored 0–100. Each bar is that input's sub-score; the figure is the points it added to the 100-point composite (weight × sub-score).
- Cash flow +30.0/30.0
- ARV discount +15.0/15.0
- 1% rule +10.0/10.0
- DSCR +10.0/10.0
- Livability +3.2/5.0
- Schools +3.0/10.0
- Rent growth +2.5/5.0
- Condition / age +2.5/5.0
- Appreciation +0.0/10.0
$169,900
🖨 Deal sheet (PDF) 📄 Offer letter ✓ Due diligence
Listing remarks
Come take a look at this 2 bdrm 2 bath beauty tucked in the tall pines of the heart of Show Low. The peaceful serenity and cozy back yard patio atmosphere is for enjoyment of all those mountain mornings. The home is AS-IS and comes fully furnished so it is totally move in ready. Has 2 sheds with all you need to take care of home, yard and gardening. With all outdoor activities to have fun from the many lakes, hunting, skiing or just exploring the forest. Close to all amenities for schools, stores and restaurants. Call for details.
Key facts
- Back yard patio
- 2 sheds
- Close to amenities
Tags
Property features AI
Finance
- Other: Zoned residential; Road maintenance by city; Approximately 0.20 acre lot; Not on leased land; Subdivision: Park Valley
- HOA & community: No HOA
Exterior
- Parking: Attached carport (1 space)
- Utilities: City water (metered by City of Show Low); Public sewer; Electric service with individual meter; Natural gas available; Cable TV available; Navopache service available; Water, sewer and power available
- Home design: Manufactured/Mobile home (double wide); Residential property; Property adjoins private land; Trees on property
- Construction: Metal roof
- Exterior features: Deck; Covered deck; Covered patio; Located among tall pines/in the trees; Landscaped yard; Partly fenced with chain link fence; Other building and utility building on lot; Paved street
Interior
- Kitchen: Built-in dishwasher; Disposal; Electric range; Microwave; Pantry; Refrigerator
- Flooring: Carpet; Laminate; Tile
- Bathrooms: Full bath with shower and tub/shower; Jack-and-Jill layout; Dressing area
- Heating & cooling: Natural gas heating; Gas water heater (over 30 gallons); Portable cooler for cooling
- Interior features: Smoke detector; Furnished; Gas fireplace in living room; Regency fireplace; Carpet, laminate and tile flooring
- Laundry & utility: Washer and dryer; Laundry located in hallway/utility room
Neighborhood map
What this means for you Summary
Snapshot
- This is a 2-bed/2.0-bath manufactured listed at $170k.
Deal economics
- At list price, monthly cash flow is $2k ($19k/yr) — positive.
- The deal already cash-flows at list — no discount required.
- Meets the 1% rule at list price ($3k rent vs $170k).
- Cap rate 17.6% vs local median 3.3% in Show Low — top-decile yield for the area; either an underpriced asset or a hidden risk that comps aren't pricing in. Stress-test before assuming the spread holds.
Location & tenants
- Location reads 65/100 on livability (#90 in AZ) — a middle-class / working-renter tenant base. Strengths: cost of living A+, housing A+; Watch: employment D, crime F, amenities F.
- Show Low Unified District (4393) (rural): math 32% / reading 39% proficiency, ranked #89 of 249 in AZ (top 36%) — families likely to look elsewhere, expect single-tenant / working-renter base with shorter leases.
- Zoned schools: Nikolaus Homestead Elementary School (math 40% / reading 44%, grade F, #371 of 1,109 statewide, top 34%, 389 students, 42% FRL); Show Low Junior High School (math 29% / reading 34%, grade F, #78 of 218 statewide, top 36%, 587 students, 45% FRL); Show Low High School (math 22% / reading 37%, grade F, #120 of 381 statewide, top 34%, 877 students, 31% FRL).
- Market conditions: 895 active listings in the ZIP; 3 comparable units currently listed for rent nearby; rentals at typical pace (median 15d on market — plan ~3-4 weeks tenant-placement turnaround); 485 units permitted in Navajo County in 2024 (11 in 5+ unit buildings).
Forward outlook
- Local home prices are declining (-3.0%/yr); year-one equity from $1k of loan paydown is wiped out by about $5k of value loss. Plan a longer hold.
- Navajo County population projected at -16% by 2050 — secular population decline; favor cash flow + early exit over multi-decade hold.
- At projected returns (-3.0% appreciation + 3.0% rent growth), your $48k cash investment doubles in ~3 years — after that, you're playing with house money.
Negotiation context
- Only 14 days on market — expect competitive offers; lowballing is unlikely to land.
Risks & watch-outs
- Climate carrying-cost: major wildfire risk — expect insurance premiums to compound above CPI over the hold.
Questions for the listing agent
- Built in 1973 — when were the roof, HVAC, electrical panel, plumbing, and water heater last replaced?
- Is there a deadline driving the sale (1031 exchange, divorce, estate, relocation)? That informs how much negotiation room exists.
- Schools are B-rated — typically a magnet for longer-tenancy family renters. What's the average tenant stay here, and is there a school-zone premium baked into asking?
- Crime grade is F in this area — have there been break-ins, vandalism, or insurance claims at this property in the last 3 years? What carrier currently insures it and at what premium?
- What's the average days-on-market for RENTAL listings here right now (not sales)? A rising rental-DOM trend means longer vacancies and softer asking-rent achievability than the comps imply.
- What's the recent tenant-quality profile in this submarket — average credit score on applications, eviction rate, late-payment / NSF rate, and stable-employment percentage? A property-management company in the area should have these aggregated.
- How much new for-sale + rental construction is in the pipeline within 1–3 miles? Heavy new supply typically softens prices + rents 12–24 months out; constrained supply supports both.
Investment metrics
- 1% rule
- 1.94% ✓
- Cap rate
- 17.65%
- Cash-on-cash
- 40.56%
- DSCR
- 2.80
- GRM
- 4.3
CMA / ARV
- ARV (median comp)
- $313,103
- List price
- $169,900
- Delta
- -45.74%
- Verdict
- UNDERPRICED
- Comps
- 20 within 1.0 mi
Show comp detail 12 sales within ~0.75 mi
| Address | Dist | Beds/Ba | Sqft | Sold | Price | $/sf | Match |
|---|---|---|---|---|---|---|---|
| 2899 W Whipple St | 0.00mi | 2/2.0 | 1,440 (0%) | 0mo | $155,000 | $108 | 100 |
| 3030 W Young -- | 0.12mi | 3/2.0 (+1) | 1,345 (-7%) | 4mo | $325,000 | $242 | 75 |
| 640 S 27th Ave | 0.13mi | 3/2.0 (+1) | 1,345 (-7%) | 4mo | $273,000 | $203 | 75 |
| 3051 W Young | 0.15mi | 2/2.0 | 1,344 (-7%) | 9mo | $295,900 | $220 | 74 |
| 590 S 26th Dr | 0.17mi | 3/2.0 (+1) | 1,456 (+1%) | 15mo | $292,000 | $201 | 73 |
| 2820 W Reidhead | 0.20mi | 3/2.0 (+1) | 1,350 (-6%) | 10mo | $320,000 | $237 | 68 |
| 1061 S Hacienda Pines Dr | 0.43mi | 2/2.0 | 1,500 (+4%) | 9mo | $395,000 | $263 | 66 |
| 2380 W Zuni Ct | 0.34mi | 3/2.0 (+1) | 1,482 (+3%) | 13mo | $369,750 | $249 | 64 |
| 1100 S Fox Ln | 0.58mi | 2/2.0 | 1,456 (+1%) | 13mo | $410,000 | $282 | 60 |
| 3198 W Young -- | 0.22mi | 3/2.0 (+1) | 1,620 (+12%) | 8mo | $325,000 | $201 | 57 |
| 1161 S Cherokee Dr | 0.43mi | 2/2.0 | 1,248 (-13%) | 9mo | $324,900 | $260 | 50 |
| 2120 W Stratton | 0.44mi | 3/2.0 (+1) | 1,279 (-11%) | 11mo | $250,000 | $195 | 46 |
Match score weights: distance 35% · size 25% · config 20% · recency 20%. Top-matched comps best support the ARV.
Projected returns pro-forma
-3.0% appreciation · 3.0% rent growth · sell at horizon
- IRR
- 37.0%
- Equity multiple
- 2.57×
- Total profit
- $74,815
- Equity at exit
- $25,333
- IRR
- 43.6%
- Equity multiple
- 5.14×
- Total profit
- $196,771
- Equity at exit
- $14,690
Cash invested: $47,572 (down + closing). Projections, not guarantees.
Landlord ↔ Tenant lean methodology
- Overall (STATE)
- 87 Strongly Landlord-Friendly
- State Arizona
- 87 Strongly Landlord-Friendly · R+3
- County
- — inherits STATE
- City
- — inherits STATE
ZIP-level market 85901
- Home prices YoY
- -14.5%
- Active inventory
- 895
- Price-to-rent
- 4.3×
Monthly cashflow live
- Estimated rent
- $3,297 medium interval (Pro) →
- Mortgage (P&I)
- −$891
- Tax from tax record
- −$35 /mo · $422/yr
- Insurance
- −$71
- HOA
- −$0
- Vacancy / Maint / Mgmt
- −$692
- Net cashflow
- $1,608
Break-even live
Sensitivity live
| Price | -10% $1,704 | -5% $1,656 | +0% $1,608 | +5% $1,560 | +10% $1,512 |
|---|---|---|---|---|---|
| Rent | -10% $1,347 | -5% $1,478 | +0% $1,608 | +5% $1,738 | +10% $1,868 |
| Rate | -1.0pp $1,693 | -0.5pp $1,651 | base $1,608 | +0.5pp $1,564 | +1.0pp $1,519 |
UW: 25.0% down · 7.5% · 30yr · 1.5% tax · 5.0% vac · 8.0% maint · 8.0% mgmt
Financing live
Cash to close
- Down payment
- $42,475
- Closing costs
- $5,097
- Reserves months
- —
- Total cash needed
- —
Loan-product check · same deal, 3 products live
Conventional
25% down · 7.5% · 30yr
- Down + closing
- —
- Monthly P&I
- —
- Monthly cashflow
- —
- DSCR
- —
- Eligible?
- —
Personal DTI + credit; lowest rate.
DSCR
20% down · 8.5% · 30yr
- Down + closing
- —
- Monthly P&I
- —
- Monthly cashflow
- —
- DSCR
- —
- Eligible?
- —
No personal income docs; deal must DSCR.
Hard money
10% down · 12.0% · 12mo
- Down + closing
- —
- Monthly P&I
- —
- Monthly cashflow
- —
- DSCR
- —
- Eligible?
- —
Short-term bridge; refi at stabilization.
Rent comps 3 comps
| Address | Beds | Baths | Sqft | Rent | $/sqft | DOM | Units | Dist |
|---|---|---|---|---|---|---|---|---|
| 311 S 16th Ave Unit 1545774P Show Low, AZ | 3.0 | 2.0 | 1797 | $4,355 | $2.42 | 15d | 1 | 0.83mi |
| 2890 W Villa Loop Unit 1 Show Low, AZ | 3.0 | 2.0 | 1652 | $2,700 | $1.63 | 45d | 1 | 1.02mi |
| 2850 W Villa Loop Unit 1 Show Low, AZ | 3.0 | 2.0 | 1625 | $2,700 | $1.66 | 15d | 1 | 1.03mi |
Listing history 2 events
-
2026-05-15$169,900 Active 536-char remark
-
2005-11-22soldstatus $90,000
ⓘ Source: listings_history table (triggers on properties + properties_extension) + one-shot
backfill from property_details.listing_events for pre-trigger history.
Tax reassessment forecast AZ · Resets to sale price
- Current annual tax
- $422 · $35/mo
- Projected year-2 tax
- $1,121 · $93/mo
- Expected delta
- +$699/yr (+$58/mo · 165.5%)
ⓘ Screening estimate from a state-policy table — verify with the county assessor before closing.
Climate risk First Street
- Flood 1/10 Low FEMA zone X (unshaded) · 0% chance over 30 yrs
- Wildfire 6/10 Major
- Heat 2/10 Low 7 d/yr ≥89°F today · 18 d/yr by 30 yrs out
- Wind 1/10 Low
- Air quality 1/10 Low 0 unhealthy d/yr today · 0 by 30 yrs out
Nearby sold comps map
Loading sold comps map…
Walkable amenities ~0.75 mi
Loading nearby amenities…
Taxation est. · year 1
- Rental income
- $39,567
- − Mortgage interest
- −$9,517
- − Property taxes
- −$422
- − Insurance
- −$850
- − Repairs & maintenance
- −$3,165
- − Management
- −$3,165
- − Depreciation
- −$4,943
- Taxable income
- $17,505
- Est. tax owed @ 24.0%
- −$4,201
- After-tax cash flow
- $15,093/yr
For passive investors: Depreciation is non-cash, so a rental often shows a tax loss while cash-flowing — sheltering income. Rental losses are passive: they offset passive income freely, and up to $25,000/yr can offset ordinary (W-2) income if you actively participate and your MAGI is under $100k (phasing out to $0 by $150k); unused losses carry forward. On sale, claimed depreciation is recaptured at up to 25%, and gains may owe capital-gains tax (a 1031 exchange can defer both). Figures are a year-1 estimate at your 24.0% rate — not tax advice; consult a CPA.
Schools (NCES district)
- District
- Show Low Unified District (4393)
- NCES district ID
- 0407700
- Math proficiency
- 32% ▼ -9.00%
- Reading proficiency
- 39% ▼ -4.00%
- Median HH income
- $41,240
- Composite
- 29.9/100
- National rank
- #6387
- State rank
- #89 of 249 in AZ
Livability — Show Low
- Score
- 65/100
- State rank
- #90
- US rank
- #13573
Category grades
Schools grade is shown separately in the Schools card above.
Census & demographics
- Census place
- Show Low, AZ
- City population
- 18,821
- Population (ZIP)
- 18,821
Population outlook (Navajo County) Hauer SSP2
- Today (2025)
- 105,760 people
- By 2030
- 103,301 · -2.3%
- By 2040
- 97,070 · -8.2%
- By 2050
- 88,850 · -16.0%
- By 2075
- 65,180 · -38.4%
- By 2100
- 37,281 · -64.7%
Race, ethnicity, and origin ACS 2023
- Neighborhood character
- Predominantly White (77%)
- Race & ethnicity
- White 77% Hispanic / Latino 16% Two or more races 11% Native American 2%
- Hispanic origin (detail)
- Mexican 12%
- Common ancestry
- Slovak 2% Lithuanian 2% Italian 2%
- Foreign-born
- 4% · Canada
- Languages at home
- 92% English-only · Spanish 7% Tagalog/Filipino 1%
Political lean MEDSL · Navajo
- 2024 margin
- R (+17.2) · D 40.9% · R 58.1%
- 2008→2024 swing
- -5.5pp toward R · 2008: -11.7pp · 2024: -17.2pp
- All cycles
- 2024: R+17.2 2020: R+8.2 2016: R+7.9 2012: R+8.4 2008: R+11.7
Not yet ingested
- Civics
- —
Market trends
- HPI YoY
- ▼ -65.52%
- Current HPI
- 386.3007
- Rent YoY
- —
- Metro
- —
- State GDP YoY
- ▲ 4.54%
- F500 in state
- 20
Industry mix (Fortune 500 HQ in AZ)
| Industry | F500 HQs | Revenue |
|---|---|---|
| Technology | 2 | $13B |
|
||
| Mining / Metals | 1 | $23B |
|
||
| Environmental Services | 1 | $16B |
|
||
| Metals / Steel | 1 | $14B |
|
||
| Technology Distribution | 1 | $9B |
|
||
| Homebuilding | 1 | $8B |
|
||
Price history
+72.2% since first listed4 events — show timeline
- 2026-06-15 Sold (MLS) $155,000 WMMLS
- 2026-05-29 Pending — WMMLS
- 2026-05-15 Listed $169,900 WMMLS
- 2005-11-22 Sold (Public Records) $90,000 Public Records
Property tax history
+2.6%/yrLatest (2025): $422 · +4.3% YoY. Source: county tax records.
Cash-flow waterfall
monthlySold comps — $/sqft
last 12 mo · ≤1 miLoading sold comps…