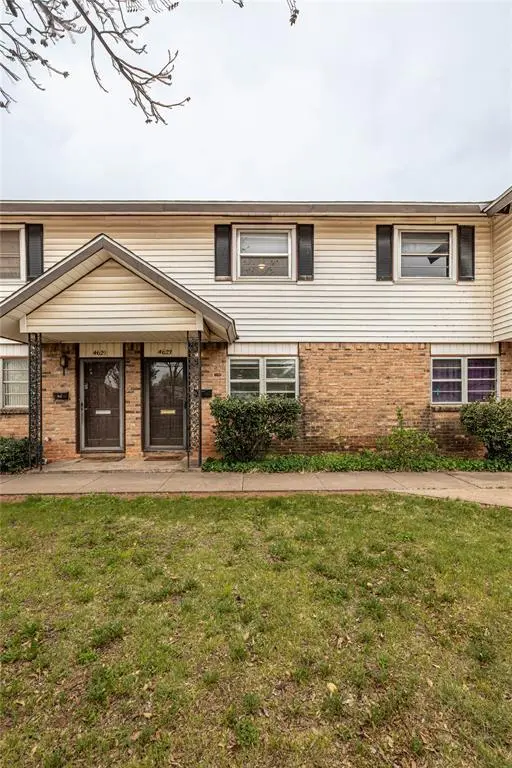
4623 N 2nd St · Abilene, TX
Flood risk 6/10 · Moderate
- FEMA flood zone
- X (shaded)
- Chance of flooding over 30 yrs
- 0.93%
- Est. flood insurance / yr
- $507 – $1,088
Fire risk 7/10 · Major
- Est. fire insurance / yr
- $1,222 – $2,270
Heat risk 7/10 · Major
- Hot days now (above 104°F)
- 7 days/yr
- Hot days in 30 yrs
- 23 days/yr
Wind risk 4/10 · Minor
- Chance of severe wind over 30 yrs
- 11.0%
Air-quality risk 1/10 · Minimal
- Unhealthy air days now
- 0 days/yr
- Unhealthy air days in 30 yrs
- 0 days/yr
Risk factors via First Street. Map © Google.
Why this score? — see what drove the C- grade
The composite is a weighted blend of 9 inputs, each scored 0–100. Each bar is that input's sub-score; the figure is the points it added to the 100-point composite (weight × sub-score).
- Cash flow +20.2/30.0
- ARV discount +7.5/15.0
- DSCR +6.4/10.0
- 1% rule +5.8/10.0
- Rent growth +5.0/5.0
- Livability +3.8/5.0
- Schools +2.8/10.0
- Condition / age +2.5/5.0
- Appreciation +0.0/10.0
$129,900
🖨 Deal sheet 📄 Offer letter ✓ Due diligence
Listing remarks MLS
Townhome with two bedrooms and full bath upstairs. Half bath located downstairs adjacent to kitchen. Two car garage with small storage, alley access. Tiled living room.
Key facts
- New carpet
- Tiled floors
- New lvt
Tags
Property features AI
Finance
- Other: Complex/Subdivision: Park Plaza Sec 1 / Augusta Realtors
- Financial info: Accepted financing: Cash, Conventional, FHA; Second mortgage: No; Loan type treated as clear
- HOA & community: Mandatory association managed by Augusta Realtors; Association fee $100 monthly; Association covers front yard maintenance
Exterior
- Parking: Covered parking (2 spaces); 2-car garage with single doors; Garage faces rear; Garage door opener; On-street parking available
- Security: No surveillance devices reported
- Utilities: City water; City sewer; Electricity connected
- Home design: Residential condominium; Two-story; Property is not attached
- Construction: Brick construction; Built in 1964
- Exterior features: Alley access; Community mailbox; Front yard maintenance included in association
Interior
- Kitchen: Electric range; Refrigerator; Electric water heater
- Bedrooms: Primary bedroom (upstairs); Second bedroom (upstairs)
- Flooring: Carpet; Ceramic tile; Luxury vinyl plank
- Bathrooms: One full bathroom; One half bathroom
- Heating & cooling: Central heat (electric); Central air (electric)
- Interior features: Walk-in closet(s); One living area; One dining area; Total room count: 3; Two levels
- Laundry & utility: Washer/dryer not specified (no dedicated laundry appliance listed)
Neighborhood map
What this means for you Summary
Snapshot
- This is a 1-bed/1.5-bath single-family listed at $130k.
Deal economics
- At list price, monthly cash flow is $164 ($2k/yr) — positive.
- The deal already cash-flows at list — no discount required.
- Meets the 1% rule at list price ($1k rent vs $130k).
- Recommended offer: $126k (3.0% below list) — sets the bar for market timing.
Location & tenants
- Location reads 75/100 on livability (#142 in TX, #4,037 nationally) — a middle-class / working-renter tenant base. Strengths: cost of living A+, housing A+, health & safety A+; Watch: schools D+, crime D, commute F.
- Abilene ISD (urban): math 32% / reading 34% proficiency, ranked #575 of 826 in TX (top 70%) — families likely to look elsewhere, expect single-tenant / working-renter base with shorter leases.
- Market conditions: Rents rising fast (+40.2%/yr); 86 active listings in the ZIP; 2 comparable units currently listed for rent nearby; 508 units permitted in Taylor County in 2024 (0 in 5+ unit buildings).
- This rent runs 31% of the median local income ($54k/yr) — at the standard rent-burdened threshold; future hikes will face affordability resistance.
Forward outlook
- Local home prices are declining (-3.0%/yr); year-one equity from $898 of loan paydown is wiped out by about $4k of value loss. Plan a longer hold.
- Taylor County population projected at +16% by 2050 — long-run rental-demand tailwind backs the buy-and-hold thesis.
- At projected returns (-3.0% appreciation + 8.0% rent growth), your $36k cash investment doubles in ~9 years — after that, you're playing with house money.
Negotiation context
- It's been on market 35 days — a 3% lower offer ($126k) is reasonable based on typical stale-listing flexibility.
- 3 sale attempts since 18y ago; this cycle's ask has dropped $20k (13%) from the opening price — seller is motivated, your offer sets the floor, not the list.
Risks & watch-outs
- Climate carrying-cost: major flood risk; major wildfire risk; extreme-heat days projected 7→23/yr by 2055 (HVAC capex compounding) — expect insurance premiums to compound above CPI over the hold.
Questions for the listing agent
- It's been on market 35 days. Have you received any prior offers? Is the seller open to a 3% concession, seller financing, or rate buy-down credit?
- Built in 1964 — when were the roof, HVAC, electrical panel, plumbing, and water heater last replaced?
- What does the HOA fee cover, when was the last increase, and are there any pending special assessments or reserve-fund shortfalls?
- Is there a deadline driving the sale (1031 exchange, divorce, estate, relocation)? That informs how much negotiation room exists.
- Schools are D-rated, which usually means shorter tenancies and higher turnover. Who's the typical renter profile here, and what's been the actual vacancy rate?
- Crime grade is D in this area — have there been break-ins, vandalism, or insurance claims at this property in the last 3 years? What carrier currently insures it and at what premium?
- What's the average days-on-market for RENTAL listings here right now (not sales)? A rising rental-DOM trend means longer vacancies and softer asking-rent achievability than the comps imply.
- What's the recent tenant-quality profile in this submarket — average credit score on applications, eviction rate, late-payment / NSF rate, and stable-employment percentage? A property-management company in the area should have these aggregated.
- How much new for-sale + rental construction is in the pipeline within 1–3 miles? Heavy new supply typically softens prices + rents 12–24 months out; constrained supply supports both.
Investment metrics
- 1% rule
- 1.08% ✓
- Cap rate
- 7.81%
- Cash-on-cash
- 5.41%
- DSCR
- 1.24
- GRM
- 7.7
CMA / ARV
No comps found within radius.
Projected returns pro-forma
-3.0% appreciation · 8.0% rent growth · sell at horizon
- IRR
- -2.2%
- Equity multiple
- 0.91×
- Total profit
- $-3,158
- Equity at exit
- $19,369
- IRR
- 12.5%
- Equity multiple
- 2.23×
- Total profit
- $44,578
- Equity at exit
- $11,231
Cash invested: $36,372 (down + closing). Projections, not guarantees.
Landlord ↔ Tenant lean methodology
- Overall (STATE)
- 87 Strongly Landlord-Friendly
- State Texas
- 87 Strongly Landlord-Friendly · R+5
- County
- — inherits STATE
- City
- — inherits STATE
ZIP-level market 79603
- Home prices YoY
- -32.5%
- Rents YoY
- 40.2%
- Active inventory
- 86
- Price-to-rent
- 7.7×
Monthly cashflow live
- Estimated rent
- $1,400 medium interval (Pro) →
- Mortgage (P&I)
- −$681
- Tax from tax record
- −$107 /mo · $1,285/yr
- Insurance
- −$54
- HOA
- −$100
- Vacancy / Maint / Mgmt
- −$294
- Net cashflow
- $164
Break-even live
UW: 25.0% down · 7.5% · 30yr · 1.5% tax · 5.0% vac · 8.0% maint · 8.0% mgmt
Financing live
Cash to close
- Down payment
- $32,475
- Closing costs
- $3,897
- Reserves months
- —
- Total cash needed
- —
Loan-product check · same deal, 3 products live
Conventional
25% down · 7.5% · 30yr
- Down + closing
- —
- Monthly P&I
- —
- Monthly cashflow
- —
- DSCR
- —
- Eligible?
- —
Personal DTI + credit; lowest rate.
DSCR
20% down · 8.5% · 30yr
- Down + closing
- —
- Monthly P&I
- —
- Monthly cashflow
- —
- DSCR
- —
- Eligible?
- —
No personal income docs; deal must DSCR.
Hard money
10% down · 12.0% · 12mo
- Down + closing
- —
- Monthly P&I
- —
- Monthly cashflow
- —
- DSCR
- —
- Eligible?
- —
Short-term bridge; refi at stabilization.
Rent comps 2 comps
| Address | Beds | Baths | Sqft | Rent | $/sqft | DOM | Units | Dist |
|---|---|---|---|---|---|---|---|---|
| 841 S San Jose Dr Abilene, TX | 2.0 | 1.0 | 1122 | $3,000 | $2.67 | 21d | 1 | 0.89mi |
| 728 Redbird Ln Abilene, TX | 2.0 | 1.5 | 994 | $1,695 | $1.71 | 13d | 1 | 1.43mi |
HOA detail
- Monthly dues
- $100 · $1,200/yr
Listing history 15 events
-
2026-05-03status Pending
-
2026-04-24historical Active Option Contract
-
2026-04-15price $129,900
-
2026-03-29$150,000 Active
-
2024-08-08soldstatus Closed 171-char remark
Show marketing remark (171 chars)
Townhome with two bedrooms and full bath upstairs. Half bath located downstairs adjacent to kitchen. Two car garage with small storage, alley access. Tiled living room.
-
2024-08-08soldstatus
Show marketing remark (171 chars)
Townhome with two bedrooms and full bath upstairs. Half bath located downstairs adjacent to kitchen. Two car garage with small storage, alley access. Tiled living room.
-
2024-08-05status Pending 171-char remark
Show marketing remark (171 chars)
Townhome with two bedrooms and full bath upstairs. Half bath located downstairs adjacent to kitchen. Two car garage with small storage, alley access. Tiled living room.
-
2024-07-24historical Active Option Contract 171-char remark
Show marketing remark (171 chars)
Townhome with two bedrooms and full bath upstairs. Half bath located downstairs adjacent to kitchen. Two car garage with small storage, alley access. Tiled living room.
-
2024-07-20price $60,000 171-char remark
Show marketing remark (171 chars)
Townhome with two bedrooms and full bath upstairs. Half bath located downstairs adjacent to kitchen. Two car garage with small storage, alley access. Tiled living room.
-
2024-03-07$75,000 Active 171-char remark
Show marketing remark (171 chars)
Townhome with two bedrooms and full bath upstairs. Half bath located downstairs adjacent to kitchen. Two car garage with small storage, alley access. Tiled living room.
-
2009-07-08soldstatus
-
2009-07-07soldstatus 213-char remark
Show marketing remark (213 chars)
SELLER WILL GIVE ALLOWANCE FOR BRAND-NEW KITCHEN APPLIANCES-REFRIGERATOR, STOVETOP, & WALLOVEN. HOMEOWNERS FEES INCLUDE ACCESS TO SWIMMING POOL, FRONT YARD MAINTENANCE, EXTERIOR BUILDING UPKEEP, AND CABLE TV.
-
2009-06-07historical 213-char remark
Show marketing remark (213 chars)
SELLER WILL GIVE ALLOWANCE FOR BRAND-NEW KITCHEN APPLIANCES-REFRIGERATOR, STOVETOP, & WALLOVEN. HOMEOWNERS FEES INCLUDE ACCESS TO SWIMMING POOL, FRONT YARD MAINTENANCE, EXTERIOR BUILDING UPKEEP, AND CABLE TV.
-
2008-08-02$44,500 213-char remark
Show marketing remark (213 chars)
SELLER WILL GIVE ALLOWANCE FOR BRAND-NEW KITCHEN APPLIANCES-REFRIGERATOR, STOVETOP, & WALLOVEN. HOMEOWNERS FEES INCLUDE ACCESS TO SWIMMING POOL, FRONT YARD MAINTENANCE, EXTERIOR BUILDING UPKEEP, AND CABLE TV.
-
1984-05-25soldstatus
ⓘ Source: listings_history table (triggers on properties + properties_extension) + one-shot
backfill from property_details.listing_events for pre-trigger history.
Tax reassessment forecast TX · Resets to sale price
- Current annual tax
- $1,285 · $107/mo
- Projected year-2 tax
- $2,377 · $198/mo
- Expected delta
- +$1,092/yr (+$91/mo · 85.0%)
ⓘ Screening estimate from a state-policy table — verify with the county assessor before closing.
Climate risk First Street
- Flood 6/10 Major FEMA zone X (shaded) · 93% chance over 30 yrs
- Wildfire 7/10 Severe
- Heat 7/10 Severe 7 d/yr ≥104°F today · 23 d/yr by 30 yrs out
- Wind 4/10 Moderate 11% chance of damaging wind over 30 yrs
- Air quality 1/10 Low 0 unhealthy d/yr today · 0 by 30 yrs out
Nearby sold comps map
Loading sold comps map…
Walkable amenities ~0.75 mi
Loading nearby amenities…
Taxation est. · year 1
- Rental income
- $16,805
- − Mortgage interest
- −$7,276
- − Property taxes
- −$1,285
- − Insurance
- −$650
- − Repairs & maintenance
- −$1,344
- − Management
- −$1,344
- − HOA
- −$1,200
- − Depreciation
- −$3,779
- Taxable loss
- −$73
- Est. tax savings @ 24.0%
- +$18
- After-tax cash flow
- $1,985/yr
For passive investors: Depreciation is non-cash, so a rental often shows a tax loss while cash-flowing — sheltering income. Rental losses are passive: they offset passive income freely, and up to $25,000/yr can offset ordinary (W-2) income if you actively participate and your MAGI is under $100k (phasing out to $0 by $150k); unused losses carry forward. On sale, claimed depreciation is recaptured at up to 25%, and gains may owe capital-gains tax (a 1031 exchange can defer both). Figures are a year-1 estimate at your 24.0% rate — not tax advice; consult a CPA.
Schools (NCES district)
- District
- Abilene ISD
- NCES district ID
- 4807440
- Math proficiency
- 32% ▼ -11.00%
- Reading proficiency
- 34% ▼ -5.00%
- Median HH income
- $39,782
- Composite
- 27.71/100
- National rank
- #6909
- State rank
- #575 of 826 in TX
Livability — Abilene
- Score
- 75/100
- State rank
- #142
- US rank
- #4037
Category grades
Schools grade is shown separately in the Schools card above.
Census & demographics
- Census place
- Abilene, TX
- County
- Taylor County · 136,672 people
- City population
- 136,672
- Metro
- Abilene, TX
- Population (ZIP)
- 23,548
- Household income
- $53,513
- Rent vs Own
- Severe rent burden
- 662.0
Population outlook (Taylor County) Hauer SSP2
- Today (2025)
- 145,270 people
- By 2030
- 150,050 · +3.3%
- By 2040
- 159,417 · +9.7%
- By 2050
- 168,883 · +16.3%
- By 2075
- 194,436 · +33.8%
- By 2100
- 203,163 · +39.9%
Race, ethnicity, and origin ACS 2023
- Neighborhood character
- Diverse neighborhood (Simpson 0.60)
- Race & ethnicity
- Hispanic / Latino 48% White 40% Two or more races 24% Black 8%
- Hispanic origin (detail)
- Mexican 44%
- Common ancestry
- Italian 2% Slovak 2% Portuguese 1%
- Foreign-born
- 9% · Canada
- Languages at home
- 73% English-only · Spanish 25%
Political lean MEDSL · Taylor
- 2024 margin
- Solid R (+49.8) · D 24.6% · R 74.4% · Other 1.0%
- 2008→2024 swing
- -4.2pp toward R · 2008: -45.6pp · 2024: -49.8pp
- All cycles
- 2024: R+49.8 2020: R+45.3 2016: R+51.1 2012: R+53.6 2008: R+45.6
Not yet ingested
- Civics
- —
Market trends
- HPI YoY
- ▼ -88.84%
- Current HPI
- 184.8875
- Rent YoY
- ▲ 40.19%
- Metro
- Abilene, TX
- State GDP YoY
- ▲ 3.95%
- F500 in state
- 110
Industry mix (Fortune 500 HQ in TX)
| Industry | F500 HQs | Revenue |
|---|---|---|
| Energy | 16 | $1,198B |
|
||
| Technology | 5 | $198B |
|
||
| Engineering / Construction | 4 | $72B |
|
||
| Energy Services | 3 | $60B |
|
||
| Utilities | 3 | $41B |
|
||
| Healthcare | 2 | $330B |
|
||
Price history
+191.9% since first listed15 events — show timeline
- 2026-05-03 Pending — NTREIS
- 2026-04-24 Contingent — NTREIS
- 2026-04-15 Price Changed $129,900 NTREIS
- 2026-03-29 Listed $150,000 NTREIS
- 2024-08-08 Sold (Public Records) — Public Records
- 2024-08-08 Sold (MLS) — NTREIS
- 2024-08-05 Pending — NTREIS
- 2024-07-24 Contingent — NTREIS
- 2024-07-20 Price Changed $60,000 NTREIS
- 2024-03-07 Listed $75,000 NTREIS
- 2009-07-08 Sold (Public Records) — Public Records
- 2009-07-07 Sold (MLS) — NTREIS
- 2009-06-07 Listing Removed — NTREIS
- 2008-08-02 Listed $44,500 NTREIS
- 1984-05-25 Sold (Public Records) — Public Records
Property tax history
+4.1%/yrLatest (2025): $1,285 · -14.2% YoY. Source: county tax records.
Cash-flow waterfall
monthlySold comps — $/sqft
last 12 mo · ≤1 miLoading sold comps…