456 La Jolla St · Vallejo, CA
Flood risk 1/10 · Minimal
- FEMA flood zone
- X (unshaded)
- Chance of flooding over 30 yrs
- 0.0%
- Est. flood insurance / yr
- $507 – $1,088
Fire risk 1/10 · Minimal
- Est. fire insurance / yr
- $659 – $1,223
Heat risk 4/10 · Minor
- Hot days now (above 93°F)
- 7 days/yr
- Hot days in 30 yrs
- 14 days/yr
Wind risk 1/10 · Minimal
- Chance of severe wind over 30 yrs
- —
Air-quality risk 9/10 · Severe
- Unhealthy air days now
- 16 days/yr
- Unhealthy air days in 30 yrs
- 17 days/yr
Risk factors via First Street. Map © Google.
Why this score? — see what drove the B- grade
The composite is a weighted blend of 9 inputs, each scored 0–100. Each bar is that input's sub-score; the figure is the points it added to the 100-point composite (weight × sub-score).
- Cash flow +24.9/30.0
- ARV discount +15.0/15.0
- DSCR +8.1/10.0
- 1% rule +6.2/10.0
- Livability +3.4/5.0
- Rent growth +2.8/5.0
- Schools +2.6/10.0
- Condition / age +2.5/5.0
- Appreciation +0.0/10.0
$229,000
🖨 Deal sheet (PDF) 📄 Offer letter ✓ Due diligence
Listing remarks
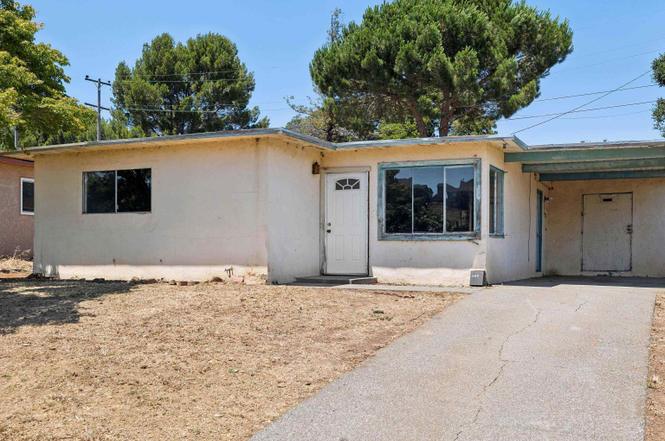
456 La Jolla Street is a 3-bedroom mid-century fixer upper with the kind of setting that makes a renovation worth taking on. A perfect maple tree shades the front of the home and gives the property a welcoming first impression. The backyard is the real standout: no rear neighbor, multiple mature trees, a large flat area for outdoor living, gardening, play, and beautiful views of the surrounding hills. The house is ready for a buyer with ideas. Restore its mid-century character, take it in a clean modern direction, or improve it over time while creating a home and outdoor space that fit the way you live. The Beverly Hills neighborhood offers a quiet, established Vallejo setting with good acc
Key facts
- Glen cove center
- Large flat area
- Hillside views
Tags
Property features AI
Exterior
- Parking: 1-car garage; Carport (covered)
- Utilities: Public water; Public sewer
- Home design: Single family residence; Residential property; Built in 1953
- Construction: Stucco construction
- Exterior features: Back yard
Interior
- Kitchen: Kitchen (other features)
- Bedrooms: 3 bedrooms
- Bathrooms: 1 full bathroom
- Heating & cooling: Wall furnace heating; Ceiling fan cooling
- Interior features: Utility room; Laundry facility
- Laundry & utility: Washer/dryer hookups only
Neighborhood map
What this means for you Summary
Snapshot
- This is a 3-bed/1.0-bath single-family listed at $229k.
Deal economics
- At list price, monthly cash flow is $495 ($6k/yr) — positive.
- The deal already cash-flows at list — no discount required.
- Meets the 1% rule at list price ($3k rent vs $229k).
- Cap rate 8.9% vs local median 3.1% in Vallejo — top-decile yield for the area; either an underpriced asset or a hidden risk that comps aren't pricing in. Stress-test before assuming the spread holds.
Location & tenants
- Location reads 67/100 on livability (#304 in CA) — a middle-class / working-renter tenant base. Strengths: commute A+, housing A+, health & safety A+; Watch: schools D-, crime F, cost of living F.
- Vallejo City Unified (urban): math 20% / reading 30% proficiency, ranked #1,124 of 1,400 in CA (top 80%) — low school quality limits family demand, transient renter base, plan for 1-2y turnover; 62% free/reduced lunch — lower-income household profile, screen leases tightly.
- Market conditions: Rents rising (+1.4%/yr); 185 active listings in the ZIP; 24 comparable units currently listed for rent nearby; rentals at typical pace (median 25d on market — plan ~3-4 weeks tenant-placement turnaround); solid renter incomes; 1,472 units permitted in Solano County in 2024 (131 in 5+ unit buildings).
Forward outlook
- Local home prices are declining (-3.0%/yr); year-one equity from $2k of loan paydown is wiped out by about $7k of value loss. Plan a longer hold.
- Solano County population projected at +15% by 2050 — modest demand growth; plan on rents tracking national, not racing it.
Negotiation context
- Only 1 days on market — expect competitive offers; lowballing is unlikely to land.
Risks & watch-outs
- Watch-outs: built in 1953 — expect roof / HVAC / electrical / plumbing capex.
Questions for the listing agent
- Built in 1953 — when were the roof, HVAC, electrical panel, plumbing, and water heater last replaced?
- Is there a deadline driving the sale (1031 exchange, divorce, estate, relocation)? That informs how much negotiation room exists.
- Schools are D-rated, which usually means shorter tenancies and higher turnover. Who's the typical renter profile here, and what's been the actual vacancy rate?
- Crime grade is F in this area — have there been break-ins, vandalism, or insurance claims at this property in the last 3 years? What carrier currently insures it and at what premium?
- What's the average days-on-market for RENTAL listings here right now (not sales)? A rising rental-DOM trend means longer vacancies and softer asking-rent achievability than the comps imply.
- What's the recent tenant-quality profile in this submarket — average credit score on applications, eviction rate, late-payment / NSF rate, and stable-employment percentage? A property-management company in the area should have these aggregated.
- How much new for-sale + rental construction is in the pipeline within 1–3 miles? Heavy new supply typically softens prices + rents 12–24 months out; constrained supply supports both.
Investment metrics
- 1% rule
- 1.12% ✓
- Cap rate
- 8.89%
- Cash-on-cash
- 9.26%
- DSCR
- 1.41
- GRM
- 7.4
CMA / ARV
- ARV (on-the-fly)
- $443,394
- Comps found
- 12
Show comp detail 12 sales within ~0.75 mi
| Address | Dist | Beds/Ba | Sqft | Sold | Price | $/sf | Match |
|---|---|---|---|---|---|---|---|
| 457 La Jolla St | 0.02mi | 3/1.0 | 966 (0%) | 9mo | $443,000 | $459 | 92 |
| 1577 Magazine St | 0.15mi | 3/1.0 | 966 (0%) | 2mo | $410,000 | $424 | 91 |
| 426 La Jolla St | 0.05mi | 3/1.0 | 900 (-7%) | 4mo | $440,000 | $489 | 83 |
| 126 Jordan St | 0.39mi | 3/1.0 | 940 (-3%) | 4mo | $474,900 | $505 | 74 |
| 1012 Pine St | 0.53mi | 2/1.0 (-1) | 936 (-3%) | 1mo | $445,000 | $475 | 64 |
| 1401 Magazine St | 0.27mi | 3/1.5 | 875 (-9%) | 8mo | $390,000 | $446 | 64 |
| 1306 Magazine St | 0.36mi | 3/1.0 | 875 (-9%) | 7mo | $340,000 | $389 | 62 |
| 113 Laguna St | 0.57mi | 3/1.0 | 1,040 (+8%) | 4mo | $405,000 | $389 | 58 |
| 337 Alhambra Ave | 0.54mi | 3/1.0 | 875 (-9%) | 9mo | $428,000 | $489 | 52 |
| 112 Laurel St | 0.62mi | 3/1.0 | 875 (-9%) | 7mo | $300,000 | $343 | 50 |
| 837 6th St | 0.73mi | 3/2.0 | 1,032 (+7%) | 5mo | $450,000 | $436 | 46 |
| 1005 Atherton St | 0.69mi | 2/1.0 (-1) | 864 (-11%) | 6mo | $420,000 | $486 | 40 |
Match score weights: distance 35% · size 25% · config 20% · recency 20%. Top-matched comps best support the ARV.
Projected returns pro-forma
-3.0% appreciation · 1.35% rent growth · sell at horizon
- IRR
- -4.2%
- Equity multiple
- 0.85×
- Total profit
- $-9,789
- Equity at exit
- $34,145
- IRR
- 3.6%
- Equity multiple
- 1.24×
- Total profit
- $15,404
- Equity at exit
- $19,800
Cash invested: $64,120 (down + closing). Projections, not guarantees.
Landlord ↔ Tenant lean methodology
- Overall (STATE)
- 18 Strongly Tenant-Friendly
- State California
- 18 Strongly Tenant-Friendly · D+13
- County
- — inherits STATE
- City
- — inherits STATE
ZIP-level market 94591
- Rents YoY
- 1.4%
- Active inventory
- 185
- Price-to-rent
- 7.4×
Monthly cashflow live
- Estimated rent
- $2,576 high interval (Pro) →
- Mortgage (P&I)
- −$1,201
- Tax from tax record
- −$244 /mo · $2,926/yr
- Insurance
- −$95
- HOA
- −$0
- Vacancy / Maint / Mgmt
- −$541
- Net cashflow
- $495
Break-even live
Sensitivity live
| Price | -10% $624 | -5% $560 | +0% $495 | +5% $430 | +10% $365 |
|---|---|---|---|---|---|
| Rent | -10% $291 | -5% $393 | +0% $495 | +5% $597 | +10% $698 |
| Rate | -1.0pp $610 | -0.5pp $553 | base $495 | +0.5pp $435 | +1.0pp $375 |
UW: 25.0% down · 7.5% · 30yr · 1.5% tax · 5.0% vac · 8.0% maint · 8.0% mgmt
Financing live
Cash to close
- Down payment
- $57,250
- Closing costs
- $6,870
- Reserves months
- —
- Total cash needed
- —
Loan-product check · same deal, 3 products live
Conventional
25% down · 7.5% · 30yr
- Down + closing
- —
- Monthly P&I
- —
- Monthly cashflow
- —
- DSCR
- —
- Eligible?
- —
Personal DTI + credit; lowest rate.
DSCR
20% down · 8.5% · 30yr
- Down + closing
- —
- Monthly P&I
- —
- Monthly cashflow
- —
- DSCR
- —
- Eligible?
- —
No personal income docs; deal must DSCR.
Hard money
10% down · 12.0% · 12mo
- Down + closing
- —
- Monthly P&I
- —
- Monthly cashflow
- —
- DSCR
- —
- Eligible?
- —
Short-term bridge; refi at stabilization.
Rent comps 24 comps
| Address | Beds | Baths | Sqft | Rent | $/sqft | DOM | Units | Dist |
|---|---|---|---|---|---|---|---|---|
| 706 La Canyada Dr Vallejo, CA | 3.0 | 2.0 | 1075 | $2,799 | $2.60 | 14d | 1 | 0.13mi |
| 924 Palou St Vallejo, CA | 3.0 | 1.0 | 966 | $2,500 | $2.59 | 24d | 1 | 0.22mi |
| 403 Gilcrest Ave Unit 403 Vallejo, CA | 2.0 | 1.0 | 850 | $1,599 | $1.88 | 44d | 1 | 0.37mi |
| 152 Jordan St Vallejo, CA | 2.0 | 1.0 | 750 | $2,175 | $2.90 | 44d | 1 | 0.38mi |
| 962 Pine St Vallejo, CA | 3.0 | 2.0 | 1000 | $3,200 | $3.20 | 44d | 1 | 0.54mi |
| 935 Sheridan St Unit C Vallejo, CA | 2.0 | 1.0 | 800 | $2,190 | $2.74 | 24d | 1 | 0.64mi |
| 929 Sheridan St Unit A Vallejo, CA | 2.0 | 1.0 | 650 | $2,250 | $3.46 | 24d | 1 | 0.64mi |
| 1007 Grant St Unit 1007 Vallejo, CA | 2.0 | 1.0 | 600 | $1,850 | $3.08 | 24d | 1 | 0.65mi |
| 136 Sea Crest Cir Vallejo, CA | 2.0 | 1.0 | 900 | $2,350 | $2.61 | 44d | 1 | 0.68mi |
| 532 Magazine St Vallejo, CA | 1.0–2.0 | 1.0–2.0 | 792 | $2,888 | $3.65 | 25d | 12 | 0.72mi |
| 532 Magazine St Vallejo, CA | 2.0 | 2.0 | 762 | $3,188 | $4.18 | 0d | 9 | 0.72mi |
| 532 Magazine St Vallejo, CA | 2.0 | 1.0–2.0 | 792 | $2,988 | $3.77 | 4d | 11 | 0.72mi |
| 1107 Porter St Vallejo, CA | 1.0–2.0 | 1.0–2.0 | 751 | $2,250 | $2.99 | 3d | 10 | 0.82mi |
| 961 Porter St Vallejo, CA | 2.0–3.0 | 1.0–3.0 | 1159 | $3,355 | $2.89 | 0d | 11 | 0.82mi |
| 412 Home Acres Ave Vallejo, CA | 2.0 | 1.0 | 724 | $1,950 | $2.69 | 24d | 1 | 0.83mi |
| 308 Annette Ave Vallejo, CA | 2.0 | 1.0 | 750 | $1,800 | $2.40 | 14d | 1 | 0.88mi |
| 1201 Glen Cove Pkwy Vallejo, CA | 2.0 | 2.0 | 1100 | $2,350 | $2.14 | 24d | 2 | 0.92mi |
| 1201 Glen Cove Pkwy Vallejo, CA | 2.0 | 2.0 | 1038 | $2,150 | $2.07 | 44d | 2 | 0.92mi |
| 1201 Glen Cove Pkwy #1407 Vallejo, CA | 2.0 | 2.0 | 1101 | $2,400 | $2.18 | 0d | 1 | 1.01mi |
| 1201 Glen Cove Pkwy #1407 Vallejo, CA | 2.0 | 2.0 | 1101 | $2,400 | $2.18 | 17d | 1 | 1.01mi |
| 551 5th St Vallejo, CA | 3.0 | 1.0 | 1000 | $2,550 | $2.55 | 24d | 1 | 1.06mi |
| 100 Buss Ave Vallejo, CA | 2.0 | 1.0 | 1116 | $2,800 | $2.51 | 44d | 1 | 1.19mi |
| 664 Lincoln Rd E Unit 664 Vallejo, CA | 2.0 | 1.0 | 843 | $1,995 | $2.37 | 44d | 1 | 1.23mi |
| 765 Pope Dr Unit C Vallejo, CA | 2.0 | 2.0 | 1050 | $1,950 | $1.86 | 44d | 1 | 1.42mi |
Listing history 2 events
-
2026-06-19remarks 699-char remark
-
2026-06-19$229,000 Active 1 DOM
ⓘ Source: listings_history table (triggers on properties + properties_extension) + one-shot
backfill from property_details.listing_events for pre-trigger history.
Tax reassessment forecast CA · Resets to sale price
- Current annual tax
- $2,926 · $244/mo
- Projected year-2 tax
- $2,926 · $244/mo
- Expected delta
- $0/yr ($0/mo · 0.0%)
ⓘ Screening estimate from a state-policy table — verify with the county assessor before closing.
Climate risk First Street
- Flood 1/10 Low FEMA zone X (unshaded) · 0% chance over 30 yrs
- Wildfire 1/10 Low
- Heat 4/10 Moderate 7 d/yr ≥93°F today · 14 d/yr by 30 yrs out
- Wind 1/10 Low
- Air quality 9/10 Extreme 16 unhealthy d/yr today · 17 by 30 yrs out
Nearby sold comps map
Loading sold comps map…
Walkable amenities ~0.75 mi
Loading nearby amenities…
Taxation est. · year 1
- Rental income
- $30,911
- − Mortgage interest
- −$12,828
- − Property taxes
- −$2,926
- − Insurance
- −$1,145
- − Repairs & maintenance
- −$2,473
- − Management
- −$2,473
- − Depreciation
- −$6,662
- Taxable income
- $2,404
- Est. tax owed @ 24.0%
- −$577
- After-tax cash flow
- $5,360/yr
For passive investors: Depreciation is non-cash, so a rental often shows a tax loss while cash-flowing — sheltering income. Rental losses are passive: they offset passive income freely, and up to $25,000/yr can offset ordinary (W-2) income if you actively participate and your MAGI is under $100k (phasing out to $0 by $150k); unused losses carry forward. On sale, claimed depreciation is recaptured at up to 25%, and gains may owe capital-gains tax (a 1031 exchange can defer both). Figures are a year-1 estimate at your 24.0% rate — not tax advice; consult a CPA.
Schools (NCES district)
- District
- Vallejo City Unified
- NCES district ID
- 0640740
- Math proficiency
- 20% ▬ 0.00%
- Reading proficiency
- 30% ▬ 0.00%
- Median HH income
- $59,919
- Composite
- 26.02/100
- National rank
- #12743
- State rank
- #1124 of 1400 in CA
Livability — Vallejo
- Score
- 67/100
- State rank
- #304
- US rank
- #10215
Category grades
Schools grade is shown separately in the Schools card above.
Census & demographics
- Census place
- Vallejo, CA
- County
- Solano County · 433,239 people
- City population
- 125,311
- Metro
- Vallejo, CA
- Population (ZIP)
- 58,193
- Household income
- $104,550
- Rent vs Own
- Severe rent burden
- 2021.0
Population outlook (Solano County) Hauer SSP2
- Today (2025)
- 478,685 people
- By 2030
- 497,974 · +4.0%
- By 2040
- 528,515 · +10.4%
- By 2050
- 549,115 · +14.7%
- By 2075
- 587,229 · +22.7%
- By 2100
- 571,378 · +19.4%
Race, ethnicity, and origin ACS 2023
- Neighborhood character
- Highly diverse neighborhood (Simpson 0.79)
- Race & ethnicity
- Asian 28% Hispanic / Latino 24% White 23% Two or more races 17% Black 15%
- Hispanic origin (detail)
- Mexican 17%
- Common ancestry
- Lithuanian 1% Italian 1% Russian 1%
- Foreign-born
- 26% · Canada, China, Vietnam
- Languages at home
- 65% English-only · Tagalog/Filipino 15% Spanish 14% Chinese 2%
Political lean MEDSL · Solano
- 2024 margin
- Strong D (+23.0) · D 60.0% · R 37.1% · Other 2.9%
- 2008→2024 swing
- -5.6pp toward R · 2008: 28.6pp · 2024: 23.0pp
- All cycles
- 2024: D+23.0 2020: D+30.3 2016: D+30.5 2012: D+28.1 2008: D+28.6
Not yet ingested
- Civics
- —
Market trends
- HPI YoY
- ▼ -414.47%
- Current HPI
- 282.9528
- Rent YoY
- ▲ 1.35%
- Metro
- Vallejo, CA
- State GDP YoY
- ▲ 3.21%
- F500 in state
- 116
Industry mix (Fortune 500 HQ in CA)
| Industry | F500 HQs | Revenue |
|---|---|---|
| Technology | 27 | $1,492B |
|
||
| Financial Services | 3 | $174B |
|
||
| Retail | 3 | $44B |
|
||
| Insurance | 3 | $26B |
|
||
| Media / Entertainment | 2 | $115B |
|
||
| Pharmaceuticals / Biotech | 2 | $62B |
|
||
Price history
+163.2% since first listed3 events — show timeline
- 2026-06-18 Listed $229,000 bridgeMLS, Bay East AOR, or Contra Costa AOR
- 2026-05-11 Sold (Public Records) $227,000 Public Records
- 1991-09-05 Sold (Public Records) $87,000 Public Records
Property tax history
+5.3%/yrLatest (2025): $2,926 · +6.2% YoY. Source: county tax records.
Cash-flow waterfall
monthlySold comps — $/sqft
last 12 mo · ≤1 miLoading sold comps…