 Multi-family
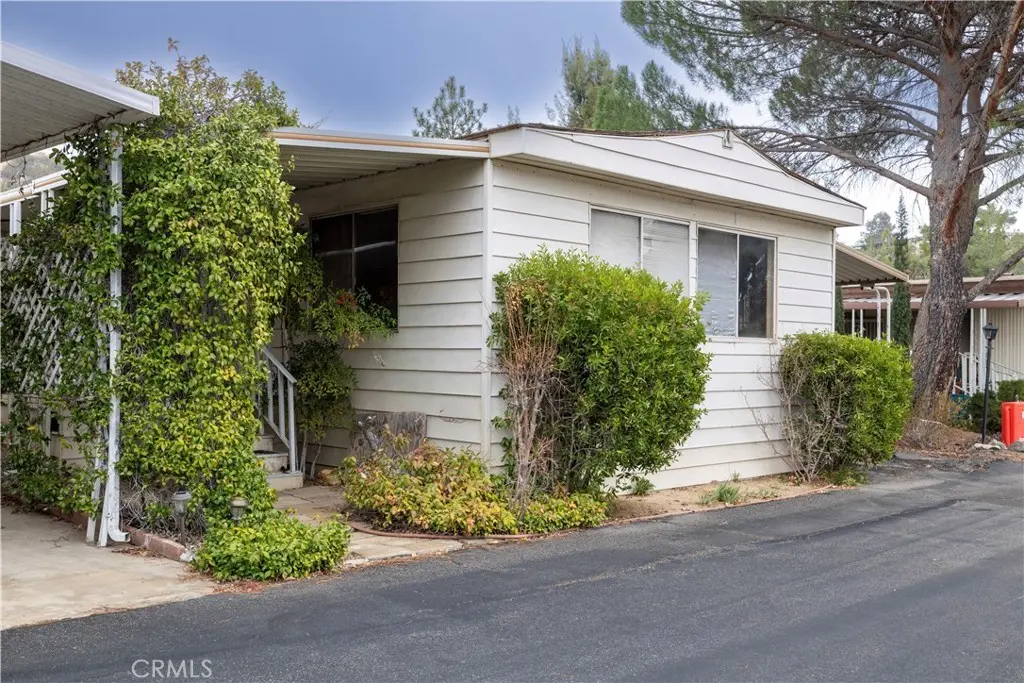
35109 Highway 79 · Aguanga, CA
Flood risk 1/10 · Minimal
- FEMA flood zone
- D
- Chance of flooding over 30 yrs
- 0.0%
- Est. flood insurance / yr
- $544 – $1,084
Fire risk 10/10 · Severe
- Est. fire insurance / yr
- $659 – $1,223
Heat risk 5/10 · Moderate
- Hot days now (above 97°F)
- 7 days/yr
- Hot days in 30 yrs
- 21 days/yr
Wind risk 1/10 · Minimal
- Chance of severe wind over 30 yrs
- —
Air-quality risk 6/10 · Moderate
- Unhealthy air days now
- 9 days/yr
- Unhealthy air days in 30 yrs
- 12 days/yr
Risk factors via First Street. Map © Google.
Why this score? — see what drove the B+ grade
The composite is a weighted blend of 9 inputs, each scored 0–100. Each bar is that input's sub-score; the figure is the points it added to the 100-point composite (weight × sub-score).
- Cash flow +30.0/30.0
- 1% rule +10.0/10.0
- DSCR +10.0/10.0
- Appreciation +10.0/10.0
- ARV discount +7.5/15.0
- Rent growth +2.5/5.0
- Condition / age +2.5/5.0
- Schools +2.2/10.0
- Livability +1.5/5.0
$74,900
🖨 Deal sheet 📄 Offer letter ✓ Due diligence
Multi-family units
County records classify this as Multi-Family (5+ Unit). Listing-text estimate: 1 unit. estimate disagrees with records
5+ unit building — per-unit beds/baths from public records are typically unavailable; the breakdown below (if shown) is an estimate from the listing text.
Listing remarks
Discover your dream home oasis in the highly sought-after 55+ community of Stone Ridge, Warner Springs Estates. This fixer is a 2-bedroom, 2-bathroom home with approx. 1,040 sq ft of original living space with large, attached sunroom which could be a 3rd bedroom, office or game room. Built in 1973, this older construction home boasts an inviting open floor plan. This affordable home provides a blank canvass for those with imagination and desire to create something truly special. The Stone Ridge community elevates the 55+ lifestyle with an impressive array of amenities. Residents can explore scenic walking and hiking trails, enjoy the tranquility of three fishing ponds, and socialize at the
Key facts
- Open floor plan
- Dance hall
- Community center
Tags
Neighborhood map
What this means for you Summary
Snapshot
- This is a 2-bed/2.0-bath multifamily listed at $75k.
Deal economics
- At list price, monthly cash flow is $946 ($11k/yr) — positive.
- The deal already cash-flows at list — no discount required.
- Meets the 1% rule at list price ($2k rent vs $75k).
- Recommended offer: $68k (9.0% below list) — sets the bar for market timing.
- Cap rate 21.5% vs local median 2.1% in Aguanga — top-decile yield for the area; either an underpriced asset or a hidden risk that comps aren't pricing in. Stress-test before assuming the spread holds.
Location & tenants
- Location reads 29/100 on livability (#1,472 in CA) — a limited-amenity area; tenant pool skews transient or value-seeking. Strengths: crime A; Watch: schools D, amenities F, commute F.
- Warner Unified (rural): math 15% / reading 30% proficiency, ranked #1,219 of 1,400 in CA (top 87%) — low school quality limits family demand, transient renter base, plan for 1-2y turnover; 68% free/reduced lunch — lower-income household profile, screen leases tightly.
- Market conditions: 60 active listings in the ZIP; 11,759 units permitted in San Diego County in 2024 (7,244 in 5+ unit buildings).
Forward outlook
- In year one you build about $8k of equity ($518 loan paydown + $7k appreciation (10.0% local appreciation)).
- San Diego County population projected at +20% by 2050 — long-run rental-demand tailwind backs the buy-and-hold thesis.
- At projected returns (10.0% appreciation + 3.0% rent growth), your $21k cash investment doubles in ~2 years — after that, you're playing with house money.
- By year 5, paydown + projected appreciation supports a ~$37k cash-out refi (75% LTV) — recoverable capital for the next deal without selling this one.
Negotiation context
- It's been on market 99 days — a 9% lower offer ($68k) is reasonable based on typical stale-listing flexibility.
- 53 sale attempts since 28y ago; this cycle's ask is 4073% above the opening price — seller raised mid-cycle; expect resistance to lowballs.
- Current owner paid $10k; list at $75k implies a 649% gain — meaningful room to come down on a strong offer.
Risks & watch-outs
- Climate carrying-cost: severe wildfire risk; extreme-heat days projected 7→21/yr by 2055 (HVAC capex compounding) — expect insurance premiums to compound above CPI over the hold.
Questions for the listing agent
- It's been on market 99 days. Have you received any prior offers? Is the seller open to a 9% concession, seller financing, or rate buy-down credit?
- Built in 1972 — when were the roof, HVAC, electrical panel, plumbing, and water heater last replaced?
- What does the HOA fee cover, when was the last increase, and are there any pending special assessments or reserve-fund shortfalls?
- Why hasn't it sold? Are there any deal-killer items the seller is aware of (foundation, flood, title, zoning, code violations)?
- Is there a deadline driving the sale (1031 exchange, divorce, estate, relocation)? That informs how much negotiation room exists.
- Schools are D-rated, which usually means shorter tenancies and higher turnover. Who's the typical renter profile here, and what's been the actual vacancy rate?
- What's the average days-on-market for RENTAL listings here right now (not sales)? A rising rental-DOM trend means longer vacancies and softer asking-rent achievability than the comps imply.
- What's the recent tenant-quality profile in this submarket — average credit score on applications, eviction rate, late-payment / NSF rate, and stable-employment percentage? A property-management company in the area should have these aggregated.
- How much new apartment / multifamily construction is in the pipeline within 1–3 miles? Heavy new supply (>2% of stock underway) typically softens rents 12–24 months out; light construction supports rent growth.
Investment metrics
- 1% rule
- 3.10% ✓
- Cap rate
- 21.45%
- Cash-on-cash
- 54.15%
- DSCR
- 3.41
- GRM
- 2.7
CMA / ARV
- ARV (median comp)
- $180,991
- List price
- $74,900
- Delta
- -58.62%
- Verdict
- UNDERPRICED
- Comps
- 4 within 1.0 mi
Projected returns pro-forma
10.0% appreciation · 3.0% rent growth · sell at horizon
- IRR
- 67.2%
- Equity multiple
- 5.83×
- Total profit
- $101,329
- Equity at exit
- $67,476
- IRR
- 61.0%
- Equity multiple
- 12.99×
- Total profit
- $251,524
- Equity at exit
- $145,514
Cash invested: $20,972 (down + closing). Projections, not guarantees.
Landlord ↔ Tenant lean methodology
- Overall (STATE)
- 18 Strongly Tenant-Friendly
- State California
- 18 Strongly Tenant-Friendly · D+13
- County
- — inherits STATE
- City
- — inherits STATE
ZIP-level market 92086
- Home prices YoY
- 9.4%
- Active inventory
- 60
- Price-to-rent
- 5.4×
Monthly cashflow live
- Estimated rent
- $2,324 medium interval (Pro) →
- Mortgage (P&I)
- −$393
- Tax est. 1.5%
- −$94 /mo · $1,124/yr
- Insurance
- −$31
- HOA
- −$372
- Vacancy / Maint / Mgmt
- −$488
- Net cashflow
- $946
Break-even live
2-unit breakdown (identical units grouped — click to expand)
| Units | Beds | Baths | Est. rent |
|---|---|---|---|
| 2× units | 2 | 2 | $2,324 |
| #1 | 2 | 2 | $1,162 |
| #2 | 2 | 2 | $1,162 |
| Total (2 units) | $2,324 | ||
UW: 25.0% down · 7.5% · 30yr · 1.5% tax · 5.0% vac · 8.0% maint · 8.0% mgmt
Financing live
Cash to close
- Down payment
- $18,725
- Closing costs
- $2,247
- Reserves months
- —
- Total cash needed
- —
Loan-product check · same deal, 3 products live
Conventional
25% down · 7.5% · 30yr
- Down + closing
- —
- Monthly P&I
- —
- Monthly cashflow
- —
- DSCR
- —
- Eligible?
- —
Personal DTI + credit; lowest rate.
DSCR
20% down · 8.5% · 30yr
- Down + closing
- —
- Monthly P&I
- —
- Monthly cashflow
- —
- DSCR
- —
- Eligible?
- —
No personal income docs; deal must DSCR.
Hard money
10% down · 12.0% · 12mo
- Down + closing
- —
- Monthly P&I
- —
- Monthly cashflow
- —
- DSCR
- —
- Eligible?
- —
Short-term bridge; refi at stabilization.
HOA detail
- Monthly dues
- $372 · $4,464/yr
Listing history 50 events
-
2026-06-19days on market $74,900 Active 99 DOM
-
2026-06-18days on market $74,900 Active 98 DOM
-
2026-06-17days on market $74,900 Active 97 DOM
-
2026-06-16days on market $74,900 Active 96 DOM
-
2026-06-15days on market $74,900 Active 95 DOM
-
2026-06-14days on market $74,900 Active 93 DOM
-
2026-06-12days on market $74,900 Active 92 DOM
-
2026-06-09days on market $74,900 Active 89 DOM
-
2026-06-08days on market $74,900 Active 88 DOM
-
2026-06-07days on market $74,900 Active 87 DOM
-
2026-06-07days on market $74,900 Active 86 DOM
-
2026-06-04days on market $74,900 Active 83 DOM
-
2026-06-02days on market $74,900 Active 82 DOM
-
2026-06-01days on market $74,900 Active 81 DOM
-
2026-05-31days on market $74,900 Active 80 DOM
-
2026-05-31days on market $74,900 Active 79 DOM
-
2026-03-30historical $1,795
-
2026-03-15historical $1,795
-
2026-03-14$1,795
-
2026-02-05$1,795
-
2026-01-01historical $1,700
-
2025-12-11$1,700
-
2025-09-20historical $1,900
-
2025-09-15$1,900
-
2025-09-15historical $1,900
-
2025-08-26price $1,900
-
2025-07-05$1,985
-
2025-07-04historical $1,695
-
2025-05-09$1,695
-
2025-05-01historical $1,695
-
2025-03-12price $1,695
-
2025-01-18price $1,795
-
2024-11-01$1,855
-
2024-11-01historical $2,600
-
2024-10-15$2,600
-
2024-07-15historical $3,000
-
2024-07-01price $3,000
-
2024-06-30price $3,200
-
2024-06-26price $3,500
-
2024-06-25$1,500
-
2024-03-30historical $1,795
-
2024-01-07$1,795
-
2023-10-20historical $1,695
-
2023-09-14$1,695
-
2016-12-31historical
-
2016-06-07historical
-
2016-03-31price $49,000
-
2016-01-01$49,900
-
2015-12-31historical
-
2015-11-24historical
ⓘ Source: listings_history table (triggers on properties + properties_extension) + one-shot
backfill from property_details.listing_events for pre-trigger history.
Climate risk First Street
- Flood 1/10 Low FEMA zone D · 0% chance over 30 yrs
- Wildfire 10/10 Extreme
- Heat 5/10 Major 7 d/yr ≥97°F today · 21 d/yr by 30 yrs out
- Wind 1/10 Low
- Air quality 6/10 Major 9 unhealthy d/yr today · 12 by 30 yrs out
Nearby sold comps map
Loading sold comps map…
Walkable amenities ~0.75 mi
Loading nearby amenities…
Taxation est. · year 1
- Rental income
- $27,888
- − Mortgage interest
- −$4,196
- − Property taxes
- −$1,124
- − Insurance
- −$374
- − Repairs & maintenance
- −$2,231
- − Management
- −$2,231
- − HOA
- −$4,464
- − Depreciation
- −$2,179
- Taxable income
- $11,089
- Est. tax owed @ 24.0%
- −$2,661
- After-tax cash flow
- $8,695/yr
For passive investors: Depreciation is non-cash, so a rental often shows a tax loss while cash-flowing — sheltering income. Rental losses are passive: they offset passive income freely, and up to $25,000/yr can offset ordinary (W-2) income if you actively participate and your MAGI is under $100k (phasing out to $0 by $150k); unused losses carry forward. On sale, claimed depreciation is recaptured at up to 25%, and gains may owe capital-gains tax (a 1031 exchange can defer both). Figures are a year-1 estimate at your 24.0% rate — not tax advice; consult a CPA.
Schools (NCES district)
- District
- Warner Unified
- NCES district ID
- 0600042
- Math proficiency
- 15% ▬ 0.00%
- Reading proficiency
- 30% ▲ 10.00%
- Median HH income
- $38,559
- Composite
- 22.01/100
- National rank
- #13538
- State rank
- #1219 of 1400 in CA
Livability — Aguanga
- Score
- 29/100
- State rank
- #1472
- US rank
- #27924
Category grades
Schools grade is shown separately in the Schools card above.
Census & demographics
- Population (ZIP)
- 1,410
Population outlook (San Diego County) Hauer SSP2
- Today (2025)
- 3,678,185 people
- By 2030
- 3,856,546 · +4.8%
- By 2040
- 4,171,407 · +13.4%
- By 2050
- 4,421,607 · +20.2%
- By 2075
- 4,831,599 · +31.4%
- By 2100
- 4,832,502 · +31.4%
Race, ethnicity, and origin ACS 2023
- Neighborhood character
- Diverse neighborhood (Simpson 0.56)
- Race & ethnicity
- White 61% Hispanic / Latino 26% Two or more races 17% Asian 5% Native American 5%
- Hispanic origin (detail)
- Mexican 20%
- Common ancestry
- Iranian 3% Italian 3% Lithuanian 1%
- Foreign-born
- 14% · Canada, South Korea
- Languages at home
- 85% English-only · Spanish 11% Korean 2% Tagalog/Filipino 1%
Political lean MEDSL · San Diego
- 2024 margin
- D (+16.8) · D 56.9% · R 40.1% · Other 2.9%
- 2008→2024 swing
- +6.6pp toward D · 2008: 10.2pp · 2024: 16.8pp
- All cycles
- 2024: D+16.8 2020: D+22.8 2016: D+17.8 2012: D+5.1 2008: D+10.2
Not yet ingested
- Civics
- —
Market trends
- HPI YoY
- ▲ 28.73%
- Current HPI
- 334.0631
- Rent YoY
- —
- Metro
- —
- State GDP YoY
- ▲ 3.21%
- F500 in state
- 116
Industry mix (Fortune 500 HQ in CA)
| Industry | F500 HQs | Revenue |
|---|---|---|
| Technology | 27 | $1,492B |
|
||
| Financial Services | 3 | $174B |
|
||
| Retail | 3 | $44B |
|
||
| Insurance | 3 | $26B |
|
||
| Media / Entertainment | 2 | $115B |
|
||
| Pharmaceuticals / Biotech | 2 | $62B |
|
||
Price history
-97.0% since first listed123 events — show timeline
- 2026-03-30 Rental Removed $1,795 SHOWMOJO
- 2026-03-15 Rental Removed $1,795 APPFOLIO
- 2026-03-14 Listed for Rent $1,795 SHOWMOJO
- 2026-02-05 Listed for Rent $1,795 APPFOLIO
- 2026-01-01 Rental Removed $1,700 SHOWMOJO
- 2025-12-11 Listed for Rent $1,700 SHOWMOJO
- 2025-09-20 Rental Removed $1,900 APPFOLIO
- 2025-09-15 Listed for Rent $1,900 APPFOLIO
- 2025-09-15 Rental Removed $1,900 APPFOLIO
- 2025-08-26 Price Changed $1,900 APPFOLIO
- 2025-07-05 Listed for Rent $1,985 APPFOLIO
- 2025-07-04 Rental Removed $1,695 APPFOLIO
- 2025-05-09 Listed for Rent $1,695 APPFOLIO
- 2025-05-01 Rental Removed $1,695 APPFOLIO
- 2025-03-12 Price Changed $1,695 APPFOLIO
- 2025-01-18 Price Changed $1,795 APPFOLIO
- 2024-11-01 Listed for Rent $1,855 APPFOLIO
- 2024-11-01 Rental Removed $2,600 RENTALBEAST
- 2024-10-15 Listed for Rent $2,600 RENTALBEAST
- 2024-07-15 Rental Removed $3,000 Avail
- 2024-07-01 Price Changed $3,000 Avail
- 2024-06-30 Price Changed $3,200 Avail
- 2024-06-26 Price Changed $3,500 Avail
- 2024-06-25 Listed for Rent $1,500 Avail
- 2024-03-30 Rental Removed $1,795 PROPERTYWARE
- 2024-01-07 Listed for Rent $1,795 PROPERTYWARE
- 2023-10-20 Rental Removed $1,695 PROPERTYWARE
- 2023-09-14 Listed for Rent $1,695 PROPERTYWARE
- 2016-12-31 Listing Removed — CRMLS
- 2016-06-07 Listing Removed — CRMLS
- 2016-03-31 Price Changed $49,000 CRMLS
- 2016-01-01 Listed $49,900 CRMLS
- 2015-12-31 Listing Removed — CRMLS
- 2015-11-24 Listing Removed — CRMLS
- 2015-10-28 Listed $60,000 CRMLS
- 2015-08-22 Listing Removed — CRMLS
- 2015-08-21 Sold (MLS) $10,000 CRMLS
- 2015-08-20 Pending — CRMLS
- 2015-06-16 Listing Removed — CRMLS
- 2015-06-15 Listed $10,000 CRMLS
- 2015-05-28 Listing Removed — CRMLS
- 2015-05-08 Listed $115,000 CRMLS
- 2015-04-14 Price Changed $70,000 CRMLS
- 2015-04-06 Price Changed $7,000 CRMLS
- 2015-01-08 Listed $95,000 CRMLS
- 2015-01-05 Listed $49,900 CRMLS
- 2015-01-02 Listing Removed — CRMLS
- 2014-10-14 Price Changed $10,000 CRMLS
- 2014-03-05 Sold (MLS) $145,000 CRMLS
- 2014-01-01 Listed $59,900 CRMLS
- 2013-12-12 Listing Removed — CRMLS
- 2013-12-05 Listed $17,000 CRMLS
- 2013-06-12 Listed $59,900 CRMLS
- 2012-12-31 Listing Removed — CRMLS
- 2012-10-09 Listing Removed — CRMLS
- 2012-04-23 Listing Removed — CRMLS
- 2012-04-02 Listed $145,000 CRMLS
- 2012-03-20 Listed $125,000 CRMLS
- 2011-10-23 Listed $26,500 CRMLS
- 2010-10-12 Listed $79,999 CRMLS
- 2009-08-04 Listing Removed — CRMLS
- 2009-05-01 Listed $49,900 CRMLS
- 2009-04-16 Listing Removed — CRMLS
- 2009-04-08 Listing Removed — CRMLS
- 2008-04-21 Listed $139,900 CRMLS
- 2008-04-05 Listed $75,000 CRMLS
- 2008-01-03 Sold (MLS) $33,000 CRMLS
- 2007-11-28 Sold (MLS) $125,000 CRMLS
- 2007-10-01 Listing Removed — CRMLS
- 2007-09-17 Sold (MLS) $70,000 CRMLS
- 2007-05-24 Listed $94,900 CRMLS
- 2007-05-19 Listed $159,000 CRMLS
- 2007-02-08 Listed $35,000 CRMLS
- 2007-01-01 Listing Removed — CRMLS
- 2006-08-31 Listing Removed — CRMLS
- 2006-05-14 Listing Removed — CRMLS
- 2006-03-22 Listed $137,500 CRMLS
- 2006-02-22 Listed $289,000 CRMLS
- 2006-02-08 Sold (MLS) $50,000 CRMLS
- 2006-02-03 Listing Removed — CRMLS
- 2006-01-06 Listing Removed — CRMLS
- 2005-12-02 Listing Removed — CRMLS
- 2005-11-14 Listed $159,000 CRMLS
- 2005-11-03 Listed $144,600 CRMLS
- 2005-11-02 Sold (MLS) $105,000 CRMLS
- 2005-10-07 Listed $164,500 CRMLS
- 2005-09-11 Listed $119,000 CRMLS
- 2005-06-15 Listing Removed — CRMLS
- 2005-06-14 Listed $159,000 CRMLS
- 2005-06-13 Listing Removed — CRMLS
- 2005-04-27 Listing Removed — CRMLS
- 2005-02-28 Listing Removed — CRMLS
- 2005-02-11 Listed $284,000 CRMLS
- 2005-01-15 Listed $174,500 CRMLS
- 2005-01-11 Listing Removed — CRMLS
- 2005-01-08 Listed $92,500 CRMLS
- 2004-12-09 Sold (MLS) $109,750 CRMLS
- 2004-12-01 Listing Removed — CRMLS
- 2004-10-11 Listed $149,900 CRMLS
- 2004-08-27 Listed $245,000 CRMLS
- 2004-08-23 Listed $149,000 CRMLS
- 2004-08-23 Listed $117,500 CRMLS
- 2004-08-20 Sold (MLS) $80,000 CRMLS
- 2004-07-29 Listed $59,900 CRMLS
- 2004-07-29 Sold (MLS) $55,000 CRMLS
- 2004-06-01 Sold (MLS) $98,000 CRMLS
- 2004-05-05 Listed $59,000 CRMLS
- 2004-03-04 Sold (MLS) $146,900 CRMLS
- 2004-02-06 Listed $85,000 CRMLS
- 2004-02-05 Listed $98,500 CRMLS
- 2004-01-07 Listed $146,900 CRMLS
- 2003-10-26 Listing Removed — CRMLS
- 2003-04-26 Listed $89,000 CRMLS
- 2000-01-10 Listing Removed — CRMLS
- 1999-09-20 Listed $87,500 CRMLS
- 1999-09-01 Listing Removed — CRMLS
- 1999-06-10 Listing Removed — CRMLS
- 1999-02-03 Listed $18,500 CRMLS
- 1998-12-14 Listed $59,500 CRMLS
- 1998-10-10 Listing Removed — CRMLS
- 1998-05-26 Listing Removed — CRMLS
- 1998-05-13 Listing Removed — CRMLS
- 1998-01-12 Listing Removed — CRMLS
Cash-flow waterfall
monthlySold comps — $/sqft
last 12 mo · ≤1 miLoading sold comps…