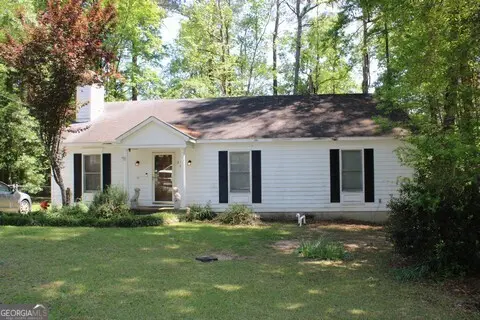
302 James Pl · Macon-Bibb County, GA
Flood risk 1/10 · Minimal
- FEMA flood zone
- X (unshaded)
- Chance of flooding over 30 yrs
- 0.0%
- Est. flood insurance / yr
- $507 – $1,088
Fire risk 3/10 · Minor
- Est. fire insurance / yr
- $963 – $1,789
Heat risk 7/10 · Major
- Hot days now (above 107°F)
- 7 days/yr
- Hot days in 30 yrs
- 18 days/yr
Wind risk 6/10 · Moderate
- Chance of severe wind over 30 yrs
- 68.0%
Air-quality risk 3/10 · Minor
- Unhealthy air days now
- 2 days/yr
- Unhealthy air days in 30 yrs
- 3 days/yr
Risk factors via First Street. Map © Google.
Why this score? — see what drove the C grade
The composite is a weighted blend of 9 inputs, each scored 0–100. Each bar is that input's sub-score; the figure is the points it added to the 100-point composite (weight × sub-score).
- Cash flow +24.7/30.0
- ARV discount +12.9/15.0
- DSCR +8.0/10.0
- 1% rule +5.8/10.0
- Livability +2.5/5.0
- Condition / age +2.5/5.0
- Rent growth +1.5/5.0
- Schools +1.2/10.0
- Appreciation +0.0/10.0
$155,000
🖨 Deal sheet (PDF) 📄 Offer letter ✓ Due diligence
Listing remarks MLS
One level living in a gated community with amenities galore! You do not want to miss this ranch style home located in a cul-de-sac in Lake Wildwood. Home off and offers fireplace, 3 bedrooms, 2 baths, and eat in kitchen. Fenced backyard for pets and children to play. Needs a little TLC but would be great for a starter home. Located in Lake Wildwood with clubhouse, playground, pool, and community lake!!!
Key facts
- Gated community
- Clubhouse
- Pool
Tags
Neighborhood map
What this means for you Summary
Snapshot
- This is a 3-bed/2.0-bath single-family listed at $155k.
Deal economics
- At list price, monthly cash flow is $324 ($4k/yr) — positive.
- The deal already cash-flows at list — no discount required.
- Meets the 1% rule at list price ($2k rent vs $155k).
- Recommended offer: $146k (6.0% below list) — sets the bar for market timing.
- Cap rate 8.8% vs local median 5.5% in Macon-Bibb County — top-decile yield for the area; either an underpriced asset or a hidden risk that comps aren't pricing in. Stress-test before assuming the spread holds.
Location & tenants
- Location reads: area grade C — affects rentability + tenant quality, not the cash-flow math above.
- Bibb County (urban): math 11% / reading 18% proficiency, ranked #161 of 174 in GA (top 92%) — low school quality limits family demand, transient renter base, plan for 1-2y turnover; 75% free/reduced lunch — lower-income household profile, screen leases tightly.
- Zoned schools: Heritage Elementary School (math 14% / reading 24%, grade F, #917 of 1,228 statewide, top 75%, 564 students, 100% FRL); Weaver Middle School (math 5% / reading 12%, grade F, #439 of 470 statewide, top 94%, 909 students, 100% FRL); Westside High School (math 2% / reading 2%, grade F, #421 of 424 statewide, top 100%, 1,025 students, 100% FRL) — zoned schools average 100% FRL vs 75% district-wide (25 pts higher); higher-poverty schools than district average — tighter screening recommended.
- Market conditions: Rents falling (-4.0%/yr); 129 active listings in the ZIP; 6 comparable units currently listed for rent nearby; rentals at typical pace (median 23d on market — plan ~3-4 weeks tenant-placement turnaround); solid renter incomes; 154 units permitted in Bibb County in 2024 (0 in 5+ unit buildings).
Forward outlook
- Local home prices are declining (-3.0%/yr); year-one equity from $1k of loan paydown is wiped out by about $5k of value loss. Plan a longer hold.
- Bibb County population projected at -12% by 2050 — secular population decline; favor cash flow + early exit over multi-decade hold.
Negotiation context
- It's been on market 72 days — a 6% lower offer ($146k) is reasonable based on typical stale-listing flexibility.
- 4 sale attempts since 15y ago; this cycle's ask has dropped $15k (9%) from the opening price — seller is motivated, your offer sets the floor, not the list.
- Current owner paid $79k; list at $155k implies a 96% gain — meaningful room to come down on a strong offer.
Risks & watch-outs
- Climate carrying-cost: major wind risk, 68% chance of damaging wind over 30y; extreme-heat days projected 7→18/yr by 2055 (HVAC capex compounding) — expect insurance premiums to compound above CPI over the hold.
Questions for the listing agent
- It's been on market 72 days. Have you received any prior offers? Is the seller open to a 6% concession, seller financing, or rate buy-down credit?
- Why hasn't it sold? Are there any deal-killer items the seller is aware of (foundation, flood, title, zoning, code violations)?
- Is there a deadline driving the sale (1031 exchange, divorce, estate, relocation)? That informs how much negotiation room exists.
- What's the average days-on-market for RENTAL listings here right now (not sales)? A rising rental-DOM trend means longer vacancies and softer asking-rent achievability than the comps imply.
- What's the recent tenant-quality profile in this submarket — average credit score on applications, eviction rate, late-payment / NSF rate, and stable-employment percentage? A property-management company in the area should have these aggregated.
- How much new for-sale + rental construction is in the pipeline within 1–3 miles? Heavy new supply typically softens prices + rents 12–24 months out; constrained supply supports both.
Investment metrics
- 1% rule
- 1.08% ✓
- Cap rate
- 8.80%
- Cash-on-cash
- 8.96%
- DSCR
- 1.40
- GRM
- 7.7
CMA / ARV
- ARV (median comp)
- $176,274
- List price
- $155,000
- Delta
- -12.07%
- Verdict
- UNDERPRICED
- Comps
- 20 within 1.0 mi
Show comp detail 12 sales within ~0.75 mi
| Address | Dist | Beds/Ba | Sqft | Sold | Price | $/sf | Match |
|---|---|---|---|---|---|---|---|
| 264 Dolly Madison Ct | 0.08mi | 3/2.5 | 1,611 (+7%) | 1mo | $220,000 | $137 | 81 |
| 283 Springview Dr | 0.34mi | 3/— | 1,516 (+1%) | 3mo | $65,000 | $43 | 80 |
| 283 Springview Dr | 0.34mi | 3/— | 1,516 (+1%) | 3mo | $65,000 | $43 | 80 |
| 221 Jefferson Cir | 0.20mi | 4/2.0 (+1) | 1,479 (-1%) | 5mo | $198,000 | $134 | 79 |
| 1225 Greentree Pkwy | 0.50mi | 3/2.0 | 1,506 (+0%) | 4mo | $175,000 | $116 | 72 |
| 589 Bristle Cone Dr | 0.53mi | 3/2.0 | 1,531 (+2%) | 4mo | $205,500 | $134 | 68 |
| 587 Lacebark Dr | 0.45mi | 3/2.0 | 1,564 (+4%) | 5mo | $195,000 | $125 | 67 |
| 755 N Confederate Dr | 0.22mi | 3/2.0 | 1,305 (-13%) | 6mo | $75,000 | $57 | 64 |
| 682 Wilderness Dr | 0.35mi | 3/2.0 | 1,329 (-11%) | 2mo | $135,000 | $102 | 63 |
| 1304 Greentree Pkwy | 0.62mi | 3/2.5 | 1,445 (-4%) | 4mo | $195,000 | $135 | 60 |
| 139 Ashford Trace Ln | 0.68mi | 3/2.0 | 1,675 (+12%) | 2mo | $249,500 | $149 | 47 |
| 1371 Greentree Pkwy | 0.72mi | 3/2.0 | 1,331 (-11%) | 5mo | $179,000 | $134 | 43 |
Match score weights: distance 35% · size 25% · config 20% · recency 20%. Top-matched comps best support the ARV.
Projected returns pro-forma
-3.0% appreciation · 0.0% rent growth · sell at horizon
- IRR
- -6.0%
- Equity multiple
- 0.78×
- Total profit
- $-9,404
- Equity at exit
- $23,111
- IRR
- -0.2%
- Equity multiple
- 0.99×
- Total profit
- $-631
- Equity at exit
- $13,402
Cash invested: $43,400 (down + closing). Projections, not guarantees.
Landlord ↔ Tenant lean methodology
- Overall (STATE)
- 90 Strongly Landlord-Friendly
- State Georgia
- 90 Strongly Landlord-Friendly · R+3
- County
- — inherits STATE
- City
- — inherits STATE
ZIP-level market 31220
- Home prices YoY
- -19.7%
- Rents YoY
- -4.0%
- Active inventory
- 129
- Price-to-rent
- 7.7×
Monthly cashflow live
- Estimated rent
- $1,671 high interval (Pro) →
- Mortgage (P&I)
- −$813
- Tax from tax record
- −$119 /mo · $1,422/yr
- Insurance
- −$65
- HOA
- −$0
- Vacancy / Maint / Mgmt
- −$351
- Net cashflow
- $324
Break-even live
Sensitivity live
| Price | -10% $412 | -5% $368 | +0% $324 | +5% $280 | +10% $236 |
|---|---|---|---|---|---|
| Rent | -10% $192 | -5% $258 | +0% $324 | +5% $390 | +10% $456 |
| Rate | -1.0pp $402 | -0.5pp $363 | base $324 | +0.5pp $284 | +1.0pp $243 |
UW: 25.0% down · 7.5% · 30yr · 1.5% tax · 5.0% vac · 8.0% maint · 8.0% mgmt
Financing live
Cash to close
- Down payment
- $38,750
- Closing costs
- $4,650
- Reserves months
- —
- Total cash needed
- —
Loan-product check · same deal, 3 products live
Conventional
25% down · 7.5% · 30yr
- Down + closing
- —
- Monthly P&I
- —
- Monthly cashflow
- —
- DSCR
- —
- Eligible?
- —
Personal DTI + credit; lowest rate.
DSCR
20% down · 8.5% · 30yr
- Down + closing
- —
- Monthly P&I
- —
- Monthly cashflow
- —
- DSCR
- —
- Eligible?
- —
No personal income docs; deal must DSCR.
Hard money
10% down · 12.0% · 12mo
- Down + closing
- —
- Monthly P&I
- —
- Monthly cashflow
- —
- DSCR
- —
- Eligible?
- —
Short-term bridge; refi at stabilization.
Rent comps 6 comps
| Address | Beds | Baths | Sqft | Rent | $/sqft | DOM | Units | Dist |
|---|---|---|---|---|---|---|---|---|
| 839 N Confederate Dr Macon, GA | 3.0 | 2.0 | 2187 | $1,700 | $0.78 | 23d | 1 | 0.20mi |
| 1100 Will Scarlet Way Macon, GA | 3.0 | 2.0 | 1212 | $1,475 | $1.22 | 23d | 1 | 0.49mi |
| 989 Will Scarlet Way Macon, GA | 3.0 | 3.0 | 2016 | $2,200 | $1.09 | 15d | 1 | 0.62mi |
| 6435 Zebulon Rd Macon, GA | 1.0–3.0 | 1.0–2.0 | 1093 | $1,475 | $1.35 | 15d | 29 | 0.63mi |
| 861 S Plantation Pkwy Macon, GA | 3.0 | 2.0 | 1232 | $1,500 | $1.22 | 23d | 1 | 0.68mi |
| 291 Plantation Centre Dr N Macon, GA | 1.0–3.0 | 1.0–2.0 | 1066 | $1,475 | $1.38 | 15d | 27 | 1.00mi |
Listing history 26 events
-
2026-06-21days on market $155,000 Active 72 DOM
-
2026-06-19days on market $155,000 Active 70 DOM
-
2026-06-18days on market $155,000 Active 69 DOM
-
2026-06-17days on market $155,000 Active 68 DOM
-
2026-06-16days on market $155,000 Active 67 DOM
-
2026-06-15days on market $155,000 Active 66 DOM
-
2026-06-14days on market $155,000 Active 64 DOM
-
2026-06-13days on market $155,000 Active 63 DOM
-
2026-06-10days on market $155,000 Active 61 DOM
-
2026-06-09days on market $155,000 Active 60 DOM
-
2026-06-09days on market $155,000 Active 59 DOM
-
2026-06-07days on market $155,000 Active 58 DOM
-
2026-06-03days on market $155,000 Active 54 DOM
-
2026-06-02days on market $155,000 Active 53 DOM
-
2026-06-01days on market $155,000 Active 52 DOM
-
2026-05-31days on market $155,000 Active 51 DOM
-
2026-05-30days on market $155,000 Active 50 DOM
-
2026-05-19price $155,000 406-char remark
Show marketing remark (406 chars)
One level living in a gated community with amenities galore! You do not want to miss this ranch style home located in a cul-de-sac in Lake Wildwood. Home off and offers fireplace, 3 bedrooms, 2 baths, and eat in kitchen. Fenced backyard for pets and children to play. Needs a little TLC but would be great for a starter home. Located in Lake Wildwood with clubhouse, playground, pool, and community lake!!!
-
2026-04-10$170,000 Active 406-char remark
Show marketing remark (406 chars)
One level living in a gated community with amenities galore! You do not want to miss this ranch style home located in a cul-de-sac in Lake Wildwood. Home off and offers fireplace, 3 bedrooms, 2 baths, and eat in kitchen. Fenced backyard for pets and children to play. Needs a little TLC but would be great for a starter home. Located in Lake Wildwood with clubhouse, playground, pool, and community lake!!!
-
2026-04-10$170,000 New 406-char remark
Show marketing remark (406 chars)
One level living in a gated community with amenities galore! You do not want to miss this ranch style home located in a cul-de-sac in Lake Wildwood. Home off and offers fireplace, 3 bedrooms, 2 baths, and eat in kitchen. Fenced backyard for pets and children to play. Needs a little TLC but would be great for a starter home. Located in Lake Wildwood with clubhouse, playground, pool, and community lake!!!
-
2018-02-16soldstatus $79,000
-
2017-10-08$82,000
-
2012-02-29historical
-
2011-08-29$89,900
-
2000-01-21soldstatus $72,000
ⓘ Source: listings_history table (triggers on properties + properties_extension) + one-shot
backfill from property_details.listing_events for pre-trigger history.
Tax reassessment forecast GA · Resets to sale price
- Current annual tax
- $1,422 · $119/mo
- Projected year-2 tax
- $1,426 · $119/mo
- Expected delta
- +$4/yr ($0/mo · 0.3%)
ⓘ Screening estimate from a state-policy table — verify with the county assessor before closing.
Climate risk First Street
- Flood 1/10 Low FEMA zone X (unshaded) · 0% chance over 30 yrs
- Wildfire 3/10 Moderate
- Heat 7/10 Severe 7 d/yr ≥107°F today · 18 d/yr by 30 yrs out
- Wind 6/10 Major 68% chance of damaging wind over 30 yrs
- Air quality 3/10 Moderate 2 unhealthy d/yr today · 3 by 30 yrs out
Nearby sold comps map
Loading sold comps map…
Walkable amenities ~0.75 mi
Loading nearby amenities…
Taxation est. · year 1
- Rental income
- $20,048
- − Mortgage interest
- −$8,682
- − Property taxes
- −$1,422
- − Insurance
- −$775
- − Repairs & maintenance
- −$1,604
- − Management
- −$1,604
- − Depreciation
- −$4,509
- Taxable income
- $1,452
- Est. tax owed @ 24.0%
- −$348
- After-tax cash flow
- $3,538/yr
For passive investors: Depreciation is non-cash, so a rental often shows a tax loss while cash-flowing — sheltering income. Rental losses are passive: they offset passive income freely, and up to $25,000/yr can offset ordinary (W-2) income if you actively participate and your MAGI is under $100k (phasing out to $0 by $150k); unused losses carry forward. On sale, claimed depreciation is recaptured at up to 25%, and gains may owe capital-gains tax (a 1031 exchange can defer both). Figures are a year-1 estimate at your 24.0% rate — not tax advice; consult a CPA.
Schools (NCES district)
- District
- Bibb County
- NCES district ID
- 1300420
- Math proficiency
- 11% ▼ -14.00%
- Reading proficiency
- 18% ▼ -11.00%
- Median HH income
- $37,426
- Composite
- 12.13/100
- National rank
- #9654
- State rank
- #161 of 174 in GA
Livability — Macon-Bibb County
No livability data for this city. (Only ~50 U.S. cities are tracked.)
Census & demographics
- Census place
- Macon-Bibb County, GA
- County
- Bibb County · 164,332 people
- City population
- 143,186
- Metro
- Macon-Bibb County, GA
- Population (ZIP)
- 16,494
- Household income
- $88,434
- Rent vs Own
- Severe rent burden
- 453.0
Population outlook (Bibb County) Hauer SSP2
- Today (2025)
- 148,772 people
- By 2030
- 145,904 · -1.9%
- By 2040
- 139,404 · -6.3%
- By 2050
- 131,603 · -11.5%
- By 2075
- 111,050 · -25.4%
- By 2100
- 83,346 · -44.0%
Race, ethnicity, and origin ACS 2023
- Neighborhood character
- Diverse neighborhood (Simpson 0.60)
- Race & ethnicity
- White 46% Black 43% Asian 5% Hispanic / Latino 3% Two or more races 3%
- Common ancestry
- Serbian 2% Slovak 2% Italian 1%
- Foreign-born
- 5% · South Korea, Canada
- Languages at home
- 94% English-only · Other Indo-European 2% Spanish 2% Korean 1%
Political lean MEDSL · Bibb
- 2024 margin
- Strong D (+22.4) · D 61.0% · R 38.5%
- 2008→2024 swing
- +4.4pp toward D · 2008: 18.0pp · 2024: 22.4pp
- All cycles
- 2024: D+22.4 2020: D+23.8 2016: D+20.2 2012: D+20.0 2008: D+18.0
Not yet ingested
- Civics
- —
Market trends
- HPI YoY
- ▼ -48.61%
- Current HPI
- 198.3399
- Rent YoY
- ▼ -4.04%
- Metro
- Macon-Bibb County, GA
- State GDP YoY
- ▲ 2.66%
- F500 in state
- 28
Industry mix (Fortune 500 HQ in GA)
| Industry | F500 HQs | Revenue |
|---|---|---|
| Paper / Packaging | 2 | $29B |
|
||
| Retail | 1 | $160B |
|
||
| Transportation / Logistics | 1 | $91B |
|
||
| Airlines | 1 | $62B |
|
||
| Consumer Goods | 1 | $47B |
|
||
| Utilities | 1 | $25B |
|
||
Price history
+115.3% since first listed9 events — show timeline
- 2026-05-19 Price Changed $155,000 MGMLS
- 2026-05-19 Price Changed $155,000 GAMLS
- 2026-04-10 Listed $170,000 MGMLS
- 2026-04-10 Listed $170,000 GAMLS
- 2018-02-16 Sold (MLS) $79,000 MGMLS
- 2017-10-08 Listed $82,000 MGMLS
- 2012-02-29 Listing Removed — GAMLS
- 2011-08-29 Listed $89,900 GAMLS
- 2000-01-21 Sold (Public Records) $72,000 Public Records
Property tax history
+10.9%/yrLatest (2025): $1,422 · -1.3% YoY. Source: county tax records.
Cash-flow waterfall
monthlySold comps — $/sqft
last 12 mo · ≤1 miLoading sold comps…