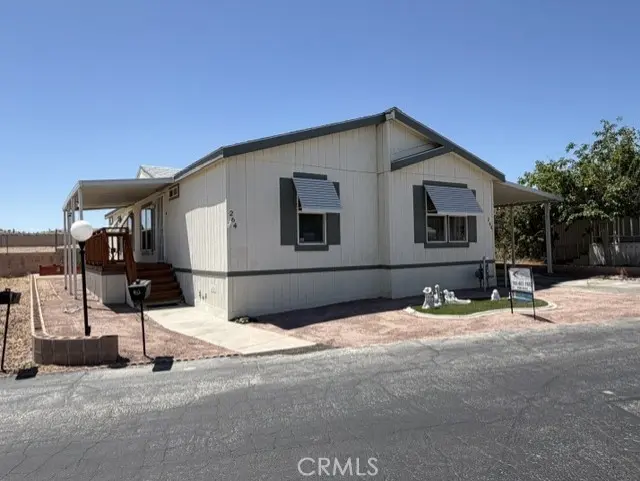
701 Montara Rd #264 · Barstow, CA
Flood risk 1/10 · Minimal
- FEMA flood zone
- X (unshaded)
- Chance of flooding over 30 yrs
- 0.0%
- Est. flood insurance / yr
- $507 – $1,088
Fire risk 4/10 · Minor
- Est. fire insurance / yr
- $659 – $1,223
Heat risk 8/10 · Major
- Hot days now (above 103°F)
- 6 days/yr
- Hot days in 30 yrs
- 17 days/yr
Wind risk 1/10 · Minimal
- Chance of severe wind over 30 yrs
- —
Air-quality risk 6/10 · Moderate
- Unhealthy air days now
- 11 days/yr
- Unhealthy air days in 30 yrs
- 15 days/yr
Risk factors via First Street. Map © Google.
Why this score? — see what drove the B- grade
The composite is a weighted blend of 9 inputs, each scored 0–100. Each bar is that input's sub-score; the figure is the points it added to the 100-point composite (weight × sub-score).
- Cash flow +30.0/30.0
- 1% rule +10.0/10.0
- DSCR +10.0/10.0
- ARV discount +7.5/15.0
- Livability +3.2/5.0
- Rent growth +3.1/5.0
- Condition / age +2.5/5.0
- Schools +1.4/10.0
- Appreciation +0.0/10.0
$85,000
🖨 Deal sheet 📄 Offer letter ✓ Due diligence
Listing remarks
Newer move in ready double wide mobile home in a senior park. This home is a 2003 build with 3 bedrooms, an office and 2 bathrooms. with 1520 sq ft of living space this is a rare find! The living room dining room is open concept with a large kitchen area and even a breakfast nook! This home is equipped with a wheel chair lift for easy handicapped access. You can sit on the sofa and see the sun rise in the morning or watch the birds on your beautiful front porch. This is a must see that will not last long.
Key facts
- Breakfast nook
- Front porch
- Wheel chair lift
Tags
Property features AI
Finance
- Other: Accessibility features: multiple access exits and disability features; Lot features: 0-1 unit/acre; Directions available
- Financial info: Monthly land lease of $550 (park)
- HOA & community: Senior community; Community features include biking, dog park, and nearby BLM/National Forest; Park name: Holiday Homes; Manager approval required
Exterior
- Parking: Carport (2 spaces)
- Utilities: Public sewer; District/public water
- Home design: Single-story; Mobile home (model: SUNPOINTE, mobile remains); Entry level: 1
- Construction: Year built source: Assessor; Mobile dimensions approximately 13 ft by 57 ft
- Exterior features: Community pool; One shed; East-facing
Interior
- Kitchen: Garbage disposal; Microwave; Refrigerator; Free standing gas range; Dishwasher; Gas water heater
- Bedrooms: All bedrooms on main level; Office
- Bathrooms: 2 full bathrooms; Walk-in shower; Bathtub
- Heating & cooling: Central furnace heating; Central air conditioning
- Interior features: Ceiling fan; Double pane windows; Front door entry
- Laundry & utility: Washer and dryer included; Washer hookup; Gas dryer hookup
Neighborhood map
What this means for you Summary
Snapshot
- This is a 3-bed/2.0-bath manufactured listed at $85k.
Deal economics
- At list price, monthly cash flow is $1k ($13k/yr) — positive.
- The deal already cash-flows at list — no discount required.
- Meets the 1% rule at list price ($2k rent vs $85k).
- Recommended offer: $84k (1.5% below list) — sets the bar for market timing.
- Cap rate 22.1% vs local median 4.6% in Barstow — top-decile yield for the area; either an underpriced asset or a hidden risk that comps aren't pricing in. Stress-test before assuming the spread holds.
Location & tenants
- Location reads 63/100 on livability (#444 in CA) — a middle-class / working-renter tenant base. Strengths: commute A+, housing A+; Watch: amenities C-, health & safety C-, schools F.
- Barstow Unified (town): math 11% / reading 22% proficiency, ranked #482 of 517 in CA (top 93%) — low school quality limits family demand, transient renter base, plan for 1-2y turnover; 68% free/reduced lunch — lower-income household profile, screen leases tightly.
- Market conditions: Rents rising (+2.3%/yr); 343 active listings in the ZIP; 5 comparable units currently listed for rent nearby; rentals at typical pace (median 25d on market — plan ~3-4 weeks tenant-placement turnaround); 40% of comp listings sitting > 30 days — soft ceiling on asking rent; 5,458 units permitted in San Bernardino County in 2024 (1,500 in 5+ unit buildings).
- This rent runs 42% of the median local income ($62k/yr) — at the standard rent-burdened threshold; future hikes will face affordability resistance.
Forward outlook
- Local home prices are declining (-3.0%/yr); year-one equity from $588 of loan paydown is wiped out by about $3k of value loss. Plan a longer hold.
- San Bernardino County population projected at +15% by 2050 — modest demand growth; plan on rents tracking national, not racing it.
- At projected returns (-3.0% appreciation + 2.3% rent growth), your $24k cash investment doubles in ~3 years — after that, you're playing with house money.
Negotiation context
- It's been on market 27 days — a 2% lower offer ($84k) is reasonable based on typical stale-listing flexibility.
- 2 sale attempts since 13y ago with the ask held roughly flat each time — persistent listings suggest the price (not the market) is what's stuck; bring a comps-based counter.
Risks & watch-outs
- Climate carrying-cost: extreme-heat days projected 6→17/yr by 2055 (HVAC capex compounding) — expect insurance premiums to compound above CPI over the hold.
Questions for the listing agent
- Is there a deadline driving the sale (1031 exchange, divorce, estate, relocation)? That informs how much negotiation room exists.
- Schools are F-rated, which usually means shorter tenancies and higher turnover. Who's the typical renter profile here, and what's been the actual vacancy rate?
- Crime grade is F in this area — have there been break-ins, vandalism, or insurance claims at this property in the last 3 years? What carrier currently insures it and at what premium?
- What's the average days-on-market for RENTAL listings here right now (not sales)? A rising rental-DOM trend means longer vacancies and softer asking-rent achievability than the comps imply.
- What's the recent tenant-quality profile in this submarket — average credit score on applications, eviction rate, late-payment / NSF rate, and stable-employment percentage? A property-management company in the area should have these aggregated.
- How much new for-sale + rental construction is in the pipeline within 1–3 miles? Heavy new supply typically softens prices + rents 12–24 months out; constrained supply supports both.
Investment metrics
- 1% rule
- 2.55% ✓
- Cap rate
- 22.15%
- Cash-on-cash
- 56.62%
- DSCR
- 3.52
- GRM
- 3.3
CMA / ARV
- ARV (on-the-fly)
- $43,200
- Comps found
- 12
Show comp detail 12 sales within ~0.75 mi
| Address | Dist | Beds/Ba | Sqft | Sold | Price | $/sf | Match |
|---|---|---|---|---|---|---|---|
| 701 Montara Rd #140 | 0.10mi | 3/2.0 | 1,456 (+1%) | 0mo | $44,000 | $30 | 93 |
| 701 Montara Rd #223 | 0.10mi | 2/2.0 (-1) | 1,440 (0%) | 1mo | $53,000 | $37 | 89 |
| 701 Montara Rd #207 | 0.10mi | 2/2.0 (-1) | 1,440 (0%) | 4mo | $44,603 | $31 | 87 |
| 701 Montara Rd #161 | 0.00mi | 2/2.0 (-1) | 1,344 (-7%) | 2mo | $13,000 | $10 | 82 |
| 701 Montara Rd #231 | 0.10mi | 2/2.0 (-1) | 1,440 (0%) | 10mo | $47,000 | $33 | 82 |
| 701 Montara Rd #123 | 0.10mi | 3/2.0 | 1,344 (-7%) | 4mo | $25,000 | $19 | 80 |
| 701 Montara Rd #244 | 0.26mi | 2/2.0 (-1) | 1,440 (0%) | 4mo | $28,000 | $19 | 80 |
| 701 Montara Rd #112 | 0.00mi | 2/2.0 (-1) | 1,346 (-6%) | 7mo | $38,000 | $28 | 78 |
| 701 Montara Rd #216 | 0.10mi | 2/2.0 (-1) | 1,440 (0%) | 15mo | $47,000 | $33 | 78 |
| 701 Montara Rd #235 | 0.10mi | 2/2.0 (-1) | 1,344 (-7%) | 2mo | $35,000 | $26 | 77 |
| 701 Montara Rd #137 | 0.10mi | 3/2.0 | 1,344 (-7%) | 13mo | $47,500 | $35 | 73 |
| 701 Montara #233 | 0.26mi | 2/2.0 (-1) | 1,512 (+5%) | 7mo | $39,000 | $26 | 69 |
Match score weights: distance 35% · size 25% · config 20% · recency 20%. Top-matched comps best support the ARV.
Projected returns pro-forma
-3.0% appreciation · 2.32% rent growth · sell at horizon
- IRR
- 54.3%
- Equity multiple
- 3.37×
- Total profit
- $56,308
- Equity at exit
- $12,674
- IRR
- 59.1%
- Equity multiple
- 6.68×
- Total profit
- $135,303
- Equity at exit
- $7,349
Cash invested: $23,800 (down + closing). Projections, not guarantees.
Landlord ↔ Tenant lean methodology
- Overall (STATE)
- 18 Strongly Tenant-Friendly
- State California
- 18 Strongly Tenant-Friendly · D+13
- County
- — inherits STATE
- City
- — inherits STATE
ZIP-level market 92311
- Home prices YoY
- -30.6%
- Rents YoY
- 2.3%
- Active inventory
- 343
- Price-to-rent
- 3.3×
Monthly cashflow live
- Estimated rent
- $2,165 high interval (Pro) →
- Mortgage (P&I)
- −$446
- Tax est. 1.5%
- −$106 /mo · $1,275/yr
- Insurance
- −$35
- HOA
- −$0
- Vacancy / Maint / Mgmt
- −$455
- Net cashflow
- $1,123
Break-even live
UW: 25.0% down · 7.5% · 30yr · 1.5% tax · 5.0% vac · 8.0% maint · 8.0% mgmt
Financing live
Cash to close
- Down payment
- $21,250
- Closing costs
- $2,550
- Reserves months
- —
- Total cash needed
- —
Loan-product check · same deal, 3 products live
Conventional
25% down · 7.5% · 30yr
- Down + closing
- —
- Monthly P&I
- —
- Monthly cashflow
- —
- DSCR
- —
- Eligible?
- —
Personal DTI + credit; lowest rate.
DSCR
20% down · 8.5% · 30yr
- Down + closing
- —
- Monthly P&I
- —
- Monthly cashflow
- —
- DSCR
- —
- Eligible?
- —
No personal income docs; deal must DSCR.
Hard money
10% down · 12.0% · 12mo
- Down + closing
- —
- Monthly P&I
- —
- Monthly cashflow
- —
- DSCR
- —
- Eligible?
- —
Short-term bridge; refi at stabilization.
Rent comps 5 comps
| Address | Beds | Baths | Sqft | Rent | $/sqft | DOM | Units | Dist |
|---|---|---|---|---|---|---|---|---|
| 800 Arbor Way Barstow, CA | 3.0 | 2.0 | 1000 | $2,500 | $2.50 | 24d | 1 | 0.05mi |
| 1801 Rimrock Rd Barstow, CA | 1.0–2.0 | 1.0–2.0 | 775 | $1,810 | $2.34 | 2d | 6 | 0.40mi |
| 332 Date Ave Barstow, CA | 4.0 | 2.0 | 1144 | $1,950 | $1.70 | 44d | 1 | 0.91mi |
| 936 Pinon Dr Barstow, CA | 4.0 | 2.0 | 1762 | $2,400 | $1.36 | 24d | 1 | 1.30mi |
| 810 Starlight St Barstow, CA | 3.0 | 2.0 | 1430 | $1,895 | $1.33 | 44d | 1 | 1.49mi |
Listing history 17 events
-
2026-06-18days on market $85,000 Active 27 DOM
-
2026-06-17days on market $85,000 Active 26 DOM
-
2026-06-16days on market $85,000 Active 25 DOM
-
2026-06-15days on market $85,000 Active 24 DOM
-
2026-06-13days on market $85,000 Active 22 DOM
-
2026-06-13days on market $85,000 Active 21 DOM
-
2026-06-09days on market $85,000 Active 18 DOM
-
2026-06-08days on market $85,000 Active 17 DOM
-
2026-06-07days on market $85,000 Active 16 DOM
-
2026-06-04days on market $85,000 Active 13 DOM
-
2026-06-03days on market $85,000 Active 12 DOM
-
2026-06-02days on market $85,000 Active 11 DOM
-
2026-06-01days on market $85,000 Active 10 DOM
-
2026-05-31days on market $85,000 Active 9 DOM
-
2026-05-22$85,000 Active
-
2013-10-30historical
-
2013-08-06$15,500
ⓘ Source: listings_history table (triggers on properties + properties_extension) + one-shot
backfill from property_details.listing_events for pre-trigger history.
Climate risk First Street
- Flood 1/10 Low FEMA zone X (unshaded) · 0% chance over 30 yrs
- Wildfire 4/10 Moderate
- Heat 8/10 Severe 6 d/yr ≥103°F today · 17 d/yr by 30 yrs out
- Wind 1/10 Low
- Air quality 6/10 Major 11 unhealthy d/yr today · 15 by 30 yrs out
Nearby sold comps map
Loading sold comps map…
Walkable amenities ~0.75 mi
Loading nearby amenities…
Taxation est. · year 1
- Rental income
- $25,980
- − Mortgage interest
- −$4,761
- − Property taxes
- −$1,275
- − Insurance
- −$425
- − Repairs & maintenance
- −$2,078
- − Management
- −$2,078
- − Depreciation
- −$2,473
- Taxable income
- $12,889
- Est. tax owed @ 24.0%
- −$3,093
- After-tax cash flow
- $10,382/yr
For passive investors: Depreciation is non-cash, so a rental often shows a tax loss while cash-flowing — sheltering income. Rental losses are passive: they offset passive income freely, and up to $25,000/yr can offset ordinary (W-2) income if you actively participate and your MAGI is under $100k (phasing out to $0 by $150k); unused losses carry forward. On sale, claimed depreciation is recaptured at up to 25%, and gains may owe capital-gains tax (a 1031 exchange can defer both). Figures are a year-1 estimate at your 24.0% rate — not tax advice; consult a CPA.
Schools (NCES district)
- District
- Barstow Unified
- NCES district ID
- 0604020
- Math proficiency
- 11% ▼ -7.00%
- Reading proficiency
- 22% ▼ -7.00%
- Median HH income
- $44,505
- Composite
- 14.44/100
- National rank
- #9430
- State rank
- #482 of 517 in CA
Livability — Barstow
- Score
- 63/100
- State rank
- #444
- US rank
- #15099
Category grades
Schools grade is shown separately in the Schools card above.
Census & demographics
- Census place
- Barstow, CA
- County
- San Bernardino County · 2,030,291 people
- City population
- 33,954
- Metro
- Riverside-San Bernardino-Ontario, CA
- Population (ZIP)
- 33,954
- Household income
- $61,862
- Rent vs Own
- Severe rent burden
- 1305.0
Population outlook (San Bernardino County) Hauer SSP2
- Today (2025)
- 2,300,329 people
- By 2030
- 2,378,907 · +3.4%
- By 2040
- 2,523,137 · +9.7%
- By 2050
- 2,642,388 · +14.9%
- By 2075
- 2,880,769 · +25.2%
- By 2100
- 2,909,436 · +26.5%
Race, ethnicity, and origin ACS 2023
- Neighborhood character
- Diverse neighborhood (Simpson 0.68)
- Race & ethnicity
- Hispanic / Latino 46% White 29% Two or more races 22% Black 15% Native American 3% Asian 2% Pacific Islander 1%
- Hispanic origin (detail)
- Mexican 39% Puerto Rican 2%
- Common ancestry
- Portuguese 1% Lithuanian 1% Italian 1%
- Foreign-born
- 9% · Canada, South Korea
- Languages at home
- 77% English-only · Spanish 20% Tagalog/Filipino 1% Other Indo-European 1%
Political lean MEDSL · San Bernardino
- 2024 margin
- Toss-up / Even · D 47.5% · R 49.7% · Other 2.8%
- 2008→2024 swing
- -8.5pp toward R · 2008: 6.3pp · 2024: -2.1pp
- All cycles
- 2024: R+2.1 2020: D+10.7 2016: D+9.8 2012: D+5.4 2008: D+6.3
Not yet ingested
- Civics
- —
Market trends
- HPI YoY
- ▼ -139.26%
- Current HPI
- 316.4858
- Rent YoY
- ▲ 2.32%
- Metro
- Riverside-San Bernardino-Ontario, CA
- State GDP YoY
- ▲ 3.21%
- F500 in state
- 116
Industry mix (Fortune 500 HQ in CA)
| Industry | F500 HQs | Revenue |
|---|---|---|
| Technology | 27 | $1,492B |
|
||
| Financial Services | 3 | $174B |
|
||
| Retail | 3 | $44B |
|
||
| Insurance | 3 | $26B |
|
||
| Media / Entertainment | 2 | $115B |
|
||
| Pharmaceuticals / Biotech | 2 | $62B |
|
||
Price history
+448.4% since first listed3 events — show timeline
- 2026-05-22 Listed $85,000 CRMLS
- 2013-10-30 Listing Removed — CRMLS
- 2013-08-06 Listed $15,500 CRMLS
Property tax history
-9.0%/yrLatest (2014): $110 · -46.3% YoY. Source: county tax records.
Cash-flow waterfall
monthlySold comps — $/sqft
last 12 mo · ≤1 miLoading sold comps…