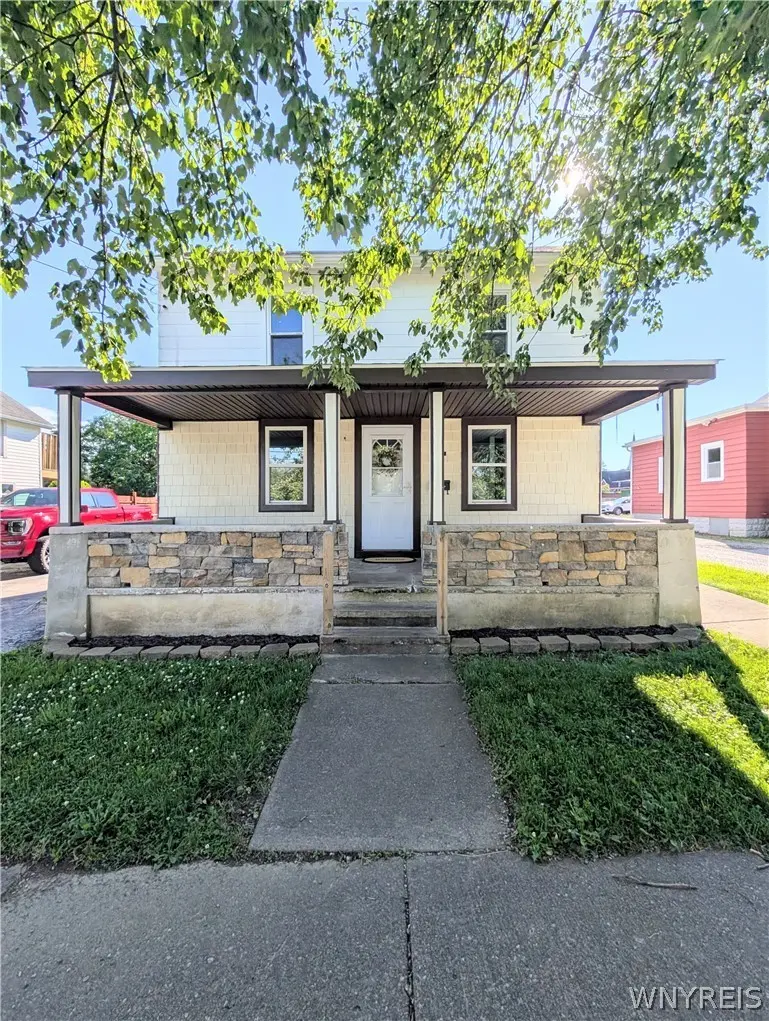
29 Prospect St · Fredonia, NY
Flood risk 1/10 · Minimal
- FEMA flood zone
- X
- Chance of flooding over 30 yrs
- 0.0%
- Est. flood insurance / yr
- $473 – $860
Fire risk 1/10 · Minimal
- Est. fire insurance / yr
- $691 – $1,283
Heat risk 2/10 · Minimal
- Hot days now (above 94°F)
- 7 days/yr
- Hot days in 30 yrs
- 17 days/yr
Wind risk 1/10 · Minimal
- Chance of severe wind over 30 yrs
- —
Air-quality risk 2/10 · Minimal
- Unhealthy air days now
- 1 days/yr
- Unhealthy air days in 30 yrs
- 2 days/yr
Risk factors via First Street. Map © Google.
Why this score? — see what drove the C grade
The composite is a weighted blend of 9 inputs, each scored 0–100. Each bar is that input's sub-score; the figure is the points it added to the 100-point composite (weight × sub-score).
- Cash flow +21.6/30.0
- ARV discount +9.7/15.0
- DSCR +6.9/10.0
- 1% rule +5.8/10.0
- Schools +4.3/10.0
- Livability +4.0/5.0
- Rent growth +2.5/5.0
- Condition / age +2.5/5.0
- Appreciation +0.0/10.0
$149,900
🖨 Deal sheet 📄 Offer letter ✓ Due diligence
Listing remarks MLS
3 bedroom home in the Village of Fredonia. Newer kitchen, basement; covered porch. Nice centralized location walking distance to downtown Village center. Prior owners have done some recent remodeling.
Key facts
- Brand-new carpeting
- Double closets
- New roof
Tags
Property features AI
Exterior
- Parking: No garage
- Utilities: Electricity connected (circuit breakers); High-speed internet available; Public water connected; Sewer connected
- Home design: 2 stories; Existing condition; Asphalt roof; Composite siding, stone, and vinyl siding exterior
- Construction: Block foundation
- Exterior features: Blacktop driveway; Near public transit; Rectangular residential lot (approx. 52 x 116)
Interior
- Kitchen: Free-standing range; Gas oven; Gas range; Oven
- Bedrooms: Bedroom 1 — Second level (approx. 17 x 15); Bedroom 2 — Second level (approx. 15 x 7); Bedroom 3 — Second level (approx. 15 x 7)
- Flooring: Carpet; Tile; Vinyl; Varies
- Bathrooms: 2 full bathrooms (1 on the main level)
- Heating & cooling: Gas forced-air heating
- Interior features: Entrance foyer; Eat-in kitchen; Separate/formal living room; Has basement (partial, crawl space with dirt floor)
- Laundry & utility: Main level laundry
Neighborhood map
What this means for you Summary
Snapshot
- This is a 4-bed/2.0-bath single-family listed at $150k.
Deal economics
- At list price, monthly cash flow is $229 ($3k/yr) — positive.
- The deal already cash-flows at list — no discount required.
- Meets the 1% rule at list price ($2k rent vs $150k).
- Cap rate 8.1% vs local median 3.4% in Fredonia — top-decile yield for the area; either an underpriced asset or a hidden risk that comps aren't pricing in. Stress-test before assuming the spread holds.
Location & tenants
- Location reads 81/100 on livability (#95 in NY, #1,446 nationally) — a professional / high-income tenant draw. Strengths: housing A+, health & safety A+, commute A; Watch: amenities C-, employment C-, crime F.
- Fredonia Central School District (town): math 55% / reading 46% proficiency, ranked #376 of 590 in NY (top 64%) — acceptable for families but not a draw, mixed tenant base, ~2y average lease.
- Market conditions: 90 active listings in the ZIP; 127 units permitted in Chautauqua County in 2024 (0 in 5+ unit buildings).
Forward outlook
- Local home prices are declining (-3.0%/yr); year-one equity from $1k of loan paydown is wiped out by about $4k of value loss. Plan a longer hold.
- Chautauqua County population projected at -22% by 2050 — secular population decline; favor cash flow + early exit over multi-decade hold.
Negotiation context
- Only 2 days on market — expect competitive offers; lowballing is unlikely to land.
- 5 sale attempts since 21y ago with the ask held roughly flat each time — persistent listings suggest the price (not the market) is what's stuck; bring a comps-based counter.
- Current owner paid $40k; list at $150k implies a 270% gain — meaningful room to come down on a strong offer.
Risks & watch-outs
- Watch-outs: built in 1897 — expect roof / HVAC / electrical / plumbing capex.
Questions for the listing agent
- Built in 1897 — when were the roof, HVAC, electrical panel, plumbing, and water heater last replaced?
- Is there a deadline driving the sale (1031 exchange, divorce, estate, relocation)? That informs how much negotiation room exists.
- Schools are A-rated — typically a magnet for longer-tenancy family renters. What's the average tenant stay here, and is there a school-zone premium baked into asking?
- Crime grade is F in this area — have there been break-ins, vandalism, or insurance claims at this property in the last 3 years? What carrier currently insures it and at what premium?
- What's the average days-on-market for RENTAL listings here right now (not sales)? A rising rental-DOM trend means longer vacancies and softer asking-rent achievability than the comps imply.
- What's the recent tenant-quality profile in this submarket — average credit score on applications, eviction rate, late-payment / NSF rate, and stable-employment percentage? A property-management company in the area should have these aggregated.
- How much new for-sale + rental construction is in the pipeline within 1–3 miles? Heavy new supply typically softens prices + rents 12–24 months out; constrained supply supports both.
Investment metrics
- 1% rule
- 1.08% ✓
- Cap rate
- 8.13%
- Cash-on-cash
- 6.54%
- DSCR
- 1.29
- GRM
- 7.7
CMA / ARV
- ARV (on-the-fly)
- $157,440
- Comps found
- 10
Show comp detail 10 sales within ~0.75 mi
| Address | Dist | Beds/Ba | Sqft | Sold | Price | $/sf | Match |
|---|---|---|---|---|---|---|---|
| 35 Lambert Ave | 0.46mi | 4/1.5 | 1,260 (-2%) | 9mo | $155,000 | $123 | 66 |
| 147 Lambert Ave | 0.48mi | 3/1.0 (-1) | 1,232 (-4%) | 6mo | $152,000 | $123 | 57 |
| 9 Ahrens Pl | 0.48mi | 3/2.5 (-1) | 1,345 (+5%) | 13mo | $163,000 | $121 | 52 |
| 69 Cottage St Unit S | 0.58mi | 3/1.5 (-1) | 1,232 (-4%) | 10mo | $225,000 | $183 | 51 |
| 20 Eagle St | 0.38mi | 4/1.0 | 1,436 (+12%) | 9mo | $90,000 | $63 | 50 |
| 10 Georges Pl | 0.74mi | 4/1.5 | 1,404 (+10%) | 8mo | $228,000 | $162 | 40 |
| 19 James Pl | 0.50mi | 3/2.0 (-1) | 1,410 (+10%) | 19mo | $167,500 | $119 | 39 |
| 86 Liberty St | 0.53mi | 3/1.5 (-1) | 1,472 (+15%) | 10mo | $165,500 | $112 | 35 |
| 46 Holmes Pl | 0.65mi | 3/2.0 (-1) | 1,200 (-6%) | 24mo | $184,900 | $154 | 35 |
| 36 Lowell Pl | 0.70mi | 3/2.0 (-1) | 1,472 (+15%) | 19mo | $360,000 | $245 | 22 |
Match score weights: distance 35% · size 25% · config 20% · recency 20%. Top-matched comps best support the ARV.
Projected returns pro-forma
-3.0% appreciation · 3.0% rent growth · sell at horizon
- IRR
- -6.2%
- Equity multiple
- 0.77×
- Total profit
- $-9,682
- Equity at exit
- $22,351
- IRR
- 3.4%
- Equity multiple
- 1.25×
- Total profit
- $10,463
- Equity at exit
- $12,961
Cash invested: $41,972 (down + closing). Projections, not guarantees.
Landlord ↔ Tenant lean methodology
- Overall (STATE)
- 15 Strongly Tenant-Friendly
- State New York
- 15 Strongly Tenant-Friendly · D+10
- County
- — inherits STATE
- City
- — inherits STATE
ZIP-level market 14063
- Home prices YoY
- -23.6%
- Active inventory
- 90
- Price-to-rent
- 7.7×
Monthly cashflow live
- Estimated rent
- $1,614 medium interval (Pro) →
- Mortgage (P&I)
- −$786
- Tax from tax record
- −$198 /mo · $2,371/yr
- Insurance
- −$62
- HOA
- −$0
- Vacancy / Maint / Mgmt
- −$339
- Net cashflow
- $229
Break-even live
UW: 25.0% down · 7.5% · 30yr · 1.5% tax · 5.0% vac · 8.0% maint · 8.0% mgmt
Financing live
Cash to close
- Down payment
- $37,475
- Closing costs
- $4,497
- Reserves months
- —
- Total cash needed
- —
Loan-product check · same deal, 3 products live
Conventional
25% down · 7.5% · 30yr
- Down + closing
- —
- Monthly P&I
- —
- Monthly cashflow
- —
- DSCR
- —
- Eligible?
- —
Personal DTI + credit; lowest rate.
DSCR
20% down · 8.5% · 30yr
- Down + closing
- —
- Monthly P&I
- —
- Monthly cashflow
- —
- DSCR
- —
- Eligible?
- —
No personal income docs; deal must DSCR.
Hard money
10% down · 12.0% · 12mo
- Down + closing
- —
- Monthly P&I
- —
- Monthly cashflow
- —
- DSCR
- —
- Eligible?
- —
Short-term bridge; refi at stabilization.
Listing history 3 events
-
2026-06-18days on market $149,900 Active 2 DOM
-
2026-06-17remarks 699-char remark
-
2026-06-17$149,900 Active 1 DOM
ⓘ Source: listings_history table (triggers on properties + properties_extension) + one-shot
backfill from property_details.listing_events for pre-trigger history.
Tax reassessment forecast NY · Partial reset (capped growth)
- Current annual tax
- $2,371 · $198/mo
- Projected year-2 tax
- $2,452 · $204/mo
- Expected delta
- +$81/yr (+$7/mo · 3.4%)
ⓘ Screening estimate from a state-policy table — verify with the county assessor before closing.
Climate risk First Street
- Flood 1/10 Low FEMA zone X · 0% chance over 30 yrs
- Wildfire 1/10 Low
- Heat 2/10 Low 7 d/yr ≥94°F today · 17 d/yr by 30 yrs out
- Wind 1/10 Low
- Air quality 2/10 Low 1 unhealthy d/yr today · 2 by 30 yrs out
Nearby sold comps map
Loading sold comps map…
Walkable amenities ~0.75 mi
Loading nearby amenities…
Taxation est. · year 1
- Rental income
- $19,367
- − Mortgage interest
- −$8,397
- − Property taxes
- −$2,371
- − Insurance
- −$750
- − Repairs & maintenance
- −$1,549
- − Management
- −$1,549
- − Depreciation
- −$4,361
- Taxable income
- $390
- Est. tax owed @ 24.0%
- −$94
- After-tax cash flow
- $2,653/yr
For passive investors: Depreciation is non-cash, so a rental often shows a tax loss while cash-flowing — sheltering income. Rental losses are passive: they offset passive income freely, and up to $25,000/yr can offset ordinary (W-2) income if you actively participate and your MAGI is under $100k (phasing out to $0 by $150k); unused losses carry forward. On sale, claimed depreciation is recaptured at up to 25%, and gains may owe capital-gains tax (a 1031 exchange can defer both). Figures are a year-1 estimate at your 24.0% rate — not tax advice; consult a CPA.
Schools (NCES district)
- District
- Fredonia Central School District
- NCES district ID
- 3611520
- Math proficiency
- 55% ▼ -8.00%
- Reading proficiency
- 46% ▼ -8.00%
- Median HH income
- $48,491
- Composite
- 43.1/100
- National rank
- #3086
- State rank
- #376 of 590 in NY
Livability — Fredonia
- Score
- 81/100
- State rank
- #95
- US rank
- #1446
Category grades
Schools grade is shown separately in the Schools card above.
Census & demographics
- Census place
- Fredonia, NY
- Population (ZIP)
- 12,722
Population outlook (Chautauqua County) Hauer SSP2
- Today (2025)
- 123,454 people
- By 2030
- 118,509 · -4.0%
- By 2040
- 107,311 · -13.1%
- By 2050
- 96,703 · -21.7%
- By 2075
- 76,757 · -37.8%
- By 2100
- 60,984 · -50.6%
Race, ethnicity, and origin ACS 2023
- Neighborhood character
- Predominantly White (83%)
- Race & ethnicity
- White 83% Hispanic / Latino 8% Two or more races 5% Black 3% Asian 2%
- Hispanic origin (detail)
- Puerto Rican 5%
- Common ancestry
- Romanian 14% Italian 3% Iranian 1%
- Foreign-born
- 4% · Canada, China
- Languages at home
- 92% English-only · Spanish 5% Chinese 1% Other Indo-European 1%
Political lean MEDSL · Chautauqua
- 2024 margin
- Strong R (+22.0) · D 39.0% · R 61.0%
- 2008→2024 swing
- -22.9pp toward R · 2008: 0.9pp · 2024: -22.0pp
- All cycles
- 2024: R+22.0 2020: R+19.8 2016: R+24.6 2012: R+8.2 2008: D+0.9
Not yet ingested
- Civics
- —
Market trends
- HPI YoY
- ▼ -78.55%
- Current HPI
- 253.5334
- Rent YoY
- —
- Metro
- —
- State GDP YoY
- ▲ 2.60%
- F500 in state
- 92
Industry mix (Fortune 500 HQ in NY)
| Industry | F500 HQs | Revenue |
|---|---|---|
| Financial Services | 10 | $950B |
|
||
| Consumer Goods | 9 | $162B |
|
||
| Insurance | 4 | $225B |
|
||
| Telecommunications | 2 | $144B |
|
||
| Pharmaceuticals | 2 | $112B |
|
||
| Media / Entertainment | 2 | $69B |
|
||
Price history
+275.7% since first listed9 events — show timeline
- 2026-06-16 Listed $149,900 WNYREIS
- 2025-08-15 Listed $139,900 WNYREIS
- 2015-11-11 Sold (MLS) $40,500 UNYREIS
- 2015-09-22 Listed $27,500 UNYREIS
- 2012-03-22 Listed $55,900 UNYREIS
- 2006-04-06 Sold (MLS) $56,000 UNYREIS
- 2005-08-01 Listed $64,500 UNYREIS
- 1997-09-29 Sold (Public Records) $54,500 Public Records
- 1990-01-12 Sold (Public Records) $39,900 Public Records
Property tax history
+2.3%/yrLatest (2025): $2,371 · +11.2% YoY. Source: county tax records.
Cash-flow waterfall
monthlySold comps — $/sqft
last 12 mo · ≤1 miLoading sold comps…