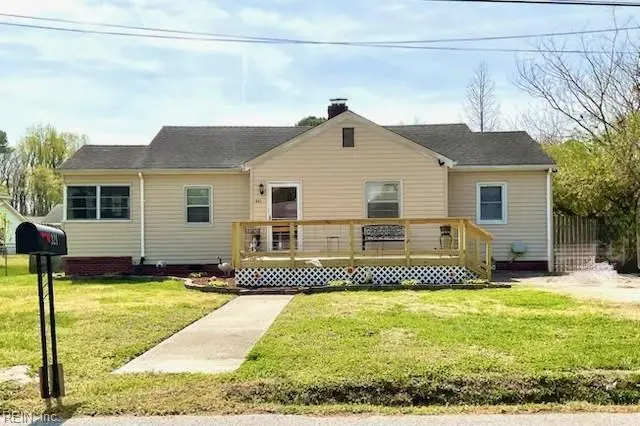
321 Bruce St · Suffolk, VA
Flood risk 1/10 · Minimal
- FEMA flood zone
- X (unshaded)
- Chance of flooding over 30 yrs
- 0.0%
- Est. flood insurance / yr
- $507 – $1,088
Fire risk 2/10 · Minimal
- Est. fire insurance / yr
- $666 – $1,236
Heat risk 9/10 · Severe
- Hot days now (above 107°F)
- 7 days/yr
- Hot days in 30 yrs
- 16 days/yr
Wind risk 8/10 · Major
- Chance of severe wind over 30 yrs
- 80.0%
Air-quality risk 2/10 · Minimal
- Unhealthy air days now
- 0 days/yr
- Unhealthy air days in 30 yrs
- 1 days/yr
Risk factors via First Street. Map © Google.
Why this score? — see what drove the D+ grade
The composite is a weighted blend of 9 inputs, each scored 0–100. Each bar is that input's sub-score; the figure is the points it added to the 100-point composite (weight × sub-score).
- ARV discount +14.1/15.0
- Cash flow +12.8/30.0
- Schools +4.8/10.0
- Rent growth +4.0/5.0
- Livability +3.9/5.0
- DSCR +3.8/10.0
- 1% rule +2.9/10.0
- Condition / age +2.5/5.0
- Appreciation +0.0/10.0
$240,000
🖨 Deal sheet 📄 Offer letter ✓ Due diligence
Listing remarks MLS
Charming 2 BR 1 BA home in family friendly quiet neighborhood. Brand new front porch, HVAC 2-3 years old, tankless hot water heater and LVP throughout! Convenient location to interstate, Naval base and the Hampton Roads area.
Key facts
- Hvac
- Front porch
- Lvp
Tags
Neighborhood map
What this means for you Summary
Snapshot
- This is a 2-bed/1.0-bath single-family listed at $240k.
Deal economics
- At list price, monthly cash flow is $-22 ($-268/yr) — negative.
- To cash-flow at today's rent, offer at most $236k (1.6% below list).
- To meet the 1% rule (rent ≥ 1% of price), the offer needs to be $190k (20.8% below list).
- Recommended offer: $190k (20.8% below list) — sets the bar for 1% rule.
- Cap rate 6.2% vs local median 3.5% in Suffolk — top-decile yield for the area; either an underpriced asset or a hidden risk that comps aren't pricing in. Stress-test before assuming the spread holds.
Location & tenants
- Location reads 77/100 on livability (#88 in VA, #2,896 nationally) — a middle-class / working-renter tenant base. Strengths: housing A+, health & safety A+, schools A; Watch: crime C-, commute F.
- Suffolk City Public School District (suburban): math 41% / reading 69% proficiency, ranked #72 of 131 in VA (top 55%) — acceptable for families but not a draw, mixed tenant base, ~2y average lease.
- Market conditions: Rents rising fast (+5.8%/yr); 536 active listings in the ZIP; 8 comparable units currently listed for rent nearby; rentals at typical pace (median 24d on market — plan ~3-4 weeks tenant-placement turnaround); solid renter incomes; 680 units permitted in Suffolk city in 2024 (0 in 5+ unit buildings).
Forward outlook
- Local home prices are declining (-3.0%/yr); year-one equity from $2k of loan paydown is wiped out by about $7k of value loss. Plan a longer hold.
- Suffolk County population projected at +11% by 2050 — modest demand growth; plan on rents tracking national, not racing it.
Negotiation context
- It's been on market 43 days — a 3% lower offer ($233k) is reasonable based on typical stale-listing flexibility.
- 9 sale attempts since 11y ago with the ask held roughly flat each time — persistent listings suggest the price (not the market) is what's stuck; bring a comps-based counter.
- Current owner paid $142k; list at $240k implies a 70% gain — meaningful room to come down on a strong offer.
Risks & watch-outs
- Watch-outs: built in 1954 — expect roof / HVAC / electrical / plumbing capex.
- Climate carrying-cost: severe wind risk, 80% chance of damaging wind over 30y; extreme-heat days projected 7→16/yr by 2055 (HVAC capex compounding) — expect insurance premiums to compound above CPI over the hold.
Questions for the listing agent
- What do current leases actually rent for vs. the listed asking? Can we see a recent rent roll and the last 12 months of T-12 income?
- It's been on market 43 days. Have you received any prior offers? Is the seller open to a 21% concession, seller financing, or rate buy-down credit?
- Built in 1954 — when were the roof, HVAC, electrical panel, plumbing, and water heater last replaced?
- Is there a deadline driving the sale (1031 exchange, divorce, estate, relocation)? That informs how much negotiation room exists.
- Schools are A-rated — typically a magnet for longer-tenancy family renters. What's the average tenant stay here, and is there a school-zone premium baked into asking?
- The area grade is low — what's the realistic commute time and amenity access for the typical tenant pool here? Any planned neighborhood developments (good or bad) we should know about?
- What's the average days-on-market for RENTAL listings here right now (not sales)? A rising rental-DOM trend means longer vacancies and softer asking-rent achievability than the comps imply.
- What's the recent tenant-quality profile in this submarket — average credit score on applications, eviction rate, late-payment / NSF rate, and stable-employment percentage? A property-management company in the area should have these aggregated.
- How much new for-sale + rental construction is in the pipeline within 1–3 miles? Heavy new supply typically softens prices + rents 12–24 months out; constrained supply supports both.
Investment metrics
- 1% rule
- 0.79% ✗
- Cap rate
- 6.18%
- Cash-on-cash
- -0.40%
- DSCR
- 0.98
- GRM
- 10.5
CMA / ARV
- ARV (median comp)
- $280,958
- List price
- $240,000
- Delta
- -14.58%
- Verdict
- UNDERPRICED
- Comps
- 20 within 1.0 mi
Show comp detail 5 sales within ~0.75 mi
| Address | Dist | Beds/Ba | Sqft | Sold | Price | $/sf | Match |
|---|---|---|---|---|---|---|---|
| 321 Bruce St | 0.00mi | 2/1.0 | 1,229 (+13%) | 1mo | $242,500 | $197 | 77 |
| 1158 Beaton St | 0.06mi | 3/1.0 (+1) | 1,153 (+6%) | 13mo | $281,000 | $244 | 71 |
| 1324 Wilroy Rd | 0.36mi | 3/1.0 (+1) | 1,134 (+4%) | 8mo | $156,000 | $138 | 65 |
| 705 Hollywood Ave | 0.74mi | 3/2.0 (+1) | 1,020 (-6%) | 8mo | $252,000 | $247 | 40 |
| 2214 Florida Ave | 0.70mi | 3/2.0 (+1) | 984 (-9%) | 10mo | $195,000 | $198 | 34 |
Match score weights: distance 35% · size 25% · config 20% · recency 20%. Top-matched comps best support the ARV.
Projected returns pro-forma
-3.0% appreciation · 5.84% rent growth · sell at horizon
- IRR
- -14.1%
- Equity multiple
- 0.48×
- Total profit
- $-34,780
- Equity at exit
- $35,785
- IRR
- -1.6%
- Equity multiple
- 0.88×
- Total profit
- $-8,040
- Equity at exit
- $20,751
Cash invested: $67,200 (down + closing). Projections, not guarantees.
Landlord ↔ Tenant lean methodology
- Overall (STATE)
- 55 Moderately Landlord-Leaning
- State Virginia
- 55 Moderately Landlord-Leaning · D+2
- County
- — inherits STATE
- City
- — inherits STATE
ZIP-level market 23434
- Rents YoY
- 5.8%
- Active inventory
- 536
- Price-to-rent
- 10.5×
Monthly cashflow live
- Estimated rent
- $1,901 high interval (Pro) →
- Mortgage (P&I)
- −$1,259
- Tax from tax record
- −$165 /mo · $1,983/yr
- Insurance
- −$100
- HOA
- −$0
- Vacancy / Maint / Mgmt
- −$399
- Net cashflow
- $-22
Break-even live
UW: 25.0% down · 7.5% · 30yr · 1.5% tax · 5.0% vac · 8.0% maint · 8.0% mgmt
Financing live
Cash to close
- Down payment
- $60,000
- Closing costs
- $7,200
- Reserves months
- —
- Total cash needed
- —
Loan-product check · same deal, 3 products live
Conventional
25% down · 7.5% · 30yr
- Down + closing
- —
- Monthly P&I
- —
- Monthly cashflow
- —
- DSCR
- —
- Eligible?
- —
Personal DTI + credit; lowest rate.
DSCR
20% down · 8.5% · 30yr
- Down + closing
- —
- Monthly P&I
- —
- Monthly cashflow
- —
- DSCR
- —
- Eligible?
- —
No personal income docs; deal must DSCR.
Hard money
10% down · 12.0% · 12mo
- Down + closing
- —
- Monthly P&I
- —
- Monthly cashflow
- —
- DSCR
- —
- Eligible?
- —
Short-term bridge; refi at stabilization.
Rent comps 8 comps
| Address | Beds | Baths | Sqft | Rent | $/sqft | DOM | Units | Dist |
|---|---|---|---|---|---|---|---|---|
| 206 Reid's Place Dr Suffolk, VA | 3.0 | 2.5 | 1280 | $2,200 | $1.72 | 4d | 1 | 0.84mi |
| 206 Reid's Place Dr Unit 206 Suffolk, VA | 3.0 | 2.5 | 1280 | $2,300 | $1.80 | 17d | 1 | 0.85mi |
| 1144 Portsmouth Blvd Suffolk, VA | 2.0–3.0 | 2.0 | 1039 | $568 | $0.55 | 2d | 88 | 0.95mi |
| 1000 Meridian Obici Way Suffolk, VA | 1.0–2.0 | 1.0–2.0 | 889 | $2,024 | $2.28 | 2d | 10 | 1.33mi |
| 223 N 7th St Suffolk, VA | 3.0 | 2.5 | 1495 | $2,300 | $1.54 | 44d | 1 | 1.40mi |
| 214 N 7th St Unit NA Suffolk, VA | 2.0 | 1.0 | 760 | $1,500 | $1.97 | 24d | 1 | 1.42mi |
| 120 S 10th St Suffolk, VA | 2.0 | 1.0 | 736 | $1,250 | $1.70 | 44d | 1 | 1.47mi |
| 307 Central Ave Suffolk, VA | 3.0 | 1.0 | 840 | $1,700 | $2.02 | 44d | 1 | 1.50mi |
Listing history 30 events
-
2026-05-12status Under Contract 225-char remark
Show marketing remark (225 chars)
Charming 2 BR 1 BA home in family friendly quiet neighborhood. Brand new front porch, HVAC 2-3 years old, tankless hot water heater and LVP throughout! Convenient location to interstate, Naval base and the Hampton Roads area.
-
2026-05-04historical Active Under Contract 225-char remark
Show marketing remark (225 chars)
Charming 2 BR 1 BA home in family friendly quiet neighborhood. Brand new front porch, HVAC 2-3 years old, tankless hot water heater and LVP throughout! Convenient location to interstate, Naval base and the Hampton Roads area.
-
2026-04-17price $240,000 225-char remark
Show marketing remark (225 chars)
Charming 2 BR 1 BA home in family friendly quiet neighborhood. Brand new front porch, HVAC 2-3 years old, tankless hot water heater and LVP throughout! Convenient location to interstate, Naval base and the Hampton Roads area.
-
2026-03-30$245,000 Active 225-char remark
Show marketing remark (225 chars)
Charming 2 BR 1 BA home in family friendly quiet neighborhood. Brand new front porch, HVAC 2-3 years old, tankless hot water heater and LVP throughout! Convenient location to interstate, Naval base and the Hampton Roads area.
-
2020-04-08status Under Contract
-
2020-03-23historical Active Under Contract
-
2020-01-07$159,900 Active
-
2019-12-31historical
-
2019-10-31price $155,000
-
2019-10-03price $162,500
-
2019-09-07$165,000 Active
-
2017-05-31soldstatus $141,500
-
2017-05-02status Under Contract
-
2017-01-04$145,500 Active
-
2017-01-03historical
-
2016-10-19$145,500 Active
-
2016-10-18historical
-
2016-10-10price $140,000
-
2016-09-13$150,000 Active
-
2016-09-11historical
-
2016-06-09price $150,000
-
2016-05-10price $160,000
-
2016-05-10status Active
-
2016-05-02historical
-
2016-03-10$150,000 Active
-
2015-12-31historical
-
2015-11-17price $149,000
-
2015-07-16$152,000 Active
-
2009-05-15soldstatus $156,000
-
2005-02-24soldstatus $110,300
ⓘ Source: listings_history table (triggers on properties + properties_extension) + one-shot
backfill from property_details.listing_events for pre-trigger history.
Tax reassessment forecast VA · Resets to sale price
- Current annual tax
- $1,983 · $165/mo
- Projected year-2 tax
- $1,983 · $165/mo
- Expected delta
- $0/yr ($0/mo · 0.0%)
ⓘ Screening estimate from a state-policy table — verify with the county assessor before closing.
Climate risk First Street
- Flood 1/10 Low FEMA zone X (unshaded) · 0% chance over 30 yrs
- Wildfire 2/10 Low
- Heat 9/10 Extreme 7 d/yr ≥107°F today · 16 d/yr by 30 yrs out
- Wind 8/10 Severe 80% chance of damaging wind over 30 yrs
- Air quality 2/10 Low 0 unhealthy d/yr today · 1 by 30 yrs out
Nearby sold comps map
Loading sold comps map…
Walkable amenities ~0.75 mi
Loading nearby amenities…
Taxation est. · year 1
- Rental income
- $22,808
- − Mortgage interest
- −$13,444
- − Property taxes
- −$1,983
- − Insurance
- −$1,200
- − Repairs & maintenance
- −$1,825
- − Management
- −$1,825
- − Depreciation
- −$6,982
- Taxable loss
- −$4,450
- Est. tax savings @ 24.0%
- +$1,068
- After-tax cash flow
- $800/yr
For passive investors: Depreciation is non-cash, so a rental often shows a tax loss while cash-flowing — sheltering income. Rental losses are passive: they offset passive income freely, and up to $25,000/yr can offset ordinary (W-2) income if you actively participate and your MAGI is under $100k (phasing out to $0 by $150k); unused losses carry forward. On sale, claimed depreciation is recaptured at up to 25%, and gains may owe capital-gains tax (a 1031 exchange can defer both). Figures are a year-1 estimate at your 24.0% rate — not tax advice; consult a CPA.
Schools (NCES district)
- District
- Suffolk City Public School District
- NCES district ID
- 5103710
- Math proficiency
- 41% ▼ -43.00%
- Reading proficiency
- 69% ▼ -8.00%
- Median HH income
- $65,573
- Composite
- 48.31/100
- National rank
- #2151
- State rank
- #72 of 131 in VA
Livability — Suffolk
- Score
- 77/100
- State rank
- #88
- US rank
- #2896
Category grades
Schools grade is shown separately in the Schools card above.
Census & demographics
- Census place
- Suffolk, VA
- County
- Suffolk City · 88,108 people
- City population
- 88,108
- Metro
- Virginia Beach-Norfolk-Newport News, VA-NC
- Population (ZIP)
- 54,387
- Household income
- $79,877
- Rent vs Own
- Severe rent burden
- 1934.0
Population outlook (Suffolk County) Hauer SSP2
- Today (2025)
- 95,269 people
- By 2030
- 98,269 · +3.1%
- By 2040
- 103,177 · +8.3%
- By 2050
- 105,777 · +11.0%
- By 2075
- 110,963 · +16.5%
- By 2100
- 103,711 · +8.9%
Race, ethnicity, and origin ACS 2023
- Neighborhood character
- Diverse neighborhood (Simpson 0.58)
- Race & ethnicity
- Black 49% White 41% Two or more races 5% Hispanic / Latino 4% Asian 1%
- Common ancestry
- Lithuanian 1% Slovak 1% Italian 1%
- Foreign-born
- 3% · Canada
- Languages at home
- 96% English-only · Spanish 2%
Political lean MEDSL · Suffolk
- 2024 margin
- D (+15.9) · D 57.4% · R 41.5% · Other 1.2%
- 2008→2024 swing
- +2.7pp toward D · 2008: 13.2pp · 2024: 15.9pp
- All cycles
- 2024: D+15.9 2020: D+17.3 2016: D+13.8 2012: D+15.1 2008: D+13.2
Not yet ingested
- Civics
- —
Market trends
- HPI YoY
- ▼ -383.80%
- Current HPI
- 158.5866
- Rent YoY
- ▲ 5.84%
- Metro
- Virginia Beach-Norfolk-Newport News, VA-NC
- State GDP YoY
- ▲ 2.40%
- F500 in state
- 50
Industry mix (Fortune 500 HQ in VA)
| Industry | F500 HQs | Revenue |
|---|---|---|
| Aerospace / Defense | 4 | $236B |
|
||
| Technology / Defense | 3 | $32B |
|
||
| Financial Services | 2 | $176B |
|
||
| Utilities | 2 | $27B |
|
||
| Insurance | 2 | $25B |
|
||
| Technology | 2 | $15B |
|
||
Price history
+117.6% since first listed30 events — show timeline
- 2026-05-12 Pending — REINMLS
- 2026-05-04 Contingent — REINMLS
- 2026-04-17 Price Changed $240,000 REINMLS
- 2026-03-30 Listed $245,000 REINMLS
- 2020-04-08 Pending — REINMLS
- 2020-03-23 Contingent — REINMLS
- 2020-01-07 Listed $159,900 REINMLS
- 2019-12-31 Listing Removed — REINMLS
- 2019-10-31 Price Changed $155,000 REINMLS
- 2019-10-03 Price Changed $162,500 REINMLS
- 2019-09-07 Listed $165,000 REINMLS
- 2017-05-31 Sold (Public Records) $141,500 Public Records
- 2017-05-02 Pending — REINMLS
- 2017-01-04 Listed $145,500 REINMLS
- 2017-01-03 Listing Removed — REINMLS
- 2016-10-19 Listed $145,500 REINMLS
- 2016-10-18 Listing Removed — REINMLS
- 2016-10-10 Price Changed $140,000 REINMLS
- 2016-09-13 Listed $150,000 REINMLS
- 2016-09-11 Listing Removed — REINMLS
- 2016-06-09 Price Changed $150,000 REINMLS
- 2016-05-10 Price Changed $160,000 REINMLS
- 2016-05-10 Relisted — REINMLS
- 2016-05-02 Listing Removed — REINMLS
- 2016-03-10 Listed $150,000 REINMLS
- 2015-12-31 Listing Removed — REINMLS
- 2015-11-17 Price Changed $149,000 REINMLS
- 2015-07-16 Listed $152,000 REINMLS
- 2009-05-15 Sold (Public Records) $156,000 Public Records
- 2005-02-24 Sold (Public Records) $110,300 Public Records
Property tax history
+3.5%/yrLatest (2025): $1,983 · +4.3% YoY. Source: county tax records.
Cash-flow waterfall
monthlySold comps — $/sqft
last 12 mo · ≤1 miLoading sold comps…