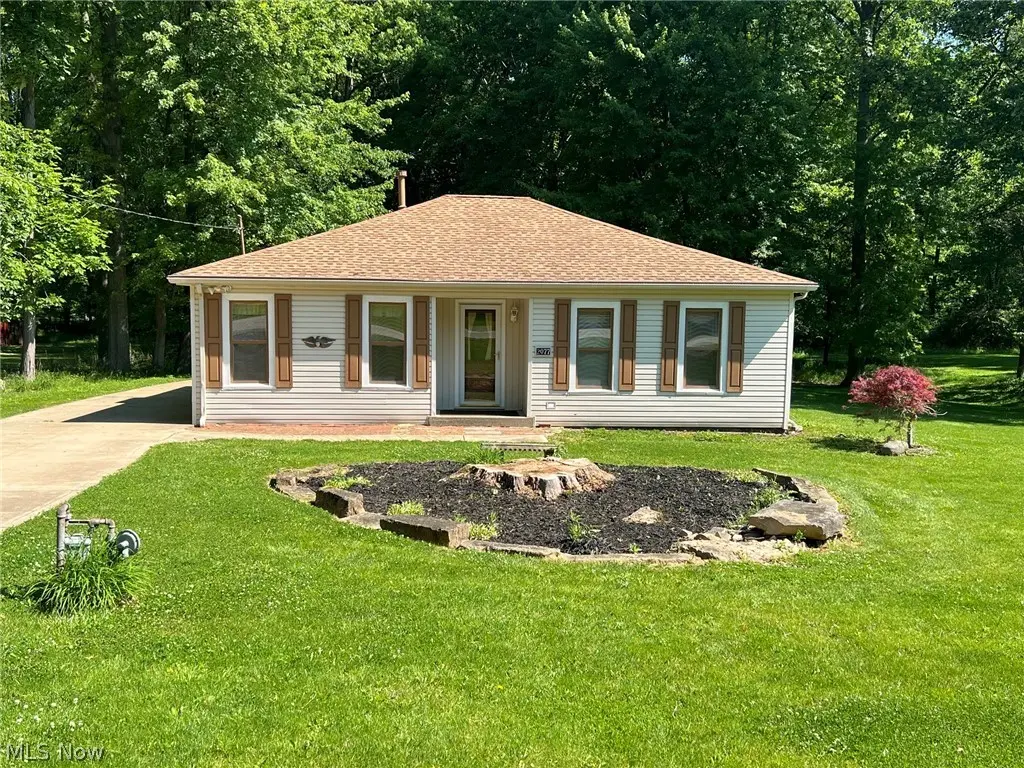
2077 King Dr · Stow, OH
Flood risk 1/10 · Minimal
- FEMA flood zone
- X (unshaded)
- Chance of flooding over 30 yrs
- 0.0%
- Est. flood insurance / yr
- $507 – $1,088
Fire risk 1/10 · Minimal
- Est. fire insurance / yr
- $713 – $1,323
Heat risk 2/10 · Minimal
- Hot days now (above 96°F)
- 7 days/yr
- Hot days in 30 yrs
- 16 days/yr
Wind risk 1/10 · Minimal
- Chance of severe wind over 30 yrs
- —
Air-quality risk 3/10 · Minor
- Unhealthy air days now
- 2 days/yr
- Unhealthy air days in 30 yrs
- 4 days/yr
Risk factors via First Street. Map © Google.
Why this score? — see what drove the D+ grade
The composite is a weighted blend of 9 inputs, each scored 0–100. Each bar is that input's sub-score; the figure is the points it added to the 100-point composite (weight × sub-score).
- ARV discount +15.0/15.0
- Cash flow +11.9/30.0
- Schools +5.3/10.0
- Rent growth +4.6/5.0
- Livability +3.8/5.0
- DSCR +3.5/10.0
- 1% rule +3.0/10.0
- Condition / age +2.5/5.0
- Appreciation +0.0/10.0
$179,900
🖨 Deal sheet (PDF) 📄 Offer letter ✓ Due diligence
Listing remarks
Welcome to 2077 King Dr! Unlock the potential of this well cared for 2-bedroom ranch, nestled in a quiet neighborhood. Filled with warmth and tons of natural light this home offers over 1,000 square feet, hardwood floors throughout most of the home, and fresh paint. The comfortable and functional layout makes everyday living a breeze. The eat-in kitchen provides plenty of room for dining. Both bedrooms are ample-sized. Outside you'll find a detached 2- car garage, and peaceful backyard perfect for gardening or simply unwinding. Whether you're looking to purchase your first home or looking to downsize you don’t want to miss your chance to make this your next home! Schedule your private
Key facts
- Natural light
- Eat-in kitchen
- Peaceful backyard
Tags
Property features AI
Finance
- Financial info: Annual tax noted (not included in detail)
Exterior
- Parking: Detached 2-car garage
- Utilities: Public water; Public sewer
- Home design: Single-story home; 1,060 square feet above-grade finished area
- Construction: Aluminum and vinyl siding; Shingle roof; Year built per public records
- Exterior features: Lot nearly 0.88 acres
Interior
- Bedrooms: Two main-level bedrooms
- Bathrooms: One full bathroom on the main level
- Heating & cooling: Central air conditioning; Forced air heating (gas)
- Interior features: One fireplace
Neighborhood map
What this means for you Summary
Snapshot
- This is a 2-bed/1.0-bath single-family listed at $180k.
Deal economics
- At list price, monthly cash flow is $-46 ($-551/yr) — negative.
- To cash-flow at today's rent, offer at most $172k (4.5% below list).
- To meet the 1% rule (rent ≥ 1% of price), the offer needs to be $143k (20.3% below list).
- Recommended offer: $143k (20.3% below list) — sets the bar for 1% rule.
- Cap rate 6.0% vs local median 3.5% in Stow — top-decile yield for the area; either an underpriced asset or a hidden risk that comps aren't pricing in. Stress-test before assuming the spread holds.
Location & tenants
- Location reads 76/100 on livability (#217 in OH, #3,390 nationally) — a middle-class / working-renter tenant base. Strengths: cost of living A+, housing A+, employment A; Watch: amenities F, commute F.
- Stow-Munroe Falls City School District (suburban): math 58% / reading 64% proficiency, ranked #247 of 656 in OH (top 38%) — acceptable for families but not a draw, mixed tenant base, ~2y average lease; only 18% free/reduced lunch — higher-income household profile.
- Zoned schools: Stow-Munroe Falls High School (math 41% / reading 70%, grade C, #296 of 781 statewide, top 39%, 1,721 students, 21% FRL) — zoned schools at 21% FRL track the district average.
- Market conditions: Rents rising fast (+8.6%/yr); 114 active listings in the ZIP; 20 comparable units currently listed for rent nearby; rentals at typical pace (median 25d on market — plan ~3-4 weeks tenant-placement turnaround); solid renter incomes; 1,114 units permitted in Summit County in 2024 (397 in 5+ unit buildings).
Forward outlook
- Local home prices are declining (-3.0%/yr); year-one equity from $1k of loan paydown is wiped out by about $5k of value loss. Plan a longer hold.
- Summit County population projected to shrink 6% by 2050 — rents likely to lag national; underwrite the cash flow, not the appreciation.
Negotiation context
- Only 2 days on market — expect competitive offers; lowballing is unlikely to land.
Risks & watch-outs
- Watch-outs: built in 1955 — expect roof / HVAC / electrical / plumbing capex.
Questions for the listing agent
- What do current leases actually rent for vs. the listed asking? Can we see a recent rent roll and the last 12 months of T-12 income?
- Built in 1955 — when were the roof, HVAC, electrical panel, plumbing, and water heater last replaced?
- Is there a deadline driving the sale (1031 exchange, divorce, estate, relocation)? That informs how much negotiation room exists.
- Schools are A-rated — typically a magnet for longer-tenancy family renters. What's the average tenant stay here, and is there a school-zone premium baked into asking?
- The area grade is low — what's the realistic commute time and amenity access for the typical tenant pool here? Any planned neighborhood developments (good or bad) we should know about?
- What's the average days-on-market for RENTAL listings here right now (not sales)? A rising rental-DOM trend means longer vacancies and softer asking-rent achievability than the comps imply.
- What's the recent tenant-quality profile in this submarket — average credit score on applications, eviction rate, late-payment / NSF rate, and stable-employment percentage? A property-management company in the area should have these aggregated.
- How much new for-sale + rental construction is in the pipeline within 1–3 miles? Heavy new supply typically softens prices + rents 12–24 months out; constrained supply supports both.
Investment metrics
- 1% rule
- 0.80% ✗
- Cap rate
- 5.99%
- Cash-on-cash
- -1.09%
- DSCR
- 0.95
- GRM
- 10.5
CMA / ARV
- ARV (on-the-fly)
- $249,100
- Comps found
- 12
Show comp detail 12 sales within ~0.75 mi
| Address | Dist | Beds/Ba | Sqft | Sold | Price | $/sf | Match |
|---|---|---|---|---|---|---|---|
| 4145 Darrow Rd | 0.34mi | 2/2.0 | 1,060 (0%) | 6mo | $145,000 | $137 | 75 |
| 2075 Maplewood Rd | 0.15mi | 3/2.5 (+1) | 1,144 (+8%) | 6mo | $305,000 | $267 | 64 |
| 3901 Moreland Ave | 0.58mi | 3/1.5 (+1) | 1,106 (+4%) | 4mo | $285,000 | $258 | 55 |
| 4155 Burton Dr | 0.69mi | 3/1.0 (+1) | 1,014 (-4%) | 1mo | $231,000 | $228 | 55 |
| 2314 Lynnwood Dr | 0.45mi | 3/2.5 (+1) | 1,099 (+4%) | 9mo | $295,000 | $268 | 54 |
| 4003 Kenneth Rd | 0.70mi | 3/1.0 (+1) | 1,014 (-4%) | 2mo | $225,000 | $222 | 53 |
| 4131 Burton Dr | 0.71mi | 3/2.0 (+1) | 1,068 (+1%) | 5mo | $245,000 | $229 | 52 |
| 4293 N Gilwood Dr | 0.56mi | 3/2.0 (+1) | 1,099 (+4%) | 10mo | $258,000 | $235 | 51 |
| 3842 Moreland Ave | 0.70mi | 3/1.0 (+1) | 1,156 (+9%) | 3mo | $172,500 | $149 | 45 |
| 4490 Stow Rd | 0.57mi | 3/2.0 (+1) | 1,182 (+12%) | 9mo | $278,000 | $235 | 38 |
| 4287 Osage St | 0.57mi | 3/3.0 (+1) | 1,200 (+13%) | 2mo | $299,100 | $249 | 36 |
| 4000 Kenneth Rd | 0.69mi | 3/3.0 (+1) | 1,136 (+7%) | 11mo | $282,100 | $248 | 34 |
Match score weights: distance 35% · size 25% · config 20% · recency 20%. Top-matched comps best support the ARV.
Projected returns pro-forma
-3.0% appreciation · 8.0% rent growth · sell at horizon
- IRR
- -12.9%
- Equity multiple
- 0.51×
- Total profit
- $-24,520
- Equity at exit
- $26,824
- IRR
- 2.1%
- Equity multiple
- 1.18×
- Total profit
- $9,282
- Equity at exit
- $15,554
Cash invested: $50,372 (down + closing). Projections, not guarantees.
Landlord ↔ Tenant lean methodology
- Overall (STATE)
- 73 Landlord-Friendly
- State Ohio
- 73 Landlord-Friendly · R+6
- County
- — inherits STATE
- City
- — inherits STATE
ZIP-level market 44224
- Rents YoY
- 8.6%
- Active inventory
- 114
- Price-to-rent
- 10.5×
Monthly cashflow live
- Estimated rent
- $1,433 high interval (Pro) →
- Mortgage (P&I)
- −$943
- Tax from tax record
- −$160 /mo · $1,918/yr
- Insurance
- −$75
- HOA
- −$0
- Vacancy / Maint / Mgmt
- −$301
- Net cashflow
- $-46
Break-even live
Sensitivity live
| Price | -10% $56 | -5% $5 | +0% $-46 | +5% $-97 | +10% $-148 |
|---|---|---|---|---|---|
| Rent | -10% $-159 | -5% $-103 | +0% $-46 | +5% $11 | +10% $67 |
| Rate | -1.0pp $45 | -0.5pp $0 | base $-46 | +0.5pp $-93 | +1.0pp $-140 |
UW: 25.0% down · 7.5% · 30yr · 1.5% tax · 5.0% vac · 8.0% maint · 8.0% mgmt
Financing live
Cash to close
- Down payment
- $44,975
- Closing costs
- $5,397
- Reserves months
- —
- Total cash needed
- —
Loan-product check · same deal, 3 products live
Conventional
25% down · 7.5% · 30yr
- Down + closing
- —
- Monthly P&I
- —
- Monthly cashflow
- —
- DSCR
- —
- Eligible?
- —
Personal DTI + credit; lowest rate.
DSCR
20% down · 8.5% · 30yr
- Down + closing
- —
- Monthly P&I
- —
- Monthly cashflow
- —
- DSCR
- —
- Eligible?
- —
No personal income docs; deal must DSCR.
Hard money
10% down · 12.0% · 12mo
- Down + closing
- —
- Monthly P&I
- —
- Monthly cashflow
- —
- DSCR
- —
- Eligible?
- —
Short-term bridge; refi at stabilization.
Rent comps 20 comps
| Address | Beds | Baths | Sqft | Rent | $/sqft | DOM | Units | Dist |
|---|---|---|---|---|---|---|---|---|
| 1987 King Dr Stow, OH | 2.0 | 1.0 | 1048 | $1,350 | $1.29 | 25d | 1 | 0.15mi |
| 2116 Samira Rd Stow, OH | 3.0 | 2.0 | 1176 | $1,575 | $1.34 | 16d | 1 | 0.35mi |
| 2443 Echo Valley Dr Unit 2443 Stow, OH | 2.0 | 2.0 | 1000 | $1,250 | $1.25 | 45d | 1 | 0.57mi |
| 2443 Echo Valley Dr Unit 2424 Stow, OH | 2.0 | 2.0 | 1000 | $1,250 | $1.25 | 25d | 1 | 0.57mi |
| 2443 Echo Valley Dr Unit 2450 Stow, OH | 2.0 | 2.0 | 1000 | $1,250 | $1.25 | 23d | 1 | 0.57mi |
| 2450 Echo Valley Dr Unit 2450 Stow, OH | 2.0 | 2.0 | 1000 | $1,250 | $1.25 | 23d | 1 | 0.60mi |
| 2444 Echo Valley Dr Unit 2444 Stow, OH | 2.0 | 2.0 | 1000 | $1,250 | $1.25 | 25d | 1 | 0.60mi |
| 2398 Echo Valley Dr Stow, OH | 2.0 | 1.5 | 1440 | $1,150 | $0.80 | 45d | 1 | 0.61mi |
| 2424 Echo Valley Dr Unit 2424 Stow, OH | 2.0 | 2.0 | 1000 | $1,250 | $1.25 | 25d | 1 | 0.61mi |
| 4261 Osage St Stow, OH | 3.0 | 2.0 | 1072 | $1,850 | $1.73 | 16d | 1 | 0.61mi |
| 2198 Liberty Rd Stow, OH | 1.0–2.0 | 1.0 | 850 | $1,063 | $1.25 | 23d | 2 | 0.72mi |
| 4020 Vira Rd Stow, OH | 2.0 | 1.0 | 896 | $1,250 | $1.40 | 25d | 1 | 0.96mi |
| 4134 Beckley Rd Stow, OH | 3.0 | 1.0 | 1200 | $1,750 | $1.46 | 45d | 1 | 0.97mi |
| 1514 Robin Ln Stow, OH | 2.0 | 1.0 | 1050 | $1,475 | $1.40 | 45d | 1 | 1.05mi |
| 4392 Millburn Ave Stow, OH | 1.0–2.0 | 1.0–2.0 | 720 | $1,325 | $1.84 | 15d | 3 | 1.19mi |
| 3538 Orchard Dr Stow, OH | 2.0 | 1.0 | 884 | $1,395 | $1.58 | 45d | 1 | 1.22mi |
| 1941 Hidden Lake Dr Stow, OH | 1.0–2.0 | 1.0–2.0 | 853 | $1,775 | $2.08 | 16d | 13 | 1.26mi |
| 3591 Hiwood Ave Stow, OH | 3.0 | 1.0 | 912 | $1,595 | $1.75 | 45d | 1 | 1.26mi |
| 2855 Graham Rd Unit 4 Stow, OH | 2.0 | 1.5 | 1236 | $1,350 | $1.09 | 45d | 1 | 1.38mi |
| 3674 Kent Rd Stow, OH | 1.0–2.0 | 1.0–1.5 | 815 | $1,349 | $1.66 | 15d | 7 | 1.41mi |
Listing history 4 events
-
2026-06-14status $179,900 Pending 2 DOM
-
2026-06-10days on market $179,900 Active 2 DOM
-
2026-06-09remarks 693-char remark
-
2026-06-09$179,900 Active 1 DOM
ⓘ Source: listings_history table (triggers on properties + properties_extension) + one-shot
backfill from property_details.listing_events for pre-trigger history.
Tax reassessment forecast OH · Partial reset (capped growth)
- Current annual tax
- $1,918 · $160/mo
- Projected year-2 tax
- $2,362 · $197/mo
- Expected delta
- +$444/yr (+$37/mo · 23.1%)
ⓘ Screening estimate from a state-policy table — verify with the county assessor before closing.
Climate risk First Street
- Flood 1/10 Low FEMA zone X (unshaded) · 0% chance over 30 yrs
- Wildfire 1/10 Low
- Heat 2/10 Low 7 d/yr ≥96°F today · 16 d/yr by 30 yrs out
- Wind 1/10 Low
- Air quality 3/10 Moderate 2 unhealthy d/yr today · 4 by 30 yrs out
Nearby sold comps map
Loading sold comps map…
Walkable amenities ~0.75 mi
Loading nearby amenities…
Taxation est. · year 1
- Rental income
- $17,200
- − Mortgage interest
- −$10,077
- − Property taxes
- −$1,918
- − Insurance
- −$900
- − Repairs & maintenance
- −$1,376
- − Management
- −$1,376
- − Depreciation
- −$5,233
- Taxable loss
- −$3,681
- Est. tax savings @ 24.0%
- +$883
- After-tax cash flow
- $332/yr
For passive investors: Depreciation is non-cash, so a rental often shows a tax loss while cash-flowing — sheltering income. Rental losses are passive: they offset passive income freely, and up to $25,000/yr can offset ordinary (W-2) income if you actively participate and your MAGI is under $100k (phasing out to $0 by $150k); unused losses carry forward. On sale, claimed depreciation is recaptured at up to 25%, and gains may owe capital-gains tax (a 1031 exchange can defer both). Figures are a year-1 estimate at your 24.0% rate — not tax advice; consult a CPA.
Schools (NCES district)
- District
- Stow-Munroe Falls City School District
- NCES district ID
- 3904483
- Math proficiency
- 58% ▼ -11.00%
- Reading proficiency
- 64% ▼ -6.00%
- Median HH income
- $64,663
- Composite
- 53.29/100
- National rank
- #1488
- State rank
- #247 of 656 in OH
Livability — Stow
- Score
- 76/100
- State rank
- #217
- US rank
- #3390
Category grades
Schools grade is shown separately in the Schools card above.
Census & demographics
- Census place
- Stow, OH
- County
- Summit County · 440,783 people
- City population
- 39,200
- Metro
- Akron, OH
- Population (ZIP)
- 39,200
- Household income
- $94,287
- Rent vs Own
- Severe rent burden
- 1165.0
Population outlook (Summit County) Hauer SSP2
- Today (2025)
- 546,583 people
- By 2030
- 544,028 · -0.5%
- By 2040
- 531,363 · -2.8%
- By 2050
- 514,923 · -5.8%
- By 2075
- 481,765 · -11.9%
- By 2100
- 432,265 · -20.9%
Race, ethnicity, and origin ACS 2023
- Neighborhood character
- Predominantly White (85%)
- Race & ethnicity
- White 85% Two or more races 6% Black 5% Asian 3% Hispanic / Latino 2%
- Common ancestry
- Romanian 6% Slovak 3% Italian 3%
- Foreign-born
- 7% · Canada, China
- Languages at home
- 93% English-only · Arabic 2% Spanish 1% Other Asian/Pacific 1%
Political lean MEDSL · Summit
- 2024 margin
- Lean D (+7.0) · D 53.0% · R 46.0%
- 2008→2024 swing
- -9.6pp toward R · 2008: 16.6pp · 2024: 7.0pp
- All cycles
- 2024: D+7.0 2020: D+9.6 2016: D+8.2 2012: D+14.8 2008: D+16.6
Not yet ingested
- Civics
- —
Market trends
- HPI YoY
- ▼ -218.72%
- Current HPI
- 208.3063
- Rent YoY
- ▲ 8.56%
- Metro
- Akron, OH
- State GDP YoY
- ▲ 1.98%
- F500 in state
- 48
Industry mix (Fortune 500 HQ in OH)
| Industry | F500 HQs | Revenue |
|---|---|---|
| Insurance | 3 | $145B |
|
||
| Industrial Machinery | 3 | $49B |
|
||
| Financial Services | 3 | $24B |
|
||
| Consumer Goods | 2 | $93B |
|
||
| Aerospace / Defense | 2 | $47B |
|
||
| Utilities | 2 | $33B |
|
||
Price history
1 event — show timeline
- 2026-06-05 Listed $179,900 MLSNOW
Property tax history
+2.5%/yrLatest (2025): $1,918 · -2.6% YoY. Source: county tax records.
Cash-flow waterfall
monthlySold comps — $/sqft
last 12 mo · ≤1 miLoading sold comps…