1008 N Burbank Dr · Montgomery, AL
Flood risk 1/10 · Minimal
- FEMA flood zone
- X (unshaded)
- Chance of flooding over 30 yrs
- 0.0%
- Est. flood insurance / yr
- $507 – $1,088
Fire risk 4/10 · Minor
- Est. fire insurance / yr
- $916 – $1,700
Heat risk 8/10 · Major
- Hot days now (above 108°F)
- 7 days/yr
- Hot days in 30 yrs
- 20 days/yr
Wind risk 8/10 · Major
- Chance of severe wind over 30 yrs
- 80.0%
Air-quality risk 4/10 · Minor
- Unhealthy air days now
- 4 days/yr
- Unhealthy air days in 30 yrs
- 5 days/yr
Risk factors via First Street. Map © Google.
Why this score? — see what drove the D+ grade
The composite is a weighted blend of 9 inputs, each scored 0–100. Each bar is that input's sub-score; the figure is the points it added to the 100-point composite (weight × sub-score).
- Cash flow +20.6/30.0
- DSCR +6.5/10.0
- ARV discount +6.0/15.0
- 1% rule +4.9/10.0
- Rent growth +3.2/5.0
- Livability +3.2/5.0
- Condition / age +2.5/5.0
- Schools +1.7/10.0
- Appreciation +0.0/10.0
$155,000
🖨 Deal sheet 📄 Offer letter ✓ Due diligence
Listing remarks MLS
Looking for a fully renovated home with a custom design? This is the one! * NEW HVAC * NEW WATER HEATER * Multiple outdoor areas including covered pation area! From the moment you enter this home, you are greeted with breathtaking vaulted ceilings, an open floor plan, a ceiling height fireplace and so much more!! The kitchen has been updated with beautiful stainless steel appliances, granite countertops, and much more! THREE super spacious bathrooms and TWO large bathrooms are well situated in this home. View this home today! You won't be disappointed!
Key facts
- Updated kitchen
- Vaulted ceilings
- Granite countertops
Tags
Property features AI
Exterior
- Parking: Driveway
- Security: Fire alarm
- Utilities: Public water; Public sewer; Cable available; Natural gas available
- Home design: Single-story home; Slab foundation; Masonite and wood siding
- Construction: Masonite siding; Wood siding; Slab foundation
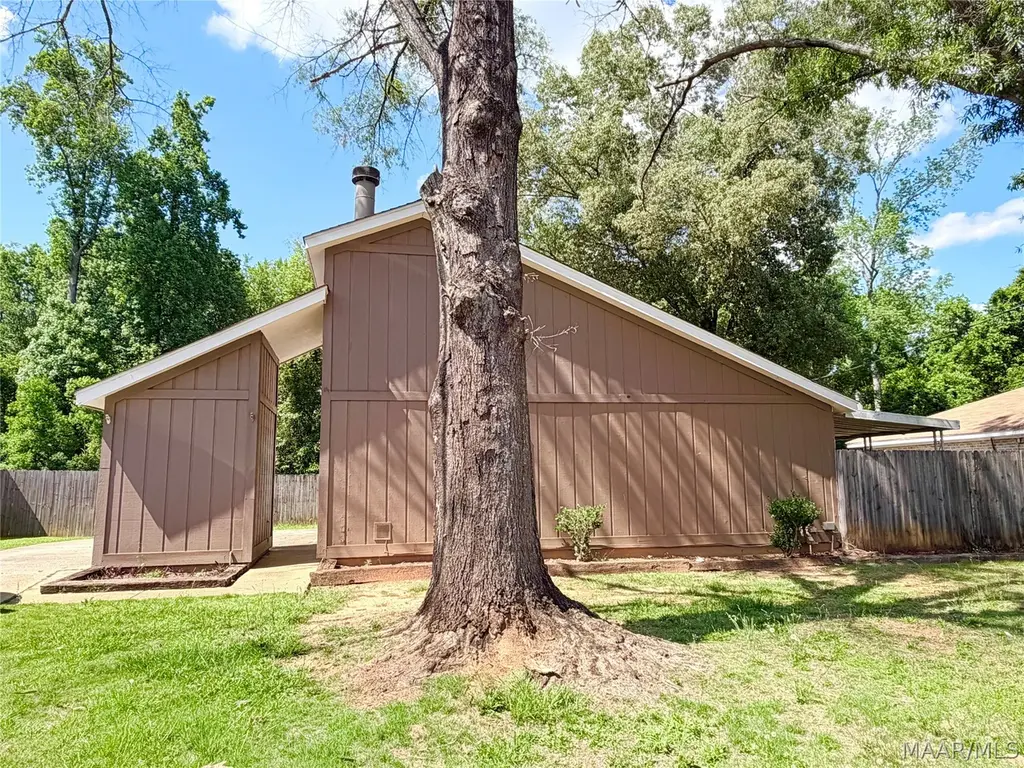
- Exterior features: Fully fenced yard; Patio; Outdoor storage; Mature trees; City lot
Interior
- Bedrooms: Bedrooms located on the first level
- Flooring: Tile flooring; Vinyl flooring
- Bathrooms: Two full bathrooms on the first level
- Heating & cooling: Central heating (electric and gas); Central electric air conditioning
- Interior features: Tile and vinyl flooring; Factory-built fireplace; Fire alarm
- Laundry & utility: Washer hookup; Dryer hookup; Water heater
Neighborhood map
What this means for you Summary
Snapshot
- This is a 3-bed/2.0-bath single-family listed at $155k.
Deal economics
- At list price, monthly cash flow is $206 ($2k/yr) — positive.
- The deal already cash-flows at list — no discount required.
- To meet the 1% rule (rent ≥ 1% of price), the offer needs to be $153k (1.0% below list).
- Recommended offer: $153k (1.0% below list) — sets the bar for 1% rule.
- Cap rate 7.9% vs local median 6.0% in Montgomery — top-decile yield for the area; either an underpriced asset or a hidden risk that comps aren't pricing in. Stress-test before assuming the spread holds.
Location & tenants
- Location reads 65/100 on livability (#138 in AL) — a middle-class / working-renter tenant base. Strengths: cost of living A+, housing A+; Watch: schools C-, employment D, crime F.
- Montgomery County (urban): math 9% / reading 31% proficiency, ranked #106 of 129 in AL (top 82%) — low school quality limits family demand, transient renter base, plan for 1-2y turnover; 70% free/reduced lunch — lower-income household profile, screen leases tightly.
- Market conditions: Rents rising (+3.0%/yr); 407 active listings in the ZIP; 32 comparable units currently listed for rent nearby; rentals at typical pace (median 21d on market — plan ~3-4 weeks tenant-placement turnaround); 41% of comp listings sitting > 30 days — soft ceiling on asking rent; 460 units permitted in Montgomery County in 2024 (37 in 5+ unit buildings).
Forward outlook
- Local home prices are declining (-3.0%/yr); year-one equity from $1k of loan paydown is wiped out by about $5k of value loss. Plan a longer hold.
- Montgomery County population projected to shrink 8% by 2050 — rents likely to lag national; underwrite the cash flow, not the appreciation.
Negotiation context
- Only 10 days on market — expect competitive offers; lowballing is unlikely to land.
- 6 sale attempts since 27y ago with the ask held roughly flat each time — persistent listings suggest the price (not the market) is what's stuck; bring a comps-based counter.
Risks & watch-outs
- Climate carrying-cost: severe wind risk, 80% chance of damaging wind over 30y; extreme-heat days projected 7→20/yr by 2055 (HVAC capex compounding) — expect insurance premiums to compound above CPI over the hold.
Questions for the listing agent
- Is there a deadline driving the sale (1031 exchange, divorce, estate, relocation)? That informs how much negotiation room exists.
- Crime grade is F in this area — have there been break-ins, vandalism, or insurance claims at this property in the last 3 years? What carrier currently insures it and at what premium?
- The area grade is low — what's the realistic commute time and amenity access for the typical tenant pool here? Any planned neighborhood developments (good or bad) we should know about?
- What's the average days-on-market for RENTAL listings here right now (not sales)? A rising rental-DOM trend means longer vacancies and softer asking-rent achievability than the comps imply.
- What's the recent tenant-quality profile in this submarket — average credit score on applications, eviction rate, late-payment / NSF rate, and stable-employment percentage? A property-management company in the area should have these aggregated.
- How much new for-sale + rental construction is in the pipeline within 1–3 miles? Heavy new supply typically softens prices + rents 12–24 months out; constrained supply supports both.
Investment metrics
- 1% rule
- 0.99% ✗
- Cap rate
- 7.89%
- Cash-on-cash
- 5.70%
- DSCR
- 1.25
- GRM
- 8.4
CMA / ARV
- ARV (on-the-fly)
- $150,075
- Comps found
- 12
Show comp detail 12 sales within ~0.75 mi
| Address | Dist | Beds/Ba | Sqft | Sold | Price | $/sf | Match |
|---|---|---|---|---|---|---|---|
| 5757 Sweet Mdw | 0.17mi | 3/2.0 | 1,395 (+7%) | 3mo | $172,500 | $124 | 78 |
| 5820 Clear Creek Ct | 0.22mi | 3/2.0 | 1,371 (+5%) | 5mo | $110,000 | $80 | 77 |
| 1020 N Burbank Dr | 0.04mi | 3/2.0 | 1,111 (-15%) | 4mo | $142,500 | $128 | 70 |
| 1202 Sweetwood Ct | 0.31mi | 3/2.0 | 1,413 (+8%) | 2mo | $163,000 | $115 | 70 |
| 6265 Wares Ferry Rd | 0.58mi | 3/2.0 | 1,336 (+2%) | 0mo | $141,000 | $106 | 69 |
| 5728 Sweet Meadow Dr | 0.20mi | 3/2.0 | 1,477 (+13%) | 1mo | $181,400 | $123 | 68 |
| 5717 Ainsworth Dr | 0.29mi | 3/2.0 | 1,445 (+11%) | 5mo | $149,000 | $103 | 65 |
| 728 Amity Ln | 0.40mi | 4/2.0 (+1) | 1,218 (-7%) | 2mo | $140,500 | $115 | 63 |
| 6043 Hobbie Brook Cv | 0.67mi | 3/2.0 | 1,239 (-5%) | 1mo | $170,000 | $137 | 59 |
| 5791 Darien Dr | 0.44mi | 3/2.0 | 1,473 (+13%) | 1mo | $153,000 | $104 | 57 |
| 576 Dunbarton Rd | 0.74mi | 3/2.0 | 1,355 (+4%) | 4mo | $152,000 | $112 | 56 |
| 691 Dunbarton Rd | 0.66mi | 3/2.0 | 1,500 (+15%) | 6mo | $141,000 | $94 | 39 |
Match score weights: distance 35% · size 25% · config 20% · recency 20%. Top-matched comps best support the ARV.
Projected returns pro-forma
-3.0% appreciation · 2.99% rent growth · sell at horizon
- IRR
- -7.5%
- Equity multiple
- 0.72×
- Total profit
- $-12,015
- Equity at exit
- $23,111
- IRR
- 2.0%
- Equity multiple
- 1.15×
- Total profit
- $6,316
- Equity at exit
- $13,402
Cash invested: $43,400 (down + closing). Projections, not guarantees.
Landlord ↔ Tenant lean methodology
- Overall (STATE)
- 90 Strongly Landlord-Friendly
- State Alabama
- 90 Strongly Landlord-Friendly · R+15
- County
- — inherits STATE
- City
- — inherits STATE
ZIP-level market 36117
- Home prices YoY
- -20.0%
- Rents YoY
- 3.0%
- Active inventory
- 407
- Price-to-rent
- 8.4×
Monthly cashflow live
- Estimated rent
- $1,534 high interval (Pro) →
- Mortgage (P&I)
- −$813
- Tax from tax record
- −$128 /mo · $1,538/yr
- Insurance
- −$65
- HOA
- −$0
- Vacancy / Maint / Mgmt
- −$322
- Net cashflow
- $206
Break-even live
UW: 25.0% down · 7.5% · 30yr · 1.5% tax · 5.0% vac · 8.0% maint · 8.0% mgmt
Financing live
Cash to close
- Down payment
- $38,750
- Closing costs
- $4,650
- Reserves months
- —
- Total cash needed
- —
Loan-product check · same deal, 3 products live
Conventional
25% down · 7.5% · 30yr
- Down + closing
- —
- Monthly P&I
- —
- Monthly cashflow
- —
- DSCR
- —
- Eligible?
- —
Personal DTI + credit; lowest rate.
DSCR
20% down · 8.5% · 30yr
- Down + closing
- —
- Monthly P&I
- —
- Monthly cashflow
- —
- DSCR
- —
- Eligible?
- —
No personal income docs; deal must DSCR.
Hard money
10% down · 12.0% · 12mo
- Down + closing
- —
- Monthly P&I
- —
- Monthly cashflow
- —
- DSCR
- —
- Eligible?
- —
Short-term bridge; refi at stabilization.
Rent comps 32 comps
| Address | Beds | Baths | Sqft | Rent | $/sqft | DOM | Units | Dist |
|---|---|---|---|---|---|---|---|---|
| 5735 Sweet Meadow Dr Montgomery, AL | 3.0 | 2.0 | 1413 | $1,525 | $1.08 | 43d | 1 | 0.22mi |
| 5805 Hyde Park Dr Montgomery, AL | 3.0 | 2.0 | 1757 | $1,511 | $0.86 | 20d | 1 | 0.26mi |
| 728 Amity Ln Montgomery, AL | 4.0 | 2.0 | 1218 | $1,700 | $1.40 | 13d | 1 | 0.39mi |
| 760 N Burbank Dr Montgomery, AL | 3.0 | 2.0 | 1102 | $1,400 | $1.27 | 43d | 1 | 0.40mi |
| 713 Amity Ln Montgomery, AL | 4.0 | 2.0 | 1696 | $1,900 | $1.12 | 43d | 1 | 0.45mi |
| 6265 Wares Ferry Rd Montgomery, AL | 3.0 | 2.0 | 1336 | $1,600 | $1.20 | 13d | 1 | 0.56mi |
| 6061 Karen Valley Cv Montgomery, AL | 3.0 | 2.0 | 1509 | $1,500 | $0.99 | 20d | 1 | 0.62mi |
| 6409 Deerwood Pl Montgomery, AL | 3.0 | 2.0 | 1504 | $1,711 | $1.14 | 13d | 1 | 0.63mi |
| 6272 Deerwood Dr Montgomery, AL | 3.0 | 2.0 | 1754 | $1,875 | $1.07 | 20d | 1 | 0.65mi |
| 6272 Deerwood Dr Montgomery, AL | 3.0 | 2.0 | 1754 | $1,785 | $1.02 | 13d | 1 | 0.65mi |
| 5712 Roxboro Dr Montgomery, AL | 4.0 | 2.0 | 1544 | $1,450 | $0.94 | 20d | 1 | 0.65mi |
| 706 Placid Dr Montgomery, AL | 3.0 | 1.5 | 1120 | $1,400 | $1.25 | 13d | 1 | 0.66mi |
| 457 Mulligan Dr Montgomery, AL | 3.0 | 2.0 | 1344 | $1,335 | $0.99 | 43d | 1 | 0.76mi |
| 523 Placid Dr Montgomery, AL | 3.0 | 2.0 | 1122 | $1,195 | $1.07 | 43d | 1 | 0.77mi |
| 438 Mulligan Dr Montgomery, AL | 4.0 | 2.0 | 1232 | $1,500 | $1.22 | 43d | 1 | 0.80mi |
| 6411 Pinebrook Dr Montgomery, AL | 3.0 | 1.5 | 1120 | $1,095 | $0.98 | 43d | 1 | 0.84mi |
| 428 Fieldbrook Dr Montgomery, AL | 3.0 | 1.5 | 1440 | $995 | $0.69 | 20d | 1 | 0.86mi |
| 6005 Tamarack Dr Montgomery, AL | 4.0 | 2.0 | 1617 | $1,650 | $1.02 | 43d | 1 | 0.87mi |
| 323 N Burbank Dr Montgomery, AL | 4.0 | 2.0 | 1584 | $1,381 | $0.87 | 13d | 1 | 0.90mi |
| 516 Lawndale Ln Montgomery, AL | 3.0 | 1.0 | 1125 | $1,150 | $1.02 | 43d | 1 | 0.90mi |
| 535 Lawndale Ln Montgomery, AL | 4.0 | 1.5 | 1260 | $1,100 | $0.87 | 13d | 1 | 0.90mi |
| 633 Groveland Dr Montgomery, AL | 3.0 | 2.0 | 1424 | $1,200 | $0.84 | 43d | 1 | 1.01mi |
| 241 Kroy Dr Montgomery, AL | 4.0 | 2.0 | 1450 | $1,195 | $0.82 | 43d | 1 | 1.05mi |
| 6320 Burbank Crossing Loop Montgomery, AL | 3.0 | 2.0 | 1238 | $1,600 | $1.29 | 43d | 1 | 1.07mi |
| 605 Plantation Way Montgomery, AL | 4.0 | 2.0 | 1519 | $1,200 | $0.79 | 20d | 1 | 1.09mi |
| 6265 Nature Dr Montgomery, AL | 3.0 | 2.0 | 1400 | $1,050 | $0.75 | 13d | 1 | 1.15mi |
| 538 Hollow Wood Rd Montgomery, AL | 2.0 | 2.0 | 1053 | $1,100 | $1.04 | 43d | 1 | 1.25mi |
| 564 Glade Park Loop Unit 1043856P Montgomery, AL | 4.0 | 2.0 | 1496 | $2,736 | $1.83 | 13d | 1 | 1.25mi |
| 6121 Boardwalk Blvd Montgomery, AL | 3.0 | 2.0 | 1155 | $1,075 | $0.93 | 20d | 1 | 1.27mi |
| 6121 Boardwalk Blvd Montgomery, AL | 1.0–3.0 | 1.0–2.0 | 877 | $1,075 | $1.23 | 13d | 4 | 1.27mi |
| 4732 Retreat Rd Montgomery, AL | 2.0 | 2.0 | 1034 | $995 | $0.96 | 20d | 1 | 1.29mi |
| 6637 Ridgeview Cir Montgomery, AL | 3.0 | 2.5 | 1458 | $1,700 | $1.17 | 20d | 1 | 1.49mi |
Listing history 9 events
-
2026-06-18days on market $155,000 Active 10 DOM
-
2026-06-17days on market $155,000 Active 9 DOM
-
2026-06-16days on market $155,000 Active 8 DOM
-
2026-06-15days on market $155,000 Active 7 DOM
-
2026-06-14days on market $155,000 Active 5 DOM
-
2026-06-13days on market $155,000 Active 4 DOM
-
2026-06-10days on market $155,000 Active 2 DOM
-
2026-06-09remarks 699-char remark
-
2026-06-09$155,000 Active 1 DOM
ⓘ Source: listings_history table (triggers on properties + properties_extension) + one-shot
backfill from property_details.listing_events for pre-trigger history.
Tax reassessment forecast AL · Resets to sale price
- Current annual tax
- $1,538 · $128/mo
- Projected year-2 tax
- $1,538 · $128/mo
- Expected delta
- $0/yr ($0/mo · 0.0%)
ⓘ Screening estimate from a state-policy table — verify with the county assessor before closing.
Climate risk First Street
- Flood 1/10 Low FEMA zone X (unshaded) · 0% chance over 30 yrs
- Wildfire 4/10 Moderate
- Heat 8/10 Severe 7 d/yr ≥108°F today · 20 d/yr by 30 yrs out
- Wind 8/10 Severe 80% chance of damaging wind over 30 yrs
- Air quality 4/10 Moderate 4 unhealthy d/yr today · 5 by 30 yrs out
Nearby sold comps map
Loading sold comps map…
Walkable amenities ~0.75 mi
Loading nearby amenities…
Taxation est. · year 1
- Rental income
- $18,408
- − Mortgage interest
- −$8,682
- − Property taxes
- −$1,538
- − Insurance
- −$775
- − Repairs & maintenance
- −$1,473
- − Management
- −$1,473
- − Depreciation
- −$4,509
- Taxable loss
- −$43
- Est. tax savings @ 24.0%
- +$10
- After-tax cash flow
- $2,485/yr
For passive investors: Depreciation is non-cash, so a rental often shows a tax loss while cash-flowing — sheltering income. Rental losses are passive: they offset passive income freely, and up to $25,000/yr can offset ordinary (W-2) income if you actively participate and your MAGI is under $100k (phasing out to $0 by $150k); unused losses carry forward. On sale, claimed depreciation is recaptured at up to 25%, and gains may owe capital-gains tax (a 1031 exchange can defer both). Figures are a year-1 estimate at your 24.0% rate — not tax advice; consult a CPA.
Schools (NCES district)
- District
- Montgomery County
- NCES district ID
- 0102430
- Math proficiency
- 9% ▼ -21.00%
- Reading proficiency
- 31% ▼ -1.00%
- Median HH income
- $43,902
- Composite
- 17.24/100
- National rank
- #9093
- State rank
- #106 of 129 in AL
Livability — Montgomery
- Score
- 65/100
- State rank
- #138
- US rank
- #13416
Category grades
Schools grade is shown separately in the Schools card above.
Census & demographics
- Census place
- Montgomery, AL
- County
- Montgomery County · 190,016 people
- City population
- 175,913
- Metro
- Montgomery, AL
- Population (ZIP)
- 53,172
- Household income
- $74,720
- Rent vs Own
- Severe rent burden
- 1742.0
Population outlook (Montgomery County) Hauer SSP2
- Today (2025)
- 224,008 people
- By 2030
- 221,460 · -1.1%
- By 2040
- 214,179 · -4.4%
- By 2050
- 204,912 · -8.5%
- By 2075
- 177,821 · -20.6%
- By 2100
- 145,134 · -35.2%
Race, ethnicity, and origin ACS 2023
- Neighborhood character
- Diverse neighborhood (Simpson 0.60)
- Race & ethnicity
- Black 53% White 34% Asian 8% Two or more races 3% Hispanic / Latino 3%
- Common ancestry
- Italian 1% Slovak 1% Lithuanian 1%
- Foreign-born
- 9% · South Korea, Canada, China
- Languages at home
- 90% English-only · Korean 4% Spanish 3% Other Indo-European 1%
Political lean MEDSL · Montgomery
- 2024 margin
- Solid D (+30.7) · D 64.8% · R 34.1% · Other 1.1%
- 2008→2024 swing
- +11.5pp toward D · 2008: 19.2pp · 2024: 30.7pp
- All cycles
- 2024: D+30.7 2020: D+31.5 2016: D+26.2 2012: D+24.3 2008: D+19.2
Not yet ingested
- Civics
- —
Market trends
- HPI YoY
- ▼ -37.24%
- Current HPI
- 148.7728
- Rent YoY
- ▲ 2.99%
- Metro
- Montgomery, AL
- State GDP YoY
- ▲ 2.94%
- F500 in state
- 4
Industry mix (Fortune 500 HQ in AL)
| Industry | F500 HQs | Revenue |
|---|---|---|
| Financial Services | 1 | $8B |
|
||
| Healthcare | 1 | $5B |
|
||
Price history
+96.8% since first listed13 events — show timeline
- 2026-06-08 Listed $155,000 MAAR
- 2023-03-09 Sold (Public Records) $160,000 Public Records
- 2023-03-06 Sold (MLS) $160,000 MAAR
- 2023-03-01 Pending — MAAR
- 2023-01-25 Contingent — MAAR
- 2023-01-19 Listed $155,000 MAAR
- 2022-05-02 Sold (Public Records) $84,619 Public Records
- 2017-03-20 Listed $84,900 MAAR
- 2016-09-08 Listed $89,900 MAAR
- 2005-07-05 Sold (MLS) $89,813 MAAR
- 2005-04-19 Listed $89,813 MAAR
- 1999-09-17 Sold (MLS) $75,500 MAAR
- 1999-07-30 Listed $78,750 MAAR
Property tax history
+19.5%/yrLatest (2024): $1,538 · +183.9% YoY. Source: county tax records.
Cash-flow waterfall
monthlySold comps — $/sqft
last 12 mo · ≤1 miLoading sold comps…