 🏗️ New Construction
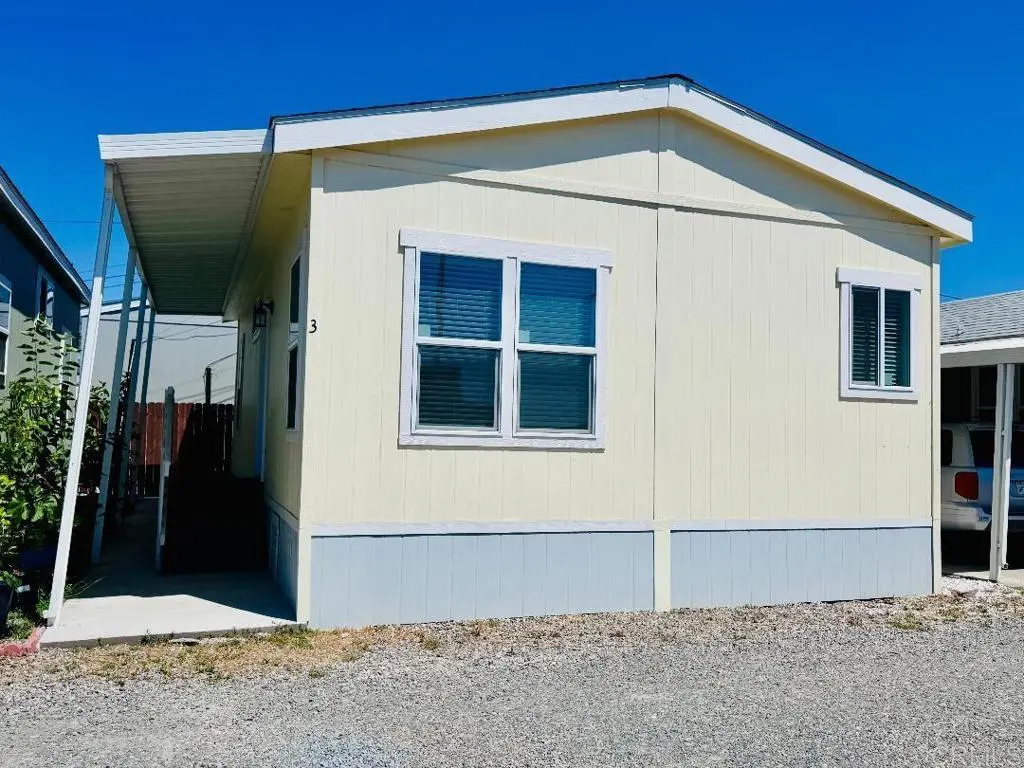
1369 E Main St #3 · El Cajon, CA
Flood risk 6/10 · Moderate
- FEMA flood zone
- X (unshaded)
- Chance of flooding over 30 yrs
- 0.68%
- Est. flood insurance / yr
- $507 – $1,088
Fire risk 2/10 · Minimal
- Est. fire insurance / yr
- $659 – $1,223
Heat risk 5/10 · Moderate
- Hot days now (above 98°F)
- 7 days/yr
- Hot days in 30 yrs
- 20 days/yr
Wind risk 1/10 · Minimal
- Chance of severe wind over 30 yrs
- —
Air-quality risk 4/10 · Minor
- Unhealthy air days now
- 6 days/yr
- Unhealthy air days in 30 yrs
- 7 days/yr
Risk factors via First Street. Map © Google.
Why this score? — see what drove the B grade
The composite is a weighted blend of 9 inputs, each scored 0–100. Each bar is that input's sub-score; the figure is the points it added to the 100-point composite (weight × sub-score).
- Cash flow +30.0/30.0
- DSCR +10.0/10.0
- 1% rule +9.3/10.0
- ARV discount +7.5/15.0
- Schools +4.0/10.0
- Condition / age +4.0/5.0
- Livability +3.5/5.0
- Rent growth +2.3/5.0
- Appreciation +0.0/10.0
$199,500
🖨 Deal sheet 📄 Offer letter ✓ Due diligence
Listing remarks
Beautiful & Brand New 2BR + 1 Full Bath Economical, Manufactured Home in All-Age Community with low space rent of $900. This home features high ceilings, an open floor plan, a spacious kitchen with ample cabinet space, upgraded stainless steel upgraded appliances, gas cooking, washer and dryer hook-ups, fans, new AC unit & much more to list. Conveniently located near grocery stores, schools, banks, the trolley, parks, and freeways, with easy access to all that beautiful San Diego has to offer. Don’t miss out on this great opportunity!
Key facts
- Open floor plan
- New ac unit
- Gas cooking
Tags
Property features AI
Finance
- Other: Built by Champion Home Builders / Skyline; Double body type; Two pads
- Financial info: Land lease of $900 per month
- HOA & community: Street lighting; Park manager approval required; Pets allowed with restrictions (size, number, breed restrictions; dogs and cats may be allowed — contact manager)
Exterior
- Parking: Assigned on-site parking; Located in Juniper park (space #3)
- Utilities: Public sewer
- Home design: Single-story; Mobile home model Amber Cove; Mobile home remains on site; Under construction (per seller)
- Construction: Mobile home dimensions approximately 20' x 35'; Built/Year source: seller
- Exterior features: Composition roof; No patio or porch; No pool; Lot estimated at 0–1 unit/acre
Interior
- Kitchen: Microwave; Refrigerator; Free-standing range
- Bathrooms: One full bathroom with bathtub and shower-in-tub
- Heating & cooling: Central heating (central furnace, forced air); Central cooling and whole-house fan
- Interior features: One-level home; Left-side and rear entry; Double-pane windows; Living room
- Laundry & utility: Washer hookup; Gas dryer hookup; Stackable laundry connections
Neighborhood map
What this means for you Summary
Snapshot
- This is a 2-bed/1.0-bath manufactured listed at $200k. Condition is rated good.
Deal economics
- At list price, monthly cash flow is $616 ($7k/yr) — positive.
- The deal already cash-flows at list — no discount required.
- Meets the 1% rule at list price ($2k rent vs $200k).
- Recommended offer: $194k (3.0% below list) — sets the bar for market timing.
- Cap rate 11.6% vs local median 2.4% in El Cajon — top-decile yield for the area; either an underpriced asset or a hidden risk that comps aren't pricing in. Stress-test before assuming the spread holds.
Location & tenants
- Location reads 70/100 on livability (#230 in CA) — a middle-class / working-renter tenant base. Strengths: amenities A+, commute A+; Watch: health & safety C-, crime D+, cost of living F.
- Grossmont Union High (suburban): math 31% / reading 60% proficiency, ranked #173 of 517 in CA (top 34%) — families likely to look elsewhere, expect single-tenant / working-renter base with shorter leases; only 17% free/reduced lunch — higher-income household profile.
- Zoned schools: El Cajon Valley High (math 22% / reading 45%, grade F, #656 of 1,170 statewide, top 57%, 1,652 students, 91% FRL) — zoned schools average 91% FRL vs 17% district-wide (74 pts higher); higher-poverty schools than district average — tighter screening recommended.
- Zoned-school proficiency averages 34% at this address vs 46% district-wide (-12 pts) — the specific schools serving this property underperform the Grossmont Union High average; the district grade overstates school quality for this exact location.
- Market conditions: Rents soft (-0.8%/yr); 238 active listings in the ZIP; 40 comparable units currently listed for rent nearby; rentals leasing fast (median 2d on market — plan ~1-2 weeks tenant-placement turnaround); 11,759 units permitted in San Diego County in 2024 (7,244 in 5+ unit buildings).
- This rent runs 32% of the median local income ($74k/yr) — at the standard rent-burdened threshold; future hikes will face affordability resistance.
Forward outlook
- Local home prices are declining (-3.0%/yr); year-one equity from $968 of loan paydown is wiped out by about $4k of value loss. Plan a longer hold.
- San Diego County population projected at +20% by 2050 — long-run rental-demand tailwind backs the buy-and-hold thesis.
- At projected returns (-3.0% appreciation + 0.0% rent growth), your $39k cash investment doubles in ~9 years — after that, you're playing with house money.
Negotiation context
- It's been on market 36 days — a 3% lower offer ($194k) is reasonable based on typical stale-listing flexibility.
Risks & watch-outs
- Climate carrying-cost: major flood risk; extreme-heat days projected 7→20/yr by 2055 (HVAC capex compounding) — expect insurance premiums to compound above CPI over the hold.
Questions for the listing agent
- It's been on market 36 days. Have you received any prior offers? Is the seller open to a 3% concession, seller financing, or rate buy-down credit?
- Is there a deadline driving the sale (1031 exchange, divorce, estate, relocation)? That informs how much negotiation room exists.
- Crime grade is D in this area — have there been break-ins, vandalism, or insurance claims at this property in the last 3 years? What carrier currently insures it and at what premium?
- What's the average days-on-market for RENTAL listings here right now (not sales)? A rising rental-DOM trend means longer vacancies and softer asking-rent achievability than the comps imply.
- What's the recent tenant-quality profile in this submarket — average credit score on applications, eviction rate, late-payment / NSF rate, and stable-employment percentage? A property-management company in the area should have these aggregated.
- How much new for-sale + rental construction is in the pipeline within 1–3 miles? Heavy new supply typically softens prices + rents 12–24 months out; constrained supply supports both.
Investment metrics
- 1% rule
- 1.43% ✓
- Cap rate
- 11.58%
- Cash-on-cash
- 18.87%
- DSCR
- 1.84
- GRM
- 5.8
CMA / ARV
- ARV (on-the-fly)
- $139,870
- Comps found
- 4
Show comp detail 4 sales within ~0.75 mi
| Address | Dist | Beds/Ba | Sqft | Sold | Price | $/sf | Match |
|---|---|---|---|---|---|---|---|
| 1425 E Madison Ave #18 | 0.15mi | 2/1.0 | 748 (+5%) | 1mo | $147,000 | $197 | 83 |
| 1174 E Main St #62 | 0.58mi | 2/2.0 | 691 (-3%) | 2mo | $175,000 | $253 | 62 |
| 187 Ballard St #15 | 0.56mi | 2/2.0 | 800 (+13%) | 1mo | $120,000 | $150 | 48 |
| 1174 E Main St Spc 92 | 0.59mi | 2/2.0 | 800 (+13%) | 10mo | $139,000 | $174 | 38 |
Match score weights: distance 35% · size 25% · config 20% · recency 20%. Top-matched comps best support the ARV.
Projected returns pro-forma
-3.0% appreciation · 0.0% rent growth · sell at horizon
- IRR
- 7.3%
- Equity multiple
- 1.27×
- Total profit
- $10,713
- Equity at exit
- $20,855
- IRR
- 13.8%
- Equity multiple
- 1.95×
- Total profit
- $37,266
- Equity at exit
- $12,093
Cash invested: $39,164 (down + closing). Projections, not guarantees.
Landlord ↔ Tenant lean methodology
- Overall (STATE)
- 18 Strongly Tenant-Friendly
- State California
- 18 Strongly Tenant-Friendly · D+13
- County
- — inherits STATE
- City
- — inherits STATE
ZIP-level market 92021
- Rents YoY
- -0.8%
- Active inventory
- 238
- Price-to-rent
- 8.3×
Monthly cashflow live
- Estimated rent
- $2,003 high interval (Pro) →
- Mortgage (P&I)
- −$733
- Tax est. 1.5%
- −$175 /mo · $2,098/yr
- Insurance
- −$58
- HOA
- −$0
- Vacancy / Maint / Mgmt
- −$421
- Net cashflow
- $616
Break-even live
UW: 25.0% down · 7.5% · 30yr · 1.5% tax · 5.0% vac · 8.0% maint · 8.0% mgmt
Financing live
Cash to close
- Down payment
- $34,968
- Closing costs
- $4,196
- Reserves months
- —
- Total cash needed
- —
Loan-product check · same deal, 3 products live
Conventional
25% down · 7.5% · 30yr
- Down + closing
- —
- Monthly P&I
- —
- Monthly cashflow
- —
- DSCR
- —
- Eligible?
- —
Personal DTI + credit; lowest rate.
DSCR
20% down · 8.5% · 30yr
- Down + closing
- —
- Monthly P&I
- —
- Monthly cashflow
- —
- DSCR
- —
- Eligible?
- —
No personal income docs; deal must DSCR.
Hard money
10% down · 12.0% · 12mo
- Down + closing
- —
- Monthly P&I
- —
- Monthly cashflow
- —
- DSCR
- —
- Eligible?
- —
Short-term bridge; refi at stabilization.
Rent comps 40 comps
| Address | Beds | Baths | Sqft | Rent | $/sqft | DOM | Units | Dist |
|---|---|---|---|---|---|---|---|---|
| 1382 Ivory Ct Unit 1382B El Cajon, CA | 1.0 | 1.0 | 550 | $1,625 | $2.95 | 1d | 1 | 0.07mi |
| 291 Jamacha Rd El Cajon, CA | 1.0–2.0 | 1.0 | 825 | $2,095 | $2.54 | 1d | 4 | 0.25mi |
| 523 Grape St El Cajon, CA | 1.0 | 1.0 | 648 | $1,695 | $2.62 | 1d | 2 | 0.26mi |
| 1360 E Madison Ave El Cajon, CA | 1.0–2.0 | 1.0 | 550 | $2,595 | $4.72 | 1d | 22 | 0.28mi |
| 301 Shady Ln El Cajon, CA | 1.0–2.0 | 1.0 | 720 | $2,250 | $3.12 | 1d | 8 | 0.32mi |
| 233 Shady Ln El Cajon, CA | 1.0 | 1.0 | 650 | $1,795 | $2.76 | 1d | 1 | 0.33mi |
| 1343 Oakdale Ave El Cajon, CA | 1.0–2.0 | 1.0–2.0 | 800 | $2,195 | $2.74 | 1d | 1 | 0.36mi |
| 421 Shady Ln El Cajon, CA | 1.0 | 1.0 | 575 | $1,708 | $2.97 | 1d | 3 | 0.37mi |
| 422 Shady Ln El Cajon, CA | 1.0–3.0 | 1.0–2.0 | 900 | $2,304 | $2.56 | 1d | 18 | 0.40mi |
| 368 Orlando St El Cajon, CA | 1.0 | 1.0 | 692 | $1,850 | $2.67 | 1d | 1 | 0.50mi |
| 368 Orlando St #21 El Cajon, CA | 1.0 | 1.0 | 692 | $1,850 | $2.67 | 10d | 1 | 0.50mi |
| 187 Ballard St El Cajon, CA | 1.0–2.0 | 1.0–2.0 | 542 | $2,150 | $3.97 | 1d | 2 | 0.53mi |
| 359 N 1st St Apt 8 El Cajon, CA | 1.0 | 1.0 | 500 | $1,575 | $3.15 | 1d | 1 | 0.73mi |
| 541 N 1st St Apt 14 El Cajon, CA | 1.0 | 1.0 | 550 | $1,550 | $2.82 | 1d | 1 | 0.77mi |
| 180 N 1st St El Cajon, CA | 1.0–2.0 | 1.0–2.0 | 830 | $2,125 | $2.56 | 1d | 3 | 0.77mi |
| 360 N 1st St El Cajon, CA | 2.0 | 2.0 | 725 | $1,995 | $2.75 | 16d | 1 | 0.78mi |
| 1546 Broadway El Cajon, CA | 1.0 | 1.0 | 625 | $1,745 | $2.79 | 1d | 1 | 0.86mi |
| 1041-89 E Lexington Ave El Cajon, CA | 1.0–2.0 | 1.0–2.0 | 838 | $2,425 | $2.89 | 1d | 8 | 0.86mi |
| 1037 E Lexington Ave El Cajon, CA | 1.0–3.0 | 1.0–2.0 | 855 | $2,225 | $2.60 | 1d | 5 | 0.90mi |
| 1018 E Lexington Ave El Cajon, CA | 1.0 | 1.0 | 670 | $1,800 | $2.69 | 1d | 1 | 0.92mi |
| 233 N Mollison Ave El Cajon, CA | 1.0–2.0 | 1.0–2.0 | 843 | $2,202 | $2.61 | 1d | 10 | 1.05mi |
| 1037 Peach Ave El Cajon, CA | 1.0 | 1.0 | 560 | $1,694 | $3.03 | 1d | 4 | 1.07mi |
| 588 S Anza St El Cajon, CA | 1.0–2.0 | 1.0 | 767 | $2,100 | $2.74 | 1d | 6 | 1.09mi |
| 545 N Mollison Ave El Cajon, CA | 2.0 | 1.0 | 700 | $2,000 | $2.86 | 7d | 9 | 1.09mi |
| 545 N Mollison Ave El Cajon, CA | 2.0 | 1.0 | 700 | $2,028 | $2.90 | 1d | 11 | 1.09mi |
| 917 E Madison Ave El Cajon, CA | 2.0 | 1.0 | 750 | $2,195 | $2.93 | 1d | 1 | 1.10mi |
| 1019 Peach Ave El Cajon, CA | 1.0–2.0 | 1.0–2.0 | 700 | $2,161 | $3.09 | 1d | 8 | 1.11mi |
| 421 S Mollison Ave El Cajon, CA | 1.0–2.0 | 1.0 | 726 | $1,900 | $2.62 | 1d | 2 | 1.13mi |
| 279 S Mollison Ave El Cajon, CA | 1.0 | 1.0 | 570 | $1,950 | $3.42 | 1d | 1 | 1.13mi |
| 280 N Mollison Ave El Cajon, CA | 1.0–2.0 | 1.0 | 825 | $2,195 | $2.66 | 1d | 1 | 1.14mi |
| 150 S Mollison Ave El Cajon, CA | 1.0 | 1.0 | 515 | $1,800 | $3.50 | 1d | 1 | 1.15mi |
| 989 Peach Ave El Cajon, CA | 1.0–3.0 | 1.0–2.0 | 845 | $2,150 | $2.54 | 1d | 11 | 1.18mi |
| 390 S Mollison Ave El Cajon, CA | 1.0 | 1.0 | 750 | $1,725 | $2.30 | 1d | 1 | 1.18mi |
| 798 McClure St Apt 7 El Cajon, CA | 1.0 | 1.0 | 570 | $1,595 | $2.80 | 1d | 1 | 1.20mi |
| 1641 Greenfield Dr Unit 1641 El Cajon, CA | 1.0 | 1.0 | 600 | $1,900 | $3.17 | 1d | 1 | 1.27mi |
| 800 N Mollison Ave #48 El Cajon, CA | 1.0 | 1.0 | 460 | $1,875 | $4.08 | 21d | 1 | 1.27mi |
| 800 N Mollison Ave #48 El Cajon, CA | 1.0 | 1.0 | 460 | $1,575 | $3.42 | 1d | 1 | 1.27mi |
| 633 E Park Ave El Cajon, CA | 1.0 | 1.0 | 650 | $1,675 | $2.58 | 10d | 1 | 1.31mi |
| 633 E Park Ave Unit 12 El Cajon, CA | 1.0 | 1.0 | 650 | $1,675 | $2.58 | 17d | 1 | 1.31mi |
| 1005 N Mollison Ave El Cajon, CA | 2.0 | 1.0 | 750 | $2,195 | $2.93 | 1d | 1 | 1.34mi |
Listing history 15 events
-
2026-06-18days on market $199,500 Active 36 DOM
-
2026-06-17days on market $199,500 Active 35 DOM
-
2026-06-16days on market $199,500 Active 34 DOM
-
2026-06-15days on market $199,500 Active 33 DOM
-
2026-06-13days on market $199,500 Active 31 DOM
-
2026-06-13days on market $199,500 Active 30 DOM
-
2026-06-09days on market $199,500 Active 27 DOM
-
2026-06-08days on market $199,500 Active 26 DOM
-
2026-06-07days on market $199,500 Active 25 DOM
-
2026-06-04days on market $199,500 Active 22 DOM
-
2026-06-03days on market $199,500 Active 21 DOM
-
2026-06-02days on market $199,500 Active 20 DOM
-
2026-06-01days on market $199,500 Active 19 DOM
-
2026-05-31days on market $199,500 Active 18 DOM
-
2026-05-13$199,500 Active
ⓘ Source: listings_history table (triggers on properties + properties_extension) + one-shot
backfill from property_details.listing_events for pre-trigger history.
Climate risk First Street
- Flood 6/10 Major FEMA zone X (unshaded) · 68% chance over 30 yrs
- Wildfire 2/10 Low
- Heat 5/10 Major 7 d/yr ≥98°F today · 20 d/yr by 30 yrs out
- Wind 1/10 Low
- Air quality 4/10 Moderate 6 unhealthy d/yr today · 7 by 30 yrs out
Nearby sold comps map
Loading sold comps map…
Walkable amenities ~0.75 mi
Loading nearby amenities…
Taxation est. · year 1
- Rental income
- $24,036
- − Mortgage interest
- −$7,835
- − Property taxes
- −$2,098
- − Insurance
- −$699
- − Repairs & maintenance
- −$1,923
- − Management
- −$1,923
- − Depreciation
- −$4,069
- Taxable income
- $5,489
- Est. tax owed @ 24.0%
- −$1,317
- After-tax cash flow
- $6,072/yr
For passive investors: Depreciation is non-cash, so a rental often shows a tax loss while cash-flowing — sheltering income. Rental losses are passive: they offset passive income freely, and up to $25,000/yr can offset ordinary (W-2) income if you actively participate and your MAGI is under $100k (phasing out to $0 by $150k); unused losses carry forward. On sale, claimed depreciation is recaptured at up to 25%, and gains may owe capital-gains tax (a 1031 exchange can defer both). Figures are a year-1 estimate at your 24.0% rate — not tax advice; consult a CPA.
Condition & rehab AI · 12 photos
This manufactured home is in excellent condition with recent upgrades and improvements, making it move-in ready and ideal for both resale and rental.
Value-add opportunities
- Both Painting exterior and interior walls — Enhances curb appeal and interior aesthetics.
- Both Landscaping and curb appeal improvements — Improves curb appeal and enhances property value.
- Both Add a small front porch or landscaping feature — Enhances curb appeal and adds value for both resale and rental.
Renovation cost estimate screening
Value-add ROI direction
- Both Painting exterior and interior walls — Enhances curb appeal and interior aesthetics. ↑
- Both Landscaping and curb appeal improvements — Improves curb appeal and enhances property value. ↑
- Both Add a small front porch or landscaping feature — Enhances curb appeal and adds value for both resale and rental. ↑
ⓘ Cost ranges are severity-bucket heuristics (US national rule-of-thumb). Get contractor quotes + a written scope before underwriting a rehab budget.
Schools (NCES district)
- District
- Grossmont Union High
- NCES district ID
- 0616230
- Math proficiency
- 31% ▼ -1.00%
- Reading proficiency
- 60% ▲ 5.00%
- Median HH income
- $61,801
- Composite
- 40.07/100
- National rank
- #3810
- State rank
- #173 of 517 in CA
Livability — El Cajon
- Score
- 70/100
- State rank
- #230
- US rank
- #7531
Category grades
Schools grade is shown separately in the Schools card above.
Census & demographics
- Census place
- El Cajon, CA
- County
- San Diego County · 3,178,799 people
- City population
- 173,694
- Metro
- San Diego-Chula Vista-Carlsbad, CA
- Population (ZIP)
- 70,501
- Household income
- $74,013
- Rent vs Own
- Severe rent burden
- 4178.0
Population outlook (San Diego County) Hauer SSP2
- Today (2025)
- 3,678,185 people
- By 2030
- 3,856,546 · +4.8%
- By 2040
- 4,171,407 · +13.4%
- By 2050
- 4,421,607 · +20.2%
- By 2075
- 4,831,599 · +31.4%
- By 2100
- 4,832,502 · +31.4%
Race, ethnicity, and origin ACS 2023
- Neighborhood character
- Diverse neighborhood (Simpson 0.62)
- Race & ethnicity
- White 54% Hispanic / Latino 28% Two or more races 14% Black 6% Asian 5% Native American 2%
- Hispanic origin (detail)
- Mexican 24%
- Common ancestry
- Arab 6% Italian 2% Lithuanian 2%
- Foreign-born
- 22% · Canada
- Languages at home
- 65% English-only · Spanish 18% Arabic 7% Other Indo-European 3%
Political lean MEDSL · San Diego
- 2024 margin
- D (+16.8) · D 56.9% · R 40.1% · Other 2.9%
- 2008→2024 swing
- +6.6pp toward D · 2008: 10.2pp · 2024: 16.8pp
- All cycles
- 2024: D+16.8 2020: D+22.8 2016: D+17.8 2012: D+5.1 2008: D+10.2
Not yet ingested
- Civics
- —
Market trends
- HPI YoY
- ▼ -654.88%
- Current HPI
- 335.0617
- Rent YoY
- ▼ -0.83%
- Metro
- San Diego-Chula Vista-Carlsbad, CA
- State GDP YoY
- ▲ 3.21%
- F500 in state
- 116
Industry mix (Fortune 500 HQ in CA)
| Industry | F500 HQs | Revenue |
|---|---|---|
| Technology | 27 | $1,492B |
|
||
| Financial Services | 3 | $174B |
|
||
| Retail | 3 | $44B |
|
||
| Insurance | 3 | $26B |
|
||
| Media / Entertainment | 2 | $115B |
|
||
| Pharmaceuticals / Biotech | 2 | $62B |
|
||
Price history
1 event — show timeline
- 2026-05-13 Listed $199,500 CRMLS
Cash-flow waterfall
monthlySold comps — $/sqft
last 12 mo · ≤1 miLoading sold comps…