 Duplex
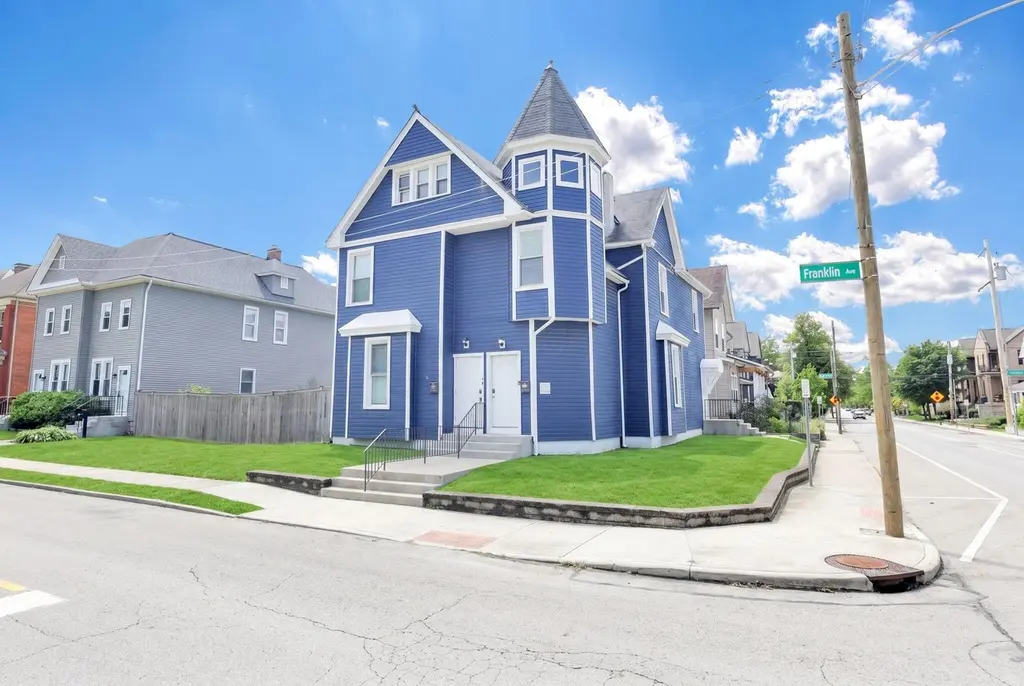
1109-1111 Franklin Ave · Columbus, OH
Flood risk 1/10 · Minimal
- FEMA flood zone
- X (unshaded)
- Chance of flooding over 30 yrs
- 0.0%
- Est. flood insurance / yr
- $473 – $860
Fire risk 1/10 · Minimal
- Est. fire insurance / yr
- $713 – $1,323
Heat risk 3/10 · Minor
- Hot days now (above 100°F)
- 7 days/yr
- Hot days in 30 yrs
- 17 days/yr
Wind risk 2/10 · Minimal
- Chance of severe wind over 30 yrs
- 1.0%
Air-quality risk 3/10 · Minor
- Unhealthy air days now
- 2 days/yr
- Unhealthy air days in 30 yrs
- 4 days/yr
Risk factors via First Street. Map © Google.
Why this score? — see what drove the C grade
The composite is a weighted blend of 9 inputs, each scored 0–100. Each bar is that input's sub-score; the figure is the points it added to the 100-point composite (weight × sub-score).
- Cash flow +22.0/30.0
- ARV discount +11.5/15.0
- DSCR +7.0/10.0
- 1% rule +5.8/10.0
- Livability +4.0/5.0
- Condition / age +4.0/5.0
- Rent growth +2.9/5.0
- Schools +1.7/10.0
- Appreciation +0.0/10.0
$399,000
🖨 Deal sheet (PDF) 📄 Offer letter ✓ Due diligence
Multi-family units
County records classify this as Multi-Family (2-4 Unit). Listing-text estimate: 2 units. confirmed
Listing remarks
Freshly renovated turnkey duplex across from new builds and future development sites. This 5bd/2ba and 2bd/1ba duplex has fully updated units with granite counters and stainless appliances. Currently vacant & perfect for house hackers or investors looking for a great investment in a great rapidly growing neighborhood. Less than a mile from Franklin Park and Trolley Barn East Market development. Market rents are $2,500+/mo for 5bd/2ba and $1,400+/mo for 2bd/1ba units. Quiet intersection street for ample street parking. Tour this while you can!
Key facts
- Turnkey duplex
- Fully updated units
- Ample street parking
Tags
Property features AI
Finance
- Financial info: Net operating income: $46,800; Owner pays water and sewer
Exterior
- Utilities: Public water; Public sewer; Natural gas available; Electricity available; Storm sewer available
- Home design: Duplex; Built in 1893 with effective year 2025
- Exterior features: Small lot (approximately 0.06 acres); Zoning: 520; No additional parcels
Interior
- Interior features: Central air conditioning; Forced air heating
Neighborhood map
What this means for you Summary
Snapshot
- This is a 1×5bd/2ba + 1×2bd/1ba units multifamily listed at $399k. Condition is rated good.
Deal economics
- At list price, monthly cash flow is $638 ($8k/yr) — positive. Per door: $319/mo.
- The deal already cash-flows at list — no discount required.
- Meets the 1% rule at list price ($4k rent vs $399k).
- Recommended offer: $387k (3.0% below list) — sets the bar for market timing.
- Cap rate 8.2% vs local median 3.8% in Columbus — top-decile yield for the area; either an underpriced asset or a hidden risk that comps aren't pricing in. Stress-test before assuming the spread holds.
Location & tenants
- Location reads 81/100 on livability (#97 in OH, #1,491 nationally) — a professional / high-income tenant draw. Strengths: commute A+, cost of living A+, housing A+; Watch: employment C-, crime F.
- Columbus City School District (urban): math 15% / reading 26% proficiency, ranked #626 of 656 in OH (top 95%) — low school quality limits family demand, transient renter base, plan for 1-2y turnover; 72% free/reduced lunch — lower-income household profile, screen leases tightly.
- Zoned schools: Indianola Informal K-8 School (math 43% / reading 58%, grade D+, #896 of 1,584 statewide, top 57%, 684 students, 0% FRL); Arts Impact Middle School (Aims) (math 17% / reading 25%, grade F, #608 of 654 statewide, top 93%, 532 students, 0% FRL); Columbus Alternative High School (math 27% / reading 74%, grade D+, #380 of 781 statewide, top 49%, 758 students, 0% FRL) — zoned schools average 0% FRL vs 72% district-wide (72 pts lower); this property's tenant base skews higher-income than the district average.
- Zoned-school proficiency averages 41% at this address vs 20% district-wide (+20 pts) — the actual schools serving this property are materially stronger than the Columbus City School District average implies; a family-tenant draw the district grade alone would hide.
- Market conditions: Rents rising (+1.4%/yr); 145 active listings in the ZIP; 17 comparable units currently listed for rent nearby; rentals at typical pace (median 26d on market — plan ~3-4 weeks tenant-placement turnaround); 41% of comp listings sitting > 30 days — soft ceiling on asking rent; 8,139 units permitted in Franklin County in 2024 (5,940 in 5+ unit buildings).
- At $4,298/mo this rent would consume 86% of the median local household income ($60k/yr) (locally 823% of renters already pay >50% of income on rent) — very limited rent-growth headroom before tenants either downsize or default.
Forward outlook
- Local home prices are declining (-3.0%/yr); year-one equity from $3k of loan paydown is wiped out by about $12k of value loss. Plan a longer hold.
- Franklin County population projected at +34% by 2050 — long-run rental-demand tailwind backs the buy-and-hold thesis.
Negotiation context
- It's been on market 45 days — a 3% lower offer ($387k) is reasonable based on typical stale-listing flexibility.
Risks & watch-outs
- Watch-outs: built in 1893 — expect roof / HVAC / electrical / plumbing capex.
Questions for the listing agent
- It's been on market 45 days. Have you received any prior offers? Is the seller open to a 3% concession, seller financing, or rate buy-down credit?
- Can we see the unit-by-unit rent roll, current vacancy, and any below-market leases? What's the average tenancy length?
- What capital expenditures (roof, boiler, parking lot, exteriors) have been made in the last 5 years, and what's planned in the next 2?
- Built in 1893 — when were the roof, HVAC, electrical panel, plumbing, and water heater last replaced?
- Is there a deadline driving the sale (1031 exchange, divorce, estate, relocation)? That informs how much negotiation room exists.
- Crime grade is F in this area — have there been break-ins, vandalism, or insurance claims at this property in the last 3 years? What carrier currently insures it and at what premium?
- What's the average days-on-market for RENTAL listings here right now (not sales)? A rising rental-DOM trend means longer vacancies and softer asking-rent achievability than the comps imply.
- What's the recent tenant-quality profile in this submarket — average credit score on applications, eviction rate, late-payment / NSF rate, and stable-employment percentage? A property-management company in the area should have these aggregated.
- How much new apartment / multifamily construction is in the pipeline within 1–3 miles? Heavy new supply (>2% of stock underway) typically softens rents 12–24 months out; light construction supports rent growth.
Investment metrics
- 1% rule
- 1.08% ✓
- Cap rate
- 8.21%
- Cash-on-cash
- 6.85%
- DSCR
- 1.30
- GRM
- 7.7
CMA / ARV
- ARV (median comp)
- $437,768
- List price
- $399,000
- Delta
- -8.86%
- Verdict
- FAIR
- Comps
- 20 within 1.0 mi
Show comp detail 6 sales within ~0.75 mi
| Address | Dist | Beds/Ba | Sqft | Sold | Price | $/sf | Match |
|---|---|---|---|---|---|---|---|
| 100 S Seventeeth St #3 | 0.38mi | 5/— (+1) | 2,816 (-9%) | 2mo | $445,000 | $158 | 61 |
| 1252-1254 Eastwood Ave | 0.46mi | 5/— (+1) | 3,024 (-2%) | 14mo | $431,000 | $143 | 59 |
| 143 S Monroe Ave #145 | 0.46mi | 5/— (+1) | 3,363 (+9%) | 3mo | $350,000 | $104 | 55 |
| 384-386 S 22nd St | 0.30mi | 3/— (-1) | 3,321 (+8%) | 22mo | $422,500 | $127 | 50 |
| 244-246 N Monroe Ave | 0.71mi | 4/— | 2,880 (-6%) | 13mo | $351,000 | $122 | 46 |
| 664 S Champion Ave | 0.68mi | 5/— (+1) | 2,858 (-7%) | 20mo | $465,000 | $163 | 34 |
Match score weights: distance 35% · size 25% · config 20% · recency 20%. Top-matched comps best support the ARV.
Projected returns pro-forma
-3.0% appreciation · 1.43% rent growth · sell at horizon
- IRR
- -7.6%
- Equity multiple
- 0.73×
- Total profit
- $-30,640
- Equity at exit
- $59,492
- IRR
- -0.1%
- Equity multiple
- 0.99×
- Total profit
- $-671
- Equity at exit
- $34,498
Cash invested: $111,720 (down + closing). Projections, not guarantees.
Landlord ↔ Tenant lean methodology
- Overall (STATE)
- 73 Landlord-Friendly
- State Ohio
- 73 Landlord-Friendly · R+6
- County
- — inherits STATE
- City
- — inherits STATE
ZIP-level market 43205
- Rents YoY
- 1.4%
- Active inventory
- 145
- Price-to-rent
- 13.1×
Monthly cashflow live
- Estimated rent
- $4,298 high interval (Pro) →
- Mortgage (P&I)
- −$2,092
- Tax est. 1.5%
- −$499 /mo · $5,985/yr
- Insurance
- −$166
- HOA
- −$0
- Vacancy / Maint / Mgmt
- −$903
- Net cashflow
- $638
Break-even live
Sensitivity live
| Price | -10% $914 | -5% $776 | +0% $638 | +5% $500 | +10% $362 |
|---|---|---|---|---|---|
| Rent | -10% $298 | -5% $468 | +0% $638 | +5% $808 | +10% $978 |
| Rate | -1.0pp $839 | -0.5pp $740 | base $638 | +0.5pp $535 | +1.0pp $429 |
2-unit breakdown (identical units grouped — click to expand)
| Units | Beds | Baths | Est. rent |
|---|---|---|---|
| 1× unit | 5 | 2 | $2,531 |
| 1× unit | 2 | 1 | $1,766 |
| Total (2 units) | $4,298 | ||
UW: 25.0% down · 7.5% · 30yr · 1.5% tax · 5.0% vac · 8.0% maint · 8.0% mgmt
Financing live
Cash to close
- Down payment
- $99,750
- Closing costs
- $11,970
- Reserves months
- —
- Total cash needed
- —
Loan-product check · same deal, 3 products live
Conventional
25% down · 7.5% · 30yr
- Down + closing
- —
- Monthly P&I
- —
- Monthly cashflow
- —
- DSCR
- —
- Eligible?
- —
Personal DTI + credit; lowest rate.
DSCR
20% down · 8.5% · 30yr
- Down + closing
- —
- Monthly P&I
- —
- Monthly cashflow
- —
- DSCR
- —
- Eligible?
- —
No personal income docs; deal must DSCR.
Hard money
10% down · 12.0% · 12mo
- Down + closing
- —
- Monthly P&I
- —
- Monthly cashflow
- —
- DSCR
- —
- Eligible?
- —
Short-term bridge; refi at stabilization.
Rent comps 17 comps
| Address | Beds | Baths | Sqft | Rent | $/sqft | DOM | Units | Dist |
|---|---|---|---|---|---|---|---|---|
| 965 E Rich St Unit 965 Columbus, OH | 3.0 | 1.0 | 2184 | $1,600 | $0.73 | 25d | 1 | 0.29mi |
| 1402 Fair Ave Columbus, OH | 3.0 | 2.5 | 2563 | $2,350 | $0.92 | 17d | 1 | 0.40mi |
| 1445 E Broad St Columbus, OH | 1.0–5.0 | 1.0–5.0 | 2164 | $2,835 | $1.31 | 3d | 4 | 0.48mi |
| 78 Auburn Ave Columbus, OH | 5.0 | 3.5 | 2799 | $3,950 | $1.41 | 3d | 1 | 0.53mi |
| 1479-1481 Bryden Rd Columbus, OH | 4.0 | 1.5 | 2604 | $1,750 | $0.67 | 45d | 1 | 0.54mi |
| 703 Franklin Ave Columbus, OH | 4.0 | 3.5 | 3250 | $4,995 | $1.54 | 25d | 1 | 0.61mi |
| 683 S Champion Ave Unit 683 Columbus, OH | 3.0 | 1.0 | 2728 | $1,700 | $0.62 | 45d | 1 | 0.73mi |
| 698 S 22nd St Columbus, OH | 3.0 | 3.5 | 2400 | $2,500 | $1.04 | 45d | 1 | 0.79mi |
| 417 Morrison Ave Columbus, OH | 4.0 | 1.5 | 3348 | $2,000 | $0.60 | 12d | 1 | 0.82mi |
| 1619 E Main St Columbus, OH | 4.0 | 2.5 | 3946 | $1,900 | $0.48 | 45d | 1 | 0.82mi |
| 890 E Livingston Ave #892 Columbus, OH | 3.0 | 1.0 | 2430 | $1,400 | $0.58 | 14d | 1 | 0.86mi |
| 368 N Garfield Ave Unit 370 Columbus, OH | 3.0 | 2.0 | 3612 | $2,000 | $0.55 | 5d | 1 | 0.87mi |
| 1214 Atcheson St #1216 Columbus, OH | 3.0 | 1.5 | 2613 | $1,600 | $0.61 | 45d | 1 | 0.88mi |
| 1756 Oak St Columbus, OH | 4.0 | 2.0 | 2425 | $5,200 | $2.14 | 3d | 1 | 0.90mi |
| 533 Fairwood Ave Columbus, OH | 4.0 | 2.0 | 2410 | $2,475 | $1.03 | 45d | 1 | 0.97mi |
| 883 Studer Ave Columbus, OH | 4.0 | 2.5 | 2217 | $2,500 | $1.13 | 3d | 1 | 1.01mi |
| 310 E Beck St Columbus, OH | 3.0 | 2.5 | 2265 | $3,995 | $1.76 | 45d | 1 | 1.31mi |
Listing history 16 events
-
2026-06-21days on market $399,000 Active 45 DOM
-
2026-06-18days on market $399,000 Active 42 DOM
-
2026-06-17days on market $399,000 Active 41 DOM
-
2026-06-16days on market $399,000 Active 40 DOM
-
2026-06-15days on market $399,000 Active 39 DOM
-
2026-06-13days on market $399,000 Active 37 DOM
-
2026-06-13days on market $399,000 Active 36 DOM
-
2026-06-09days on market $399,000 Active 33 DOM
-
2026-06-08days on market $399,000 Active 32 DOM
-
2026-06-07days on market $399,000 Active 31 DOM
-
2026-06-05days on market $399,000 Active 28 DOM
-
2026-06-03days on market $399,000 Active 27 DOM
-
2026-06-02days on market $399,000 Active 26 DOM
-
2026-06-01days on market $399,000 Active 25 DOM
-
2026-05-31days on market $399,000 Active 24 DOM
-
2026-05-07$399,000 Active 554-char remark
ⓘ Source: listings_history table (triggers on properties + properties_extension) + one-shot
backfill from property_details.listing_events for pre-trigger history.
Climate risk First Street
- Flood 1/10 Low FEMA zone X (unshaded) · 0% chance over 30 yrs
- Wildfire 1/10 Low
- Heat 3/10 Moderate 7 d/yr ≥100°F today · 17 d/yr by 30 yrs out
- Wind 2/10 Low 100% chance of damaging wind over 30 yrs
- Air quality 3/10 Moderate 2 unhealthy d/yr today · 4 by 30 yrs out
Nearby sold comps map
Loading sold comps map…
Walkable amenities ~0.75 mi
Loading nearby amenities…
Taxation est. · year 1
- Rental income
- $51,576
- − Mortgage interest
- −$22,350
- − Property taxes
- −$5,985
- − Insurance
- −$1,995
- − Repairs & maintenance
- −$4,126
- − Management
- −$4,126
- − Depreciation
- −$11,607
- Taxable income
- $1,386
- Est. tax owed @ 24.0%
- −$333
- After-tax cash flow
- $7,324/yr
For passive investors: Depreciation is non-cash, so a rental often shows a tax loss while cash-flowing — sheltering income. Rental losses are passive: they offset passive income freely, and up to $25,000/yr can offset ordinary (W-2) income if you actively participate and your MAGI is under $100k (phasing out to $0 by $150k); unused losses carry forward. On sale, claimed depreciation is recaptured at up to 25%, and gains may owe capital-gains tax (a 1031 exchange can defer both). Figures are a year-1 estimate at your 24.0% rate — not tax advice; consult a CPA.
Condition & rehab AI · 14 photos
This freshly renovated and move-in-ready duplex is in good condition with updated kitchens and bathrooms. It is located in a rapidly growing neighborhood with ample street parking and future development sites nearby.
Value-add opportunities
- Both Painting the exterior siding and repainting the interior walls — Fresh paint can enhance the curb appeal and interior aesthetics, making the property more attractive to potential buyers and renters.
- Both Upgrading the flooring to a more durable material — Replacing the hardwood flooring with a more durable material like laminate or vinyl can increase the property's value and appeal to a wider range of buyers and renters.
Renovation cost estimate screening
Value-add ROI direction
- Both Painting the exterior siding and repainting the interior walls — Fresh paint can enhance the curb appeal and interior aesthetics, making the property more attractive to potential buyers and renters. ↑
- Both Upgrading the flooring to a more durable material — Replacing the hardwood flooring with a more durable material like laminate or vinyl can increase the property's value and appeal to a wider range of buyers and renters. ↑
ⓘ Cost ranges are severity-bucket heuristics (US national rule-of-thumb). Get contractor quotes + a written scope before underwriting a rehab budget.
Schools (NCES district)
- District
- Columbus City School District
- NCES district ID
- 3904380
- Math proficiency
- 15% ▼ -17.00%
- Reading proficiency
- 26% ▼ -12.00%
- Median HH income
- $38,483
- Composite
- 17.19/100
- National rank
- #9105
- State rank
- #626 of 656 in OH
Livability — Columbus
- Score
- 81/100
- State rank
- #97
- US rank
- #1491
Category grades
Schools grade is shown separately in the Schools card above.
Census & demographics
- Census place
- Columbus, OH
- County
- Franklin County · 1,351,780 people
- City population
- 612,189
- Metro
- Columbus, OH
- Population (ZIP)
- 12,618
- Household income
- $60,181
- Rent vs Own
- Severe rent burden
- 823.0
Population outlook (Franklin County) Hauer SSP2
- Today (2025)
- 1,456,139 people
- By 2030
- 1,556,890 · +6.9%
- By 2040
- 1,757,349 · +20.7%
- By 2050
- 1,950,539 · +34.0%
- By 2075
- 2,376,171 · +63.2%
- By 2100
- 2,636,796 · +81.1%
Race, ethnicity, and origin ACS 2023
- Neighborhood character
- Diverse neighborhood (Simpson 0.60)
- Race & ethnicity
- Black 47% White 42% Two or more races 7% Hispanic / Latino 3% Asian 1%
- Common ancestry
- Lithuanian 2% Slovak 2% Romanian 2%
- Foreign-born
- 3% · Canada
- Languages at home
- 95% English-only · Spanish 1% Other Asian/Pacific 1% Other Indo-European 1%
Political lean MEDSL · Franklin
- 2024 margin
- Strong D (+28.4) · D 63.7% · R 35.3% · Other 1.0%
- 2008→2024 swing
- +7.7pp toward D · 2008: 20.7pp · 2024: 28.4pp
- All cycles
- 2024: D+28.4 2020: D+31.4 2016: D+25.9 2012: D+21.7 2008: D+20.7
Not yet ingested
- Civics
- —
Market trends
- HPI YoY
- ▼ -282.36%
- Current HPI
- 212.5692
- Rent YoY
- ▲ 1.43%
- Metro
- Columbus, OH
- State GDP YoY
- ▲ 1.98%
- F500 in state
- 48
Industry mix (Fortune 500 HQ in OH)
| Industry | F500 HQs | Revenue |
|---|---|---|
| Insurance | 3 | $145B |
|
||
| Industrial Machinery | 3 | $49B |
|
||
| Financial Services | 3 | $24B |
|
||
| Consumer Goods | 2 | $93B |
|
||
| Aerospace / Defense | 2 | $47B |
|
||
| Utilities | 2 | $33B |
|
||
Price history
1 event — show timeline
- 2026-05-07 Listed $399,000 CBRMLS
Cash-flow waterfall
monthlySold comps — $/sqft
last 12 mo · ≤1 miLoading sold comps…