 Duplex
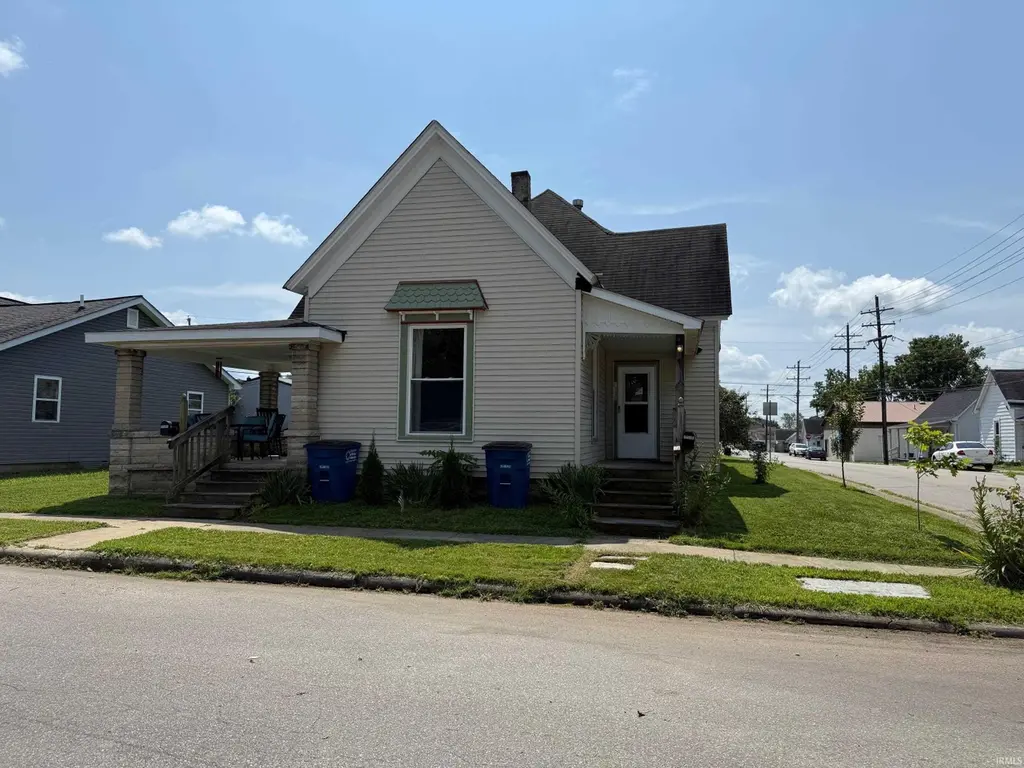
1718 & 1720 12th St · Bedford, IN
Flood risk 1/10 · Minimal
- FEMA flood zone
- X (unshaded)
- Chance of flooding over 30 yrs
- 0.0%
- Est. flood insurance / yr
- $507 – $1,088
Fire risk 1/10 · Minimal
- Est. fire insurance / yr
- $717 – $1,331
Heat risk 4/10 · Minor
- Hot days now (above 104°F)
- 7 days/yr
- Hot days in 30 yrs
- 19 days/yr
Wind risk 2/10 · Minimal
- Chance of severe wind over 30 yrs
- 1.0%
Air-quality risk 2/10 · Minimal
- Unhealthy air days now
- 0 days/yr
- Unhealthy air days in 30 yrs
- 1 days/yr
Risk factors via First Street. Map © Google.
Why this score? — see what drove the C+ grade
The composite is a weighted blend of 9 inputs, each scored 0–100. Each bar is that input's sub-score; the figure is the points it added to the 100-point composite (weight × sub-score).
- Cash flow +26.6/30.0
- DSCR +9.1/10.0
- 1% rule +6.9/10.0
- ARV discount +6.1/15.0
- Livability +4.0/5.0
- Schools +3.2/10.0
- Rent growth +2.5/5.0
- Condition / age +2.5/5.0
- Appreciation +0.0/10.0
$165,000
🖨 Deal sheet (PDF) 📄 Offer letter ✓ Due diligence
Multi-family units
County records classify this as Multi-Family (2-4 Unit). Listing-text estimate: 2 units. confirmed
Listing remarks MLS
Wonderful opportunity for a first time investor or that person who wants to start building equity for themselves! Live in one side and continue renting the other side. This 1 bedroom, 1 bath duplex is in a great part of town and is waiting on it's next chapter. 1718 side is currently rented for $665 per month with a long term tenant. 1720 is currently vacant and can be rented or would be great for an owner who is looking for this kind of opportunity. Both sides are well maintained, have separate, tenant paid utilities and are ready to go. The property is being sold "as is", the lease on 1718 is currently on a month to month and the washer & dryer are excluded as they belong to the tenant. 24 hour notice is required for 1718, 1720 is readily available. Also please do not take additional pictures of the interior side of 1718.
Key facts
- 5,227 sq ft lot
- Built 1900
- Listed 307 days
Neighborhood map
What this means for you Summary
Snapshot
- This is a 2 × 2-bed/2.0-bath units multifamily listed at $165k.
Deal economics
- At list price, monthly cash flow is $443 ($5k/yr) — positive. Per door: $222/mo.
- The deal already cash-flows at list — no discount required.
- Meets the 1% rule at list price ($2k rent vs $165k).
- Recommended offer: $145k (12.0% below list) — sets the bar for market timing.
- Cap rate 9.5% vs local median 4.1% in Bedford — top-decile yield for the area; either an underpriced asset or a hidden risk that comps aren't pricing in. Stress-test before assuming the spread holds.
Location & tenants
- Location reads 80/100 on livability (#23 in IN, #1,958 nationally) — a professional / high-income tenant draw. Strengths: crime A+, cost of living A+, housing A+; Watch: employment D, commute F.
- North Lawrence Community Schools (rural): math 35% / reading 40% proficiency, ranked #170 of 301 in IN (top 56%) — families likely to look elsewhere, expect single-tenant / working-renter base with shorter leases.
- Zoned schools: Parkview Elementary School (math 44% / reading 39%, grade F, #478 of 994 statewide, top 49%, 513 students, 63% FRL); Bedford Middle School (math 23% / reading 36%, grade F, #212 of 330 statewide, top 67%, 562 students, 54% FRL); Bedford-North Lawrence High School (math 38% / reading 63%, grade D+, #117 of 369 statewide, top 32%, 1,303 students, 46% FRL).
- Market conditions: 160 active listings in the ZIP; 2 comparable units currently listed for rent nearby; 8 units permitted in Lawrence County in 2024 (0 in 5+ unit buildings).
- This rent runs 35% of the median local income ($68k/yr) — at the standard rent-burdened threshold; future hikes will face affordability resistance.
Forward outlook
- Local home prices are declining (-3.0%/yr); year-one equity from $1k of loan paydown is wiped out by about $5k of value loss. Plan a longer hold.
- Lawrence County population projected at -14% by 2050 — secular population decline; favor cash flow + early exit over multi-decade hold.
- At projected returns (-3.0% appreciation + 3.0% rent growth), your $46k cash investment doubles in ~10 years — after that, you're playing with house money.
Negotiation context
- It's been on market 307 days — a 12% lower offer ($145k) is reasonable based on typical stale-listing flexibility.
- 3 sale attempts since 3y ago with the ask held roughly flat each time — persistent listings suggest the price (not the market) is what's stuck; bring a comps-based counter.
- Current owner paid $46k; list at $165k implies a 259% gain — meaningful room to come down on a strong offer.
Risks & watch-outs
- Watch-outs: built in 1900 — expect roof / HVAC / electrical / plumbing capex.
Questions for the listing agent
- It's been on market 307 days. Have you received any prior offers? Is the seller open to a 12% concession, seller financing, or rate buy-down credit?
- Can we see the unit-by-unit rent roll, current vacancy, and any below-market leases? What's the average tenancy length?
- What capital expenditures (roof, boiler, parking lot, exteriors) have been made in the last 5 years, and what's planned in the next 2?
- Built in 1900 — when were the roof, HVAC, electrical panel, plumbing, and water heater last replaced?
- Why hasn't it sold? Are there any deal-killer items the seller is aware of (foundation, flood, title, zoning, code violations)?
- Is there a deadline driving the sale (1031 exchange, divorce, estate, relocation)? That informs how much negotiation room exists.
- What's the average days-on-market for RENTAL listings here right now (not sales)? A rising rental-DOM trend means longer vacancies and softer asking-rent achievability than the comps imply.
- What's the recent tenant-quality profile in this submarket — average credit score on applications, eviction rate, late-payment / NSF rate, and stable-employment percentage? A property-management company in the area should have these aggregated.
- How much new apartment / multifamily construction is in the pipeline within 1–3 miles? Heavy new supply (>2% of stock underway) typically softens rents 12–24 months out; light construction supports rent growth.
Investment metrics
- 1% rule
- 1.19% ✓
- Cap rate
- 9.52%
- Cash-on-cash
- 11.51%
- DSCR
- 1.51
- GRM
- 7.0
CMA / ARV
- ARV (median comp)
- $159,875
- List price
- $165,000
- Delta
- 3.21%
- Verdict
- FAIR
- Comps
- 2 within 2.0 mi
Projected returns pro-forma
-3.0% appreciation · 3.0% rent growth · sell at horizon
- IRR
- 0.8%
- Equity multiple
- 1.03×
- Total profit
- $1,495
- Equity at exit
- $24,602
- IRR
- 10.5%
- Equity multiple
- 1.82×
- Total profit
- $37,694
- Equity at exit
- $14,266
Cash invested: $46,200 (down + closing). Projections, not guarantees.
Landlord ↔ Tenant lean methodology
- Overall (STATE)
- 90 Strongly Landlord-Friendly
- State Indiana
- 90 Strongly Landlord-Friendly · R+11
- County
- — inherits STATE
- City
- — inherits STATE
ZIP-level market 47421
- Home prices YoY
- -25.2%
- Active inventory
- 160
- Price-to-rent
- 13.9×
Monthly cashflow live
- Estimated rent
- $1,971 medium interval (Pro) →
- Mortgage (P&I)
- −$865
- Tax from tax record
- −$180 /mo · $2,160/yr
- Insurance
- −$69
- HOA
- −$0
- Vacancy / Maint / Mgmt
- −$414
- Net cashflow
- $443
Break-even live
Sensitivity live
| Price | -10% $536 | -5% $490 | +0% $443 | +5% $396 | +10% $350 |
|---|---|---|---|---|---|
| Rent | -10% $287 | -5% $365 | +0% $443 | +5% $521 | +10% $599 |
| Rate | -1.0pp $526 | -0.5pp $485 | base $443 | +0.5pp $400 | +1.0pp $357 |
2-unit breakdown (identical units grouped — click to expand)
| Units | Beds | Baths | Est. rent |
|---|---|---|---|
| 2× units | 2 | 2 | $1,972 |
| #1 | 2 | 2 | $986 |
| #2 | 2 | 2 | $986 |
| Total (2 units) | $1,971 | ||
UW: 25.0% down · 7.5% · 30yr · 1.5% tax · 5.0% vac · 8.0% maint · 8.0% mgmt
Financing live
Cash to close
- Down payment
- $41,250
- Closing costs
- $4,950
- Reserves months
- —
- Total cash needed
- —
Loan-product check · same deal, 3 products live
Conventional
25% down · 7.5% · 30yr
- Down + closing
- —
- Monthly P&I
- —
- Monthly cashflow
- —
- DSCR
- —
- Eligible?
- —
Personal DTI + credit; lowest rate.
DSCR
20% down · 8.5% · 30yr
- Down + closing
- —
- Monthly P&I
- —
- Monthly cashflow
- —
- DSCR
- —
- Eligible?
- —
No personal income docs; deal must DSCR.
Hard money
10% down · 12.0% · 12mo
- Down + closing
- —
- Monthly P&I
- —
- Monthly cashflow
- —
- DSCR
- —
- Eligible?
- —
Short-term bridge; refi at stabilization.
Rent comps 2 comps
| Address | Beds | Baths | Sqft | Rent | $/sqft | DOM | Units | Dist |
|---|---|---|---|---|---|---|---|---|
| 2115 G St Bedford, IN | 3.0 | 2.0 | 1500 | $1,750 | $1.17 | 22d | 1 | 1.07mi |
| 100 Shawnee Dr Bedford, IN | 1.0–3.0 | 1.0–2.0 | 553 | $1,098 | $1.98 | 22d | 6 | 1.46mi |
Listing history 23 events
-
2026-06-22days on market $165,000 Active 307 DOM
-
2026-06-19days on market $165,000 Active 305 DOM
-
2026-06-18days on market $165,000 Active 304 DOM
-
2026-06-17days on market $165,000 Active 303 DOM
-
2026-06-16days on market $165,000 Active 302 DOM
-
2026-06-15days on market $165,000 Active 301 DOM
-
2026-06-14days on market $165,000 Active 299 DOM
-
2026-06-13days on market $165,000 Active 298 DOM
-
2026-06-10days on market $165,000 Active 296 DOM
-
2026-06-09days on market $165,000 Active 295 DOM
-
2026-06-08days on market $165,000 Active 294 DOM
-
2026-06-07days on market $165,000 Active 293 DOM
-
2026-06-05days on market $165,000 Active 290 DOM
-
2026-06-03days on market $165,000 Active 289 DOM
-
2026-06-02days on market $165,000 Active 288 DOM
-
2026-06-01days on market $165,000 Active 287 DOM
-
2026-05-31days on market $165,000 Active 286 DOM
-
2026-05-30days on market $165,000 Active 285 DOM
-
2025-08-18$165,000 Active 852-char remark
Show marketing remark (852 chars)
Wonderful opportunity for a first time investor or that person who wants to start building equity for themselves! Live in one side and continue renting the other side. This 1 bedroom, 1 bath duplex is in a great part of town and is waiting on it's next chapter. 1718 side is currently rented for $665 per month with a long term tenant. 1720 is currently vacant and can be rented or would be great for an owner who is looking for this kind of opportunity. Both sides are well maintained, have separate, tenant paid utilities and are ready to go. The property is being sold "as is", the lease on 1718 is currently on a month to month and the washer & dryer are excluded as they belong to the tenant. 24 hour notice is required for 1718, 1720 is readily available. Also please do not take additional pictures of the interior side of 1718.
-
2024-05-16$166,900 Active
-
2023-05-24$164,900 Active
-
2023-05-19historical
-
2012-02-15soldstatus $46,000
ⓘ Source: listings_history table (triggers on properties + properties_extension) + one-shot
backfill from property_details.listing_events for pre-trigger history.
Tax reassessment forecast IN · Partial reset (capped growth)
- Current annual tax
- $2,160 · $180/mo
- Projected year-2 tax
- $2,160 · $180/mo
- Expected delta
- $0/yr ($0/mo · 0.0%)
ⓘ Screening estimate from a state-policy table — verify with the county assessor before closing.
Climate risk First Street
- Flood 1/10 Low FEMA zone X (unshaded) · 0% chance over 30 yrs
- Wildfire 1/10 Low
- Heat 4/10 Moderate 7 d/yr ≥104°F today · 19 d/yr by 30 yrs out
- Wind 2/10 Low 100% chance of damaging wind over 30 yrs
- Air quality 2/10 Low 0 unhealthy d/yr today · 1 by 30 yrs out
Nearby sold comps map
Loading sold comps map…
Walkable amenities ~0.75 mi
Loading nearby amenities…
Taxation est. · year 1
- Rental income
- $23,652
- − Mortgage interest
- −$9,243
- − Property taxes
- −$2,160
- − Insurance
- −$825
- − Repairs & maintenance
- −$1,892
- − Management
- −$1,892
- − Depreciation
- −$4,800
- Taxable income
- $2,840
- Est. tax owed @ 24.0%
- −$682
- After-tax cash flow
- $4,635/yr
For passive investors: Depreciation is non-cash, so a rental often shows a tax loss while cash-flowing — sheltering income. Rental losses are passive: they offset passive income freely, and up to $25,000/yr can offset ordinary (W-2) income if you actively participate and your MAGI is under $100k (phasing out to $0 by $150k); unused losses carry forward. On sale, claimed depreciation is recaptured at up to 25%, and gains may owe capital-gains tax (a 1031 exchange can defer both). Figures are a year-1 estimate at your 24.0% rate — not tax advice; consult a CPA.
Schools (NCES district)
- District
- North Lawrence Community Schools
- NCES district ID
- 1807860
- Math proficiency
- 35% ▼ -2.00%
- Reading proficiency
- 40% ▼ -3.00%
- Median HH income
- $44,566
- Composite
- 31.88/100
- National rank
- #5864
- State rank
- #170 of 301 in IN
Livability — Bedford
- Score
- 80/100
- State rank
- #23
- US rank
- #1958
Category grades
Schools grade is shown separately in the Schools card above.
Census & demographics
- Census place
- Bedford, IN
- County
- Lawrence County · 27,599 people
- City population
- 27,599
- Metro
- Bedford, IN
- Population (ZIP)
- 27,599
- Household income
- $68,108
- Rent vs Own
- Severe rent burden
- 507.0
Population outlook (Lawrence County) Hauer SSP2
- Today (2025)
- 44,347 people
- By 2030
- 43,331 · -2.3%
- By 2040
- 40,887 · -7.8%
- By 2050
- 38,297 · -13.6%
- By 2075
- 32,479 · -26.8%
- By 2100
- 26,051 · -41.3%
Race, ethnicity, and origin ACS 2023
- Neighborhood character
- Predominantly White (94%)
- Race & ethnicity
- White 94% Two or more races 4% Hispanic / Latino 2%
- Common ancestry
- Slovak 3% Italian 2% Scotch-Irish 1%
- Foreign-born
- 1% · Canada
- Languages at home
- 99% English-only · Spanish 1%
Political lean MEDSL · Lawrence
- 2024 margin
- Solid R (+51.0) · D 23.6% · R 74.6% · Other 1.7%
- 2008→2024 swing
- -30.5pp toward R · 2008: -20.6pp · 2024: -51.0pp
- All cycles
- 2024: R+51.0 2020: R+50.6 2016: R+51.5 2012: R+32.8 2008: R+20.6
Not yet ingested
- Civics
- —
Market trends
- HPI YoY
- ▼ -81.32%
- Current HPI
- 240.959
- Rent YoY
- —
- Metro
- Bedford, IN
- State GDP YoY
- ▲ 2.90%
- F500 in state
- 18
Industry mix (Fortune 500 HQ in IN)
| Industry | F500 HQs | Revenue |
|---|---|---|
| Industrial Machinery | 2 | $37B |
|
||
| Healthcare | 1 | $177B |
|
||
| Pharmaceuticals | 1 | $45B |
|
||
| Metals / Steel | 1 | $18B |
|
||
| Agriculture | 1 | $17B |
|
||
| Packaging | 1 | $12B |
|
||
Price history
+258.7% since first listed5 events — show timeline
- 2025-08-18 Listed $165,000 IRMLS
- 2024-05-16 Listed $166,900 IRMLS
- 2023-05-24 Listed $164,900 IRMLS
- 2023-05-19 Coming Soon — IRMLS
- 2012-02-15 Sold (Public Records) $46,000 Public Records
Property tax history
-0.6%/yrLatest (2025): $2,160 · +6.0% YoY. Source: county tax records.
Cash-flow waterfall
monthlySold comps — $/sqft
last 12 mo · ≤1 miLoading sold comps…