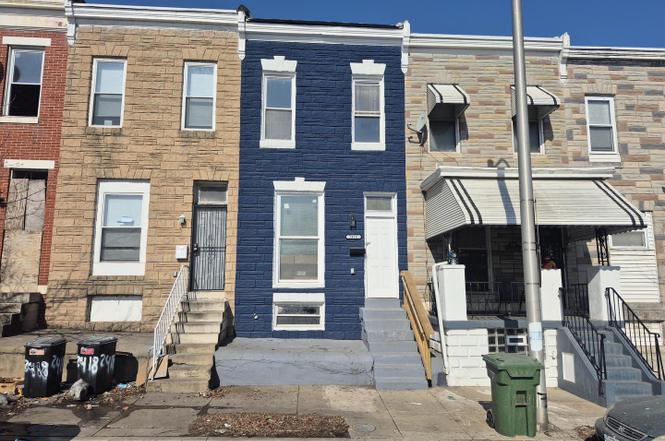
2416 Frederick Ave · Baltimore, MD
Flood risk 9/10 · Severe
- FEMA flood zone
- X (unshaded)
- Chance of flooding over 30 yrs
- 0.99%
- Est. flood insurance / yr
- $473 – $860
Fire risk 1/10 · Minimal
- Est. fire insurance / yr
- $755 – $1,403
Heat risk 8/10 · Major
- Hot days now (above 103°F)
- 7 days/yr
- Hot days in 30 yrs
- 15 days/yr
Wind risk 6/10 · Moderate
- Chance of severe wind over 30 yrs
- 27.0%
Air-quality risk 3/10 · Minor
- Unhealthy air days now
- 3 days/yr
- Unhealthy air days in 30 yrs
- 4 days/yr
Risk factors via First Street. Map © Google.
Why this score? — see what drove the D grade
The composite is a weighted blend of 9 inputs, each scored 0–100. Each bar is that input's sub-score; the figure is the points it added to the 100-point composite (weight × sub-score).
- Cash flow +15.0/30.0
- ARV discount +7.5/15.0
- 1% rule +5.0/10.0
- DSCR +5.0/10.0
- Rent growth +4.4/5.0
- Livability +3.8/5.0
- Condition / age +2.5/5.0
- Schools +1.0/10.0
- Appreciation +0.0/10.0
$25,000
🖨 Deal sheet 📄 Offer letter ✓ Due diligence
Listing remarks
ONLINE AUCTION: This auction takes place on the Ashland Auction Group website bidding platform. Bidding begins 6/18/2026, 10:00 AM. Bidding ends 6/22/2026, 12:10 PM. The list price is the suggested opening bid. Deposit: $5,000. This two-story, updated townhouse is located in the Shipley Hill neighborhood of Baltimore City. Residents can enjoy the nearby attractions and facilities such as the Gwynn Falls Trail, Westside Shopping Center, Grace Medical Center, West Baltimore MARC Station, and Carroll Park. The property is vacant. The area provides easy access to the major traffic artery, Frederick Ave, which connects to other parts of West Baltimore and downtown.
Key facts
- Updated townhouse
- Gwynn falls trail
- Two story
Tags
Property features AI
Finance
- Other: Annual ground rent noted in income/expense list
- Financial info: Ground rent $65 paid semi-annually; Ownership interest: ground rent
Exterior
- Parking: On-street parking
- Utilities: Public water; Public sewer
- Home design: Interior townhouse/rowhouse; Brick construction
- Construction: Brick construction; Other type of foundation; Above-grade and below-grade structures; Unfinished below-grade area (630 sq ft)
- Exterior features: Lot dimensions approximately 13'8" x 80'; Ground rent applies (paid semi-annually)
Interior
- Bedrooms: Two bedrooms on the first upper level
- Bathrooms: One full bathroom (all upper levels)
- Heating & cooling: Forced air heating; Electric cooling; Natural gas fuel for heating
- Interior features: Unfinished basement; Finished living area measured from assessor
Neighborhood map
What this means for you Summary
Snapshot
- This is a 2-bed/1.0-bath townhouse listed at $25k.
Deal economics
- At list price, monthly cash flow is $945 ($11k/yr) — positive.
- The deal already cash-flows at list — no discount required.
- Meets the 1% rule at list price ($2k rent vs $25k).
- Cap rate 54.3% vs local median 6.0% in Baltimore — top-decile yield for the area; either an underpriced asset or a hidden risk that comps aren't pricing in. Stress-test before assuming the spread holds.
Location & tenants
- Location reads 76/100 on livability (#90 in MD, #3,396 nationally) — a middle-class / working-renter tenant base. Strengths: amenities A+, commute A+, housing A+; Watch: schools D, crime F.
- Baltimore City Public Schools (urban): math 7% / reading 16% proficiency, ranked #24 of 24 in MD (top 100%) — low school quality limits family demand, transient renter base, plan for 1-2y turnover; 79% free/reduced lunch — lower-income household profile, screen leases tightly.
- Market conditions: Rents rising fast (+7.5%/yr); 422 active listings in the ZIP; 40 comparable units currently listed for rent nearby; rentals at typical pace (median 24d on market — plan ~3-4 weeks tenant-placement turnaround); 40% of comp listings sitting > 30 days — soft ceiling on asking rent; 1,273 units permitted in Baltimore city in 2024 (1,104 in 5+ unit buildings).
- This rent runs 41% of the median local income ($46k/yr) — at the standard rent-burdened threshold; future hikes will face affordability resistance.
Forward outlook
- Local home prices are declining (-3.0%/yr); year-one equity from $173 of loan paydown is wiped out by about $750 of value loss. Plan a longer hold.
- Baltimore County population projected to shrink 4% by 2050 — rents likely to lag national; underwrite the cash flow, not the appreciation.
- At projected returns (-3.0% appreciation + 7.5% rent growth), your $7k cash investment doubles in ~1 year — after that, you're playing with house money.
Negotiation context
- Only 3 days on market — expect competitive offers; lowballing is unlikely to land.
- 7 sale attempts since 2y ago with the ask held roughly flat each time — persistent listings suggest the price (not the market) is what's stuck; bring a comps-based counter.
Risks & watch-outs
- Watch-outs: property tax is 4.3% of price; flood insurance adds $56/mo; built in 1915 — expect roof / HVAC / electrical / plumbing capex.
- Climate carrying-cost: severe flood risk; major wind risk, 27% chance of damaging wind over 30y; extreme-heat days projected 7→15/yr by 2055 (HVAC capex compounding) — expect insurance premiums to compound above CPI over the hold.
Questions for the listing agent
- Built in 1915 — when were the roof, HVAC, electrical panel, plumbing, and water heater last replaced?
- Property tax is high relative to price — has the assessment been appealed recently, and will the sale trigger a re-assessment?
- What's the actual annual flood-insurance premium (NFIP or private), and is the property in a SFHA with mandatory coverage?
- Is there a deadline driving the sale (1031 exchange, divorce, estate, relocation)? That informs how much negotiation room exists.
- Schools are D-rated, which usually means shorter tenancies and higher turnover. Who's the typical renter profile here, and what's been the actual vacancy rate?
- Crime grade is F in this area — have there been break-ins, vandalism, or insurance claims at this property in the last 3 years? What carrier currently insures it and at what premium?
- The area grade is low — what's the realistic commute time and amenity access for the typical tenant pool here? Any planned neighborhood developments (good or bad) we should know about?
- What's the average days-on-market for RENTAL listings here right now (not sales)? A rising rental-DOM trend means longer vacancies and softer asking-rent achievability than the comps imply.
- What's the recent tenant-quality profile in this submarket — average credit score on applications, eviction rate, late-payment / NSF rate, and stable-employment percentage? A property-management company in the area should have these aggregated.
- How much new for-sale + rental construction is in the pipeline within 1–3 miles? Heavy new supply typically softens prices + rents 12–24 months out; constrained supply supports both.
Investment metrics
- 1% rule
- 6.23% ✓
- Cap rate
- 54.30%
- Cash-on-cash
- 171.44%
- DSCR
- 8.63
- GRM
- 1.3
CMA / ARV
- ARV (on-the-fly)
- $73,080
- Comps found
- 12
Show comp detail 12 sales within ~0.75 mi
| Address | Dist | Beds/Ba | Sqft | Sold | Price | $/sf | Match |
|---|---|---|---|---|---|---|---|
| 2544 W Fairmount Ave | 0.33mi | 2/1.5 | 1,204 (-4%) | 2mo | $55,000 | $46 | 73 |
| 2516 W Fairmount Ave | 0.32mi | 3/1.0 (+1) | 1,304 (+4%) | 2mo | $30,000 | $23 | 73 |
| 2576 W Baltimore St W | 0.32mi | 3/2.0 (+1) | 1,200 (-5%) | 2mo | $152,000 | $127 | 66 |
| 2216 W Fayette St | 0.40mi | 3/1.5 (+1) | 1,326 (+5%) | 1mo | $77,000 | $58 | 64 |
| 2402 Wilkens Ave | 0.30mi | 2/1.0 | 1,092 (-13%) | 0mo | $45,000 | $41 | 63 |
| 2435 Lauretta Ave | 0.68mi | 3/1.0 (+1) | 1,260 (0%) | 1mo | $45,000 | $36 | 63 |
| 1906 W Saratoga St | 0.68mi | 3/1.5 (+1) | 1,273 (+1%) | 2mo | $155,000 | $122 | 58 |
| 1906 W Fairmount Ave | 0.52mi | 2/3.5 | 1,200 (-5%) | 3mo | $134,900 | $112 | 56 |
| 5 Rosedale St S | 0.74mi | 3/2.0 (+1) | 1,280 (+2%) | 1mo | $110,000 | $86 | 53 |
| 2408 Wilkens Ave | 0.30mi | 3/2.0 (+1) | 1,092 (-13%) | 2mo | $99,900 | $91 | 53 |
| 2680 Saint Benedict St | 0.39mi | 3/2.0 (+1) | 1,445 (+15%) | 2mo | $45,000 | $31 | 46 |
| 2416 W Franklin St | 0.66mi | 3/2.0 (+1) | 1,435 (+14%) | 2mo | $67,000 | $47 | 35 |
Match score weights: distance 35% · size 25% · config 20% · recency 20%. Top-matched comps best support the ARV.
Projected returns pro-forma
-3.0% appreciation · 7.51% rent growth · sell at horizon
- IRR
- —
- Equity multiple
- 10.08×
- Total profit
- $63,589
- Equity at exit
- $3,728
- IRR
- —
- Equity multiple
- 24.79×
- Total profit
- $166,497
- Equity at exit
- $2,162
Cash invested: $7,000 (down + closing). Projections, not guarantees.
Landlord ↔ Tenant lean methodology
- Overall (CITY)
- 12 Strongly Tenant-Friendly
- State Maryland
- 27 Tenant-Leaning · D+14
- County
- — inherits STATE
- City Baltimore
- 12 Strongly Tenant-Friendly · D+58
ZIP-level market 21223
- Rents YoY
- 7.5%
- Active inventory
- 422
- Price-to-rent
- 1.3×
Monthly cashflow live
- Estimated rent
- $1,558 high interval (Pro) →
- Mortgage (P&I)
- −$131
- Tax from tax record
- −$89 /mo · $1,066/yr
- Insurance
- −$10
- Flood insurance flood zone
- −$56 /mo · $666/yr
- HOA
- −$0
- Vacancy / Maint / Mgmt
- −$327
- Net cashflow
- $945
Break-even live
UW: 25.0% down · 7.5% · 30yr · 1.5% tax · 5.0% vac · 8.0% maint · 8.0% mgmt
Financing live
Cash to close
- Down payment
- $6,250
- Closing costs
- $750
- Reserves months
- —
- Total cash needed
- —
Loan-product check · same deal, 3 products live
Conventional
25% down · 7.5% · 30yr
- Down + closing
- —
- Monthly P&I
- —
- Monthly cashflow
- —
- DSCR
- —
- Eligible?
- —
Personal DTI + credit; lowest rate.
DSCR
20% down · 8.5% · 30yr
- Down + closing
- —
- Monthly P&I
- —
- Monthly cashflow
- —
- DSCR
- —
- Eligible?
- —
No personal income docs; deal must DSCR.
Hard money
10% down · 12.0% · 12mo
- Down + closing
- —
- Monthly P&I
- —
- Monthly cashflow
- —
- DSCR
- —
- Eligible?
- —
Short-term bridge; refi at stabilization.
Rent comps 40 comps
| Address | Beds | Baths | Sqft | Rent | $/sqft | DOM | Units | Dist |
|---|---|---|---|---|---|---|---|---|
| 110 S Catherine St Unit 1 Baltimore, MD | 2.0 | 1.0 | 1330 | $1,500 | $1.13 | 43d | 1 | 0.11mi |
| 2540 Frederick Ave Baltimore, MD | 3.0 | 1.0 | 1075 | $1,400 | $1.30 | 24d | 1 | 0.12mi |
| 476 S Bentalou St Baltimore, MD | 2.0 | 1.5 | 1630 | $1,300 | $0.80 | 43d | 1 | 0.20mi |
| 307 S Smallwood St Baltimore, MD | 2.0 | 2.5 | 1400 | $1,350 | $0.96 | 43d | 1 | 0.21mi |
| 2537 Hollins St Baltimore, MD | 3.0 | 2.0 | 1200 | $1,450 | $1.21 | 24d | 1 | 0.22mi |
| 2516 Hollins St Baltimore, MD | 3.0 | 2.0 | 1100 | $1,700 | $1.55 | 43d | 1 | 0.23mi |
| 2225 W Baltimore St Baltimore, MD | 3.0 | 2.5 | 1200 | $1,600 | $1.33 | 24d | 1 | 0.30mi |
| 2232 W Baltimore St Baltimore, MD | 3.0 | 1.0 | 1250 | $1,875 | $1.50 | 24d | 1 | 0.31mi |
| 2657 Lehman St Unit 1 Baltimore, MD | 2.0 | 1.0 | 1056 | $1,000 | $0.95 | 43d | 1 | 0.33mi |
| 62 N Gorman Ave Baltimore, MD | 3.0 | 2.0 | 1100 | $2,500 | $2.27 | 18d | 1 | 0.35mi |
| 39 N Bentalou St Baltimore, MD | 3.0 | 2.5 | 1844 | $1,700 | $0.92 | 3d | 1 | 0.36mi |
| 2671 Saint Benedict St Baltimore, MD | 2.0 | 1.0 | 1144 | $1,325 | $1.16 | 43d | 1 | 0.39mi |
| 514 S Payson St Unit 2 Baltimore, MD | 3.0 | 2.0 | 1264 | $1,750 | $1.38 | 43d | 1 | 0.44mi |
| 2738 Wilkens Ave Baltimore, MD | 3.0 | 1.0 | 1183 | $1,500 | $1.27 | 43d | 1 | 0.49mi |
| 1918 W Baltimore St Baltimore, MD | 2.0–3.0 | 1.0–2.0 | 857 | $1,375 | $1.60 | 43d | 1 | 0.50mi |
| 1912 W Baltimore St Unit 2 Baltimore, MD | 2.0 | 1.5 | 1200 | $2,100 | $1.75 | 24d | 1 | 0.51mi |
| 2737 Wilkens Ave Baltimore, MD | 3.0 | 1.5 | 1232 | $1,650 | $1.34 | 4d | 1 | 0.51mi |
| 941 Brunswick St Baltimore, MD | 3.0 | 1.5 | 1516 | $1,650 | $1.09 | 18d | 1 | 0.52mi |
| 941 Brunswick St Baltimore, MD | 3.0 | 1.5 | 1558 | $1,600 | $1.03 | 43d | 1 | 0.52mi |
| 1839 W Fayette St Baltimore, MD | 3.0 | 1.5 | 1426 | $1,675 | $1.17 | 24d | 1 | 0.58mi |
| 2012 W Saratoga St Baltimore, MD | 3.0 | 1.0 | 1300 | $1,700 | $1.31 | 24d | 1 | 0.63mi |
| 1635 Frederick Ave Baltimore, MD | 3.0 | 2.0 | 1224 | $1,850 | $1.51 | 43d | 1 | 0.67mi |
| 1814 Penrose Ave Baltimore, MD | 3.0 | 1.0 | 1624 | $1,700 | $1.05 | 18d | 1 | 0.70mi |
| 1846 W Saratoga St Unit 1 Baltimore, MD | 2.0 | 1.0 | 1250 | $1,300 | $1.04 | 43d | 1 | 0.71mi |
| 2609 Lauretta Ave Baltimore, MD | 3.0 | 1.0 | 1286 | $1,675 | $1.30 | 24d | 1 | 0.72mi |
| 1601 Frederick Ave Unit 3 Baltimore, MD | 2.0 | 1.0 | 1050 | $1,050 | $1.00 | 4d | 1 | 0.72mi |
| 2636 Lauretta Ave Baltimore, MD | 3.0 | 2.5 | 1232 | $1,900 | $1.54 | 43d | 1 | 0.75mi |
| 3130 Stafford St Baltimore, MD | 3.0 | 1.0 | 1200 | $1,500 | $1.25 | 20d | 1 | 0.82mi |
| 305 S Calhoun St Baltimore, MD | 2.0 | 1.0 | 1000 | $1,300 | $1.30 | 22d | 1 | 0.85mi |
| 1518 1/2 W Lexington St Baltimore, MD | 2.0 | 2.0 | 1650 | $1,200 | $0.73 | 4d | 1 | 0.85mi |
| 1519 Penrose Ave Baltimore, MD | 3.0 | 2.0 | 1200 | $1,875 | $1.56 | 43d | 1 | 0.87mi |
| 1324 W Lombard St Unit 2 Baltimore, MD | 2.0 | 1.5 | 1100 | $1,450 | $1.32 | 43d | 1 | 0.88mi |
| 1324 W Lombard St Unit 1 Baltimore, MD | 2.0 | 2.0 | 1100 | $1,500 | $1.36 | 24d | 1 | 0.88mi |
| 1315 Hollins St Unit 2 Baltimore, MD | 3.0 | 2.0 | 1096 | $1,860 | $1.70 | 4d | 1 | 0.91mi |
| 1315 Hollins St Unit 2 Baltimore, MD | 3.0 | 2.0 | 1096 | $1,950 | $1.78 | 12d | 1 | 0.91mi |
| 2922 Edmondson Ave Baltimore, MD | 3.0 | 2.0 | 1620 | $1,900 | $1.17 | 43d | 1 | 0.93mi |
| 10 S Carey St Baltimore, MD | 2.0 | 1.0 | 1140 | $1,550 | $1.36 | 24d | 1 | 0.94mi |
| 607 N Longwood St Baltimore, MD | 1.0 | 1.0 | 1750 | $650 | $0.37 | 4d | 1 | 0.98mi |
| 3336 W Caton Ave Baltimore, MD | 3.0 | 2.0 | 1236 | $1,625 | $1.31 | 24d | 1 | 0.99mi |
| 104 S Carrollton Ave Baltimore, MD | 3.0 | 4.0 | 1232 | $2,400 | $1.95 | 4d | 1 | 0.99mi |
Listing history 4 events
-
2026-06-18days on market $25,000 Active 3 DOM
-
2026-06-17days on market $25,000 Active 2 DOM
-
2026-06-15remarks 668-char remark
-
2026-06-15$25,000 Active 1 DOM
ⓘ Source: listings_history table (triggers on properties + properties_extension) + one-shot
backfill from property_details.listing_events for pre-trigger history.
Tax reassessment forecast MD · Partial reset (capped growth)
- Current annual tax
- $1,066 · $89/mo
- Projected year-2 tax
- $1,066 · $89/mo
- Expected delta
- $0/yr ($0/mo · 0.0%)
ⓘ Screening estimate from a state-policy table — verify with the county assessor before closing.
Climate risk First Street
- Flood 9/10 Extreme FEMA zone X (unshaded) · 99% chance over 30 yrs
- Wildfire 1/10 Low
- Heat 8/10 Severe 7 d/yr ≥103°F today · 15 d/yr by 30 yrs out
- Wind 6/10 Major 27% chance of damaging wind over 30 yrs
- Air quality 3/10 Moderate 3 unhealthy d/yr today · 4 by 30 yrs out
Nearby sold comps map
Loading sold comps map…
Walkable amenities ~0.75 mi
Loading nearby amenities…
Taxation est. · year 1
- Rental income
- $18,690
- − Mortgage interest
- −$1,400
- − Property taxes
- −$1,066
- − Insurance
- −$792
- − Repairs & maintenance
- −$1,495
- − Management
- −$1,495
- − Depreciation
- −$727
- Taxable income
- $11,715
- Est. tax owed @ 24.0%
- −$2,812
- After-tax cash flow
- $8,523/yr
For passive investors: Depreciation is non-cash, so a rental often shows a tax loss while cash-flowing — sheltering income. Rental losses are passive: they offset passive income freely, and up to $25,000/yr can offset ordinary (W-2) income if you actively participate and your MAGI is under $100k (phasing out to $0 by $150k); unused losses carry forward. On sale, claimed depreciation is recaptured at up to 25%, and gains may owe capital-gains tax (a 1031 exchange can defer both). Figures are a year-1 estimate at your 24.0% rate — not tax advice; consult a CPA.
Schools (NCES district)
- District
- Baltimore City Public Schools
- NCES district ID
- 2400090
- Math proficiency
- 7% ▼ -9.00%
- Reading proficiency
- 16% ▼ -5.00%
- Median HH income
- $42,108
- Composite
- 10.08/100
- National rank
- #9805
- State rank
- #24 of 24 in MD
Livability — Baltimore
- Score
- 76/100
- State rank
- #90
- US rank
- #3396
Category grades
Schools grade is shown separately in the Schools card above.
Census & demographics
- Census place
- Baltimore, MD
- County
- Baltimore City · 558,601 people
- City population
- 588,727
- Metro
- Baltimore-Columbia-Towson, MD
- Population (ZIP)
- 19,572
- Household income
- $45,840
- Rent vs Own
- Severe rent burden
- 1755.0
Population outlook (Baltimore County) Hauer SSP2
- Today (2025)
- 624,249 people
- By 2030
- 621,541 · -0.4%
- By 2040
- 609,756 · -2.3%
- By 2050
- 597,249 · -4.3%
- By 2075
- 552,236 · -11.5%
- By 2100
- 513,934 · -17.7%
Race, ethnicity, and origin ACS 2023
- Neighborhood character
- Predominantly Black (72%)
- Race & ethnicity
- Black 72% White 16% Hispanic / Latino 7% Two or more races 6% Asian 1%
- Hispanic origin (detail)
- Mexican 3% Puerto Rican 1%
- Common ancestry
- Romanian 1%
- Foreign-born
- 8% · Canada
- Languages at home
- 90% English-only · Spanish 6% French/Haitian/Cajun 2% Other Indo-European 1%
Political lean MEDSL · Baltimore
- 2024 margin
- Solid D (+73.0) · D 85.2% · R 12.2% · Other 2.6%
- 2008→2024 swing
- -2.5pp toward R · 2008: 75.5pp · 2024: 73.0pp
- All cycles
- 2024: D+73.0 2020: D+76.6 2016: D+74.6 2012: D+76.4 2008: D+75.5
Not yet ingested
- Civics
- —
Market trends
- HPI YoY
- ▼ -97.99%
- Current HPI
- 140.5836
- Rent YoY
- ▲ 7.51%
- Metro
- Baltimore-Columbia-Towson, MD
- State GDP YoY
- ▲ 2.97%
- F500 in state
- 12
Industry mix (Fortune 500 HQ in MD)
| Industry | F500 HQs | Revenue |
|---|---|---|
| Aerospace / Defense | 1 | $71B |
|
||
| Utilities | 1 | $25B |
|
||
| Hotels | 1 | $24B |
|
||
| Consumer Goods | 1 | $7B |
|
||
| Real Estate | 1 | $6B |
|
||
| Chemicals | 1 | $2B |
|
||
Price history
-32.0% since first listed25 events — show timeline
- 2026-06-15 Listed $25,000 BRIGHT MLS
- 2026-03-04 Pending — BRIGHT MLS
- 2026-03-04 Listing Removed — BRIGHT MLS
- 2026-03-02 Listing Removed — BRIGHT MLS
- 2026-02-19 Listed $25,000 BRIGHT MLS
- 2026-02-18 Listed $100,000 BRIGHT MLS
- 2026-02-17 Coming Soon — BRIGHT MLS
- 2025-11-20 Listing Removed — BRIGHT MLS
- 2025-10-28 Contingent — BRIGHT MLS
- 2025-09-01 Relisted — BRIGHT MLS
- 2025-07-26 Contingent — BRIGHT MLS
- 2025-06-14 Price Changed $89,000 BRIGHT MLS
- 2025-06-14 Relisted — BRIGHT MLS
- 2025-05-30 Listing Removed — BRIGHT MLS
- 2025-03-05 Listed $105,000 BRIGHT MLS
- 2025-02-11 Listing Removed — BRIGHT MLS
- 2024-12-09 Price Changed $129,000 BRIGHT MLS
- 2024-11-25 Price Changed $137,000 BRIGHT MLS
- 2024-11-12 Listed $147,000 BRIGHT MLS
- 2024-06-17 Sold (Public Records) $78,000 Public Records
- 2024-05-31 Sold (MLS) $78,000 BRIGHT MLS
- 2024-04-30 Pending — BRIGHT MLS
- 2024-04-29 Coming Soon $84,500 BRIGHT MLS
- 2021-04-07 Sold (Public Records) $51,000 Public Records
- 1986-10-07 Sold (Public Records) $36,750 Public Records
Property tax history
+9.2%/yrLatest (2025): $1,066 · +1.4% YoY. Source: county tax records.
Cash-flow waterfall
monthlySold comps — $/sqft
last 12 mo · ≤1 miLoading sold comps…