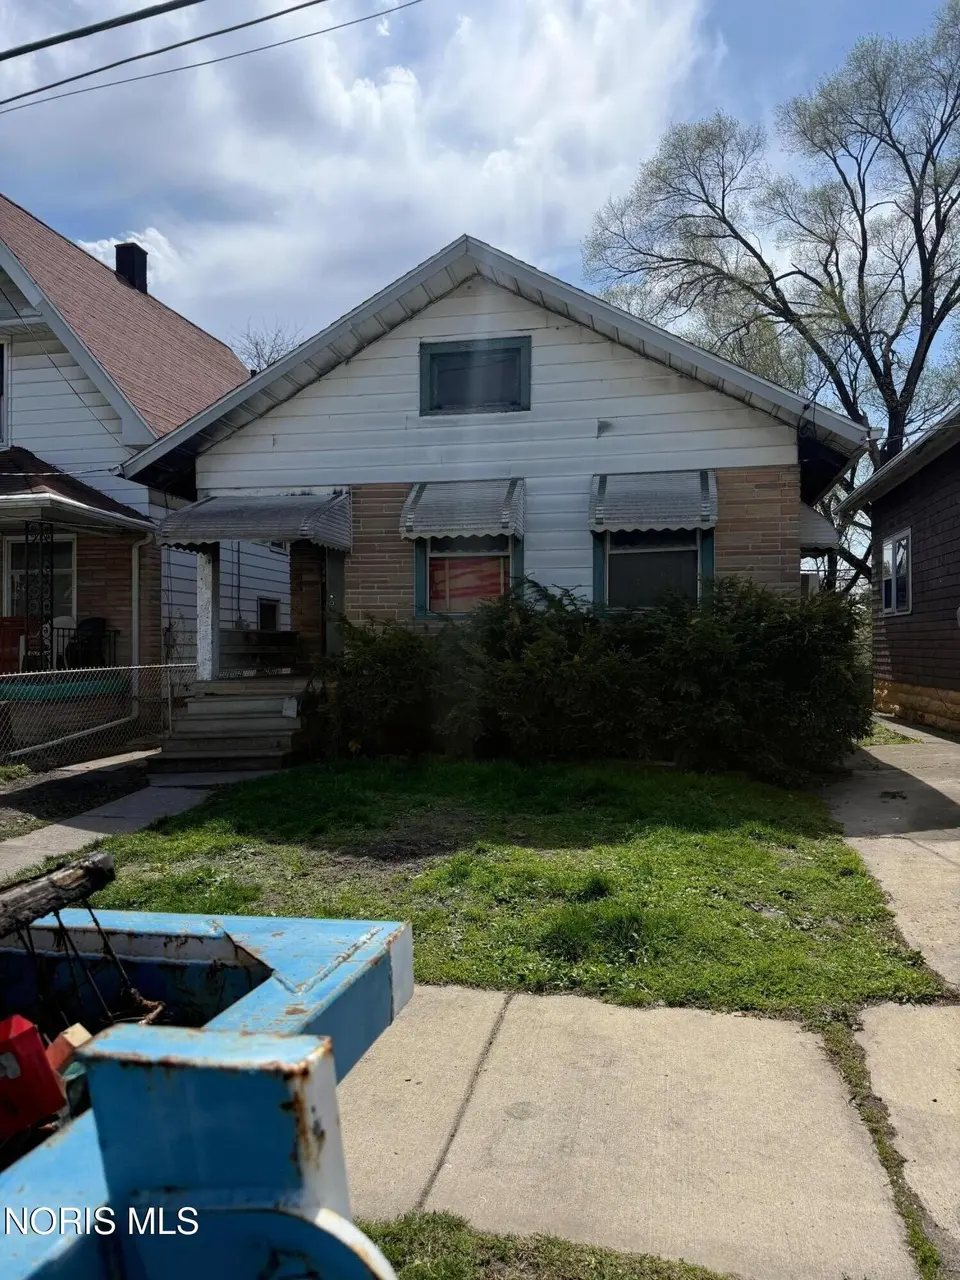
649 Curtis St · Toledo, OH
Flood risk 1/10 · Minimal
- FEMA flood zone
- X (unshaded)
- Chance of flooding over 30 yrs
- 0.0%
- Est. flood insurance / yr
- $473 – $860
Fire risk 1/10 · Minimal
- Est. fire insurance / yr
- $713 – $1,323
Heat risk 3/10 · Minor
- Hot days now (above 100°F)
- 7 days/yr
- Hot days in 30 yrs
- 16 days/yr
Wind risk 2/10 · Minimal
- Chance of severe wind over 30 yrs
- —
Air-quality risk 2/10 · Minimal
- Unhealthy air days now
- 1 days/yr
- Unhealthy air days in 30 yrs
- 2 days/yr
Risk factors via First Street. Map © Google.
Why this score? — see what drove the D+ grade
The composite is a weighted blend of 9 inputs, each scored 0–100. Each bar is that input's sub-score; the figure is the points it added to the 100-point composite (weight × sub-score).
- Cash flow +15.0/30.0
- ARV discount +7.5/15.0
- Appreciation +5.4/10.0
- 1% rule +5.0/10.0
- DSCR +5.0/10.0
- Rent growth +4.5/5.0
- Livability +3.3/5.0
- Condition / age +2.5/5.0
- Schools +1.6/10.0
$10,000
🖨 Deal sheet 📄 Offer letter ✓ Due diligence
Listing remarks MLS
Fire Damaged Home. Ideal for flippers or someone looking for a project. This home is in need of a full renovation. Quiet neighborhood. Motivated Seller. Bring your cash offers.
Key facts
- 2,700 sq ft lot
- Parking
- Built 1911
Neighborhood map
What this means for you Summary
Snapshot
- This is a 2-bed/1.0-bath single-family listed at $10k.
Deal economics
- At list price, monthly cash flow is $752 ($9k/yr) — positive.
- The deal already cash-flows at list — no discount required.
- Meets the 1% rule at list price ($1k rent vs $10k).
- Recommended offer: $10k (3.0% below list) — sets the bar for market timing.
- Cap rate 96.5% vs local median 7.6% in Toledo — top-decile yield for the area; either an underpriced asset or a hidden risk that comps aren't pricing in. Stress-test before assuming the spread holds.
Location & tenants
- Location reads 66/100 on livability (#645 in OH) — a middle-class / working-renter tenant base. Strengths: cost of living A+, housing A+, health & safety A+; Watch: amenities C-, schools D-, crime F.
- Toledo City (urban): math 15% / reading 24% proficiency, ranked #634 of 656 in OH (top 97%) — low school quality limits family demand, transient renter base, plan for 1-2y turnover; 72% free/reduced lunch — lower-income household profile, screen leases tightly.
- Market conditions: Rents rising fast (+7.8%/yr); 99 active listings in the ZIP; 29 comparable units currently listed for rent nearby; rentals lingering (median 44d on market — plan ~5-8 weeks vacancy on turnover, expect pricing pressure); 52% of comp listings sitting > 30 days — soft ceiling on asking rent; lower-income renter base — watch delinquency; 415 units permitted in Lucas County in 2024 (122 in 5+ unit buildings).
Forward outlook
- In year one you build about $144 of equity ($69 loan paydown + $75 appreciation (0.8% local appreciation)).
- Lucas County population projected at -16% by 2050 — secular population decline; favor cash flow + early exit over multi-decade hold.
- At projected returns (0.8% appreciation + 7.8% rent growth), your $3k cash investment doubles in ~1 year — after that, you're playing with house money.
Negotiation context
- It's been on market 57 days — a 3% lower offer ($10k) is reasonable based on typical stale-listing flexibility.
- 2 sale attempts since 4y ago; this cycle's ask has dropped $2k (17%) from the opening price — seller is motivated, your offer sets the floor, not the list.
Risks & watch-outs
- Watch-outs: built in 1911 — expect roof / HVAC / electrical / plumbing capex.
Questions for the listing agent
- It's been on market 57 days. Have you received any prior offers? Is the seller open to a 3% concession, seller financing, or rate buy-down credit?
- Built in 1911 — when were the roof, HVAC, electrical panel, plumbing, and water heater last replaced?
- Is there a deadline driving the sale (1031 exchange, divorce, estate, relocation)? That informs how much negotiation room exists.
- Schools are D-rated, which usually means shorter tenancies and higher turnover. Who's the typical renter profile here, and what's been the actual vacancy rate?
- Crime grade is F in this area — have there been break-ins, vandalism, or insurance claims at this property in the last 3 years? What carrier currently insures it and at what premium?
- The area grade is low — what's the realistic commute time and amenity access for the typical tenant pool here? Any planned neighborhood developments (good or bad) we should know about?
- What's the average days-on-market for RENTAL listings here right now (not sales)? A rising rental-DOM trend means longer vacancies and softer asking-rent achievability than the comps imply.
- What's the recent tenant-quality profile in this submarket — average credit score on applications, eviction rate, late-payment / NSF rate, and stable-employment percentage? A property-management company in the area should have these aggregated.
- How much new for-sale + rental construction is in the pipeline within 1–3 miles? Heavy new supply typically softens prices + rents 12–24 months out; constrained supply supports both.
Investment metrics
- 1% rule
- 10.39% ✓
- Cap rate
- 96.49%
- Cash-on-cash
- 322.15%
- DSCR
- 15.33
- GRM
- 0.8
CMA / ARV
- ARV (median comp)
- $39,001
- List price
- $10,000
- Delta
- -74.36%
- Verdict
- UNDERPRICED
- Comps
- 20 within 1.0 mi
Show comp detail 2 sales within ~0.75 mi
| Address | Dist | Beds/Ba | Sqft | Sold | Price | $/sf | Match |
|---|---|---|---|---|---|---|---|
| 109 Wellington St | 0.49mi | 2/1.0 | 859 (+12%) | 3mo | $4,500 | $5 | 56 |
| 223 Leland Ave | 0.73mi | 2/1.0 | 753 (-2%) | 13mo | $34,000 | $45 | 51 |
Match score weights: distance 35% · size 25% · config 20% · recency 20%. Top-matched comps best support the ARV.
Projected returns pro-forma
0.75% appreciation · 7.8% rent growth · sell at horizon
- IRR
- —
- Equity multiple
- 20.01×
- Total profit
- $53,216
- Equity at exit
- $3,284
- IRR
- —
- Equity multiple
- 48.72×
- Total profit
- $133,622
- Equity at exit
- $4,266
Cash invested: $2,800 (down + closing). Projections, not guarantees.
Landlord ↔ Tenant lean methodology
- Overall (STATE)
- 73 Landlord-Friendly
- State Ohio
- 73 Landlord-Friendly · R+6
- County
- — inherits STATE
- City
- — inherits STATE
ZIP-level market 43609
- Home prices YoY
- 0.3%
- Rents YoY
- 7.8%
- Active inventory
- 99
- Price-to-rent
- 0.8×
Monthly cashflow live
- Estimated rent
- $1,039 high interval (Pro) →
- Mortgage (P&I)
- −$52
- Tax est. 1.5%
- −$12 /mo · $150/yr
- Insurance
- −$4
- HOA
- −$0
- Vacancy / Maint / Mgmt
- −$218
- Net cashflow
- $752
Break-even live
UW: 25.0% down · 7.5% · 30yr · 1.5% tax · 5.0% vac · 8.0% maint · 8.0% mgmt
Financing live
Cash to close
- Down payment
- $2,500
- Closing costs
- $300
- Reserves months
- —
- Total cash needed
- —
Loan-product check · same deal, 3 products live
Conventional
25% down · 7.5% · 30yr
- Down + closing
- —
- Monthly P&I
- —
- Monthly cashflow
- —
- DSCR
- —
- Eligible?
- —
Personal DTI + credit; lowest rate.
DSCR
20% down · 8.5% · 30yr
- Down + closing
- —
- Monthly P&I
- —
- Monthly cashflow
- —
- DSCR
- —
- Eligible?
- —
No personal income docs; deal must DSCR.
Hard money
10% down · 12.0% · 12mo
- Down + closing
- —
- Monthly P&I
- —
- Monthly cashflow
- —
- DSCR
- —
- Eligible?
- —
Short-term bridge; refi at stabilization.
Rent comps 29 comps
| Address | Beds | Baths | Sqft | Rent | $/sqft | DOM | Units | Dist |
|---|---|---|---|---|---|---|---|---|
| 223 Charles St Toledo, OH | 2.0 | 1.0 | 612 | $875 | $1.43 | 43d | 1 | 0.15mi |
| 416 Maumee Ave Unit D Toledo, OH | 1.0 | 1.0 | 622 | $475 | $0.76 | 43d | 1 | 0.58mi |
| 827 Colburn St Toledo, OH | 2.0 | 1.0 | 1092 | $750 | $0.69 | 43d | 1 | 0.58mi |
| 771 Orchard St Unit 7715 Toledo, OH | 2.0 | 1.0 | 1086 | $645 | $0.59 | 23d | 1 | 0.72mi |
| 400 Nebraska Ave Toledo, OH | 1.0 | 1.0 | 664 | $1,129 | $1.70 | 13d | 1 | 0.73mi |
| 244 Knower St Toledo, OH | 3.0 | 1.0 | 1120 | $995 | $0.89 | 13d | 1 | 0.75mi |
| 1037 Orchard St Toledo, OH | 2.0 | 1.0 | 696 | $820 | $1.18 | 21d | 1 | 0.84mi |
| 1321 Gordon St Toledo, OH | 3.0 | 1.0 | 1121 | $1,050 | $0.94 | 43d | 1 | 0.84mi |
| 1418 Colburn St Toledo, OH | 3.0 | 1.0 | 992 | $1,200 | $1.21 | 13d | 1 | 1.05mi |
| 34 S Erie St Unit 209 Toledo, OH | 1.0 | 1.0 | 930 | $1,375 | $1.48 | 23d | 1 | 1.06mi |
| 34 S Erie St Unit 409 Toledo, OH | 1.0 | 1.0 | 930 | $1,375 | $1.48 | 43d | 1 | 1.06mi |
| 34 S Erie St Unit 107 Toledo, OH | 1.0 | 1.0 | 1103 | $1,300 | $1.18 | 23d | 1 | 1.06mi |
| 34 S Erie St Unit 202 Toledo, OH | 1.0 | 1.0 | 894 | $1,275 | $1.43 | 23d | 1 | 1.06mi |
| 34 S Erie St Unit 611 Toledo, OH | 1.0 | 1.0 | 990 | $1,300 | $1.31 | 43d | 1 | 1.06mi |
| 34 S Erie St Apt 602 Toledo, OH | 1.0 | 1.0 | 894 | $1,315 | $1.47 | 43d | 1 | 1.06mi |
| 1521 Emma St Unit LABS 1521 Emma St, B 43051619729 Toledo, OH | 1.0 | 1.0 | 975 | $900 | $0.92 | 43d | 1 | 1.09mi |
| 15 S Ontario St Apt 409 Toledo, OH | 1.0 | 1.0 | 984 | $1,695 | $1.72 | 43d | 1 | 1.09mi |
| 1 S Erie St Toledo, OH | 1.0 | 1.0 | 846 | $1,410 | $1.67 | 13d | 1 | 1.14mi |
| 538 Nicholas St Unit B Toledo, OH | 1.0 | 1.0 | 600 | $600 | $1.00 | 43d | 1 | 1.26mi |
| 23 N Summit St Toledo, OH | 1.0 | 1.0 | 838 | $1,475 | $1.76 | 13d | 2 | 1.30mi |
| 705 Nicholas St Toledo, OH | 2.0 | 1.0 | 1037 | $900 | $0.87 | 43d | 1 | 1.31mi |
| 1026 Oakwood Ave Toledo, OH | 2.0 | 1.0 | 1100 | $850 | $0.77 | 43d | 1 | 1.38mi |
| 123 Water St Unit 307 Toledo, OH | 1.0 | 1.0 | 914 | $1,445 | $1.58 | 43d | 1 | 1.40mi |
| 123 Water St Unit 411 Toledo, OH | 1.0 | 1.0 | 747 | $1,380 | $1.85 | 23d | 1 | 1.40mi |
| 1825 Collingwood Blvd Toledo, OH | 1.0 | 1.0 | 710 | $850 | $1.20 | 13d | 1 | 1.40mi |
| 142 23rd St Toledo, OH | 1.0 | 1.0–1.5 | 508 | $1,395 | $2.75 | 43d | 1 | 1.40mi |
| 200 N St Clair St Toledo, OH | 2.0 | 1.0–2.0 | 835 | $2,550 | $3.05 | 13d | 15 | 1.45mi |
| 322 14th St Apt 203 Toledo, OH | 3.0 | 1.5 | 1065 | $1,000 | $0.94 | 13d | 1 | 1.47mi |
| 332 14th St Unit 303 Toledo, OH | 3.0 | 1.5 | 1040 | $1,000 | $0.96 | 43d | 1 | 1.48mi |
Listing history 21 events
-
2026-06-18days on market $10,000 Active 57 DOM
-
2026-06-17days on market $10,000 Active 56 DOM
-
2026-06-16days on market $10,000 Active 55 DOM
-
2026-06-15days on market $10,000 Active 54 DOM
-
2026-06-14days on market $10,000 Active 52 DOM
-
2026-06-10days on market $10,000 Active 49 DOM
-
2026-06-09days on market $10,000 Active 48 DOM
-
2026-06-08days on market $10,000 Active 47 DOM
-
2026-06-07days on market $10,000 Active 46 DOM
-
2026-06-05days on market $10,000 Active 43 DOM
-
2026-06-03days on market $10,000 Active 42 DOM
-
2026-06-02days on market $10,000 Active 41 DOM
-
2026-06-01days on market $10,000 Active 40 DOM
-
2026-05-31days on market $10,000 Active 39 DOM
-
2026-05-30days on market $10,000 Active 38 DOM
-
2026-04-25price $10,000 176-char remark
Show marketing remark (176 chars)
Fire Damaged Home. Ideal for flippers or someone looking for a project. This home is in need of a full renovation. Quiet neighborhood. Motivated Seller. Bring your cash offers.
-
2026-04-17$12,000 Active 176-char remark
Show marketing remark (176 chars)
Fire Damaged Home. Ideal for flippers or someone looking for a project. This home is in need of a full renovation. Quiet neighborhood. Motivated Seller. Bring your cash offers.
-
2025-10-13price $20,000 124-char remark
Show marketing remark (124 chars)
TWO (2) BED BASEMENT RANCH IN FAIR CONDITION. HOME NEEDS SOME UPDATING. GARAGE NEEDS TO BE TOTALLY RENOVATED OR DEMOLISHED.
-
2022-07-26soldstatus $20,000 Closed 124-char remark
Show marketing remark (124 chars)
TWO (2) BED BASEMENT RANCH IN FAIR CONDITION. HOME NEEDS SOME UPDATING. GARAGE NEEDS TO BE TOTALLY RENOVATED OR DEMOLISHED.
-
2022-06-23status Pending 124-char remark
Show marketing remark (124 chars)
TWO (2) BED BASEMENT RANCH IN FAIR CONDITION. HOME NEEDS SOME UPDATING. GARAGE NEEDS TO BE TOTALLY RENOVATED OR DEMOLISHED.
-
2022-06-09$22,500 Active 124-char remark
Show marketing remark (124 chars)
TWO (2) BED BASEMENT RANCH IN FAIR CONDITION. HOME NEEDS SOME UPDATING. GARAGE NEEDS TO BE TOTALLY RENOVATED OR DEMOLISHED.
ⓘ Source: listings_history table (triggers on properties + properties_extension) + one-shot
backfill from property_details.listing_events for pre-trigger history.
Climate risk First Street
- Flood 1/10 Low FEMA zone X (unshaded) · 0% chance over 30 yrs
- Wildfire 1/10 Low
- Heat 3/10 Moderate 7 d/yr ≥100°F today · 16 d/yr by 30 yrs out
- Wind 2/10 Low
- Air quality 2/10 Low 1 unhealthy d/yr today · 2 by 30 yrs out
Nearby sold comps map
Loading sold comps map…
Walkable amenities ~0.75 mi
Loading nearby amenities…
Taxation est. · year 1
- Rental income
- $12,468
- − Mortgage interest
- −$560
- − Property taxes
- −$150
- − Insurance
- −$50
- − Repairs & maintenance
- −$997
- − Management
- −$997
- − Depreciation
- −$291
- Taxable income
- $9,422
- Est. tax owed @ 24.0%
- −$2,261
- After-tax cash flow
- $6,759/yr
For passive investors: Depreciation is non-cash, so a rental often shows a tax loss while cash-flowing — sheltering income. Rental losses are passive: they offset passive income freely, and up to $25,000/yr can offset ordinary (W-2) income if you actively participate and your MAGI is under $100k (phasing out to $0 by $150k); unused losses carry forward. On sale, claimed depreciation is recaptured at up to 25%, and gains may owe capital-gains tax (a 1031 exchange can defer both). Figures are a year-1 estimate at your 24.0% rate — not tax advice; consult a CPA.
Schools (NCES district)
- District
- Toledo City
- NCES district ID
- 3904490
- Math proficiency
- 15% ▼ -16.00%
- Reading proficiency
- 24% ▼ -13.00%
- Median HH income
- $32,137
- Composite
- 15.76/100
- National rank
- #9276
- State rank
- #634 of 656 in OH
Livability — Toledo
- Score
- 66/100
- State rank
- #645
- US rank
- #11442
Category grades
Schools grade is shown separately in the Schools card above.
Census & demographics
- Census place
- Toledo, OH
- County
- Lucas County · 380,724 people
- City population
- 280,811
- Metro
- Toledo, OH
- Population (ZIP)
- 21,404
- Household income
- $42,313
- Rent vs Own
- Severe rent burden
- 1603.0
Population outlook (Lucas County) Hauer SSP2
- Today (2025)
- 420,751 people
- By 2030
- 410,187 · -2.5%
- By 2040
- 384,019 · -8.7%
- By 2050
- 355,125 · -15.6%
- By 2075
- 291,683 · -30.7%
- By 2100
- 233,670 · -44.5%
Race, ethnicity, and origin ACS 2023
- Neighborhood character
- Diverse neighborhood (Simpson 0.66)
- Race & ethnicity
- White 47% Black 29% Hispanic / Latino 17% Two or more races 9%
- Hispanic origin (detail)
- Mexican 15%
- Common ancestry
- Romanian 5% Lithuanian 2% Italian 1%
- Foreign-born
- 4% · Canada, China
- Languages at home
- 92% English-only · Spanish 5% Arabic 1% French/Haitian/Cajun 1%
Political lean MEDSL · Lucas
- 2024 margin
- D (+12.6) · D 55.8% · R 43.2%
- 2008→2024 swing
- -18.9pp toward R · 2008: 31.4pp · 2024: 12.6pp
- All cycles
- 2024: D+12.6 2020: D+16.8 2016: D+17.4 2012: D+30.4 2008: D+31.4
Not yet ingested
- Civics
- —
Market trends
- HPI YoY
- ▲ 0.75%
- Current HPI
- 235.2515
- Rent YoY
- ▲ 7.80%
- Metro
- Toledo, OH
- State GDP YoY
- ▲ 1.98%
- F500 in state
- 48
Industry mix (Fortune 500 HQ in OH)
| Industry | F500 HQs | Revenue |
|---|---|---|
| Insurance | 3 | $145B |
|
||
| Industrial Machinery | 3 | $49B |
|
||
| Financial Services | 3 | $24B |
|
||
| Consumer Goods | 2 | $93B |
|
||
| Aerospace / Defense | 2 | $47B |
|
||
| Utilities | 2 | $33B |
|
||
Price history
-55.6% since first listed6 events — show timeline
- 2026-04-25 Price Changed $10,000 NORIS
- 2026-04-17 Listed $12,000 NORIS
- 2025-10-13 Price Changed $20,000 NORIS
- 2022-07-26 Sold (MLS) $20,000 NORIS
- 2022-06-23 Pending — NORIS
- 2022-06-09 Listed $22,500 NORIS
Property tax history
+14.9%/yrLatest (2025): $537 · +3.3% YoY. Source: county tax records.
Cash-flow waterfall
monthlySold comps — $/sqft
last 12 mo · ≤1 miLoading sold comps…