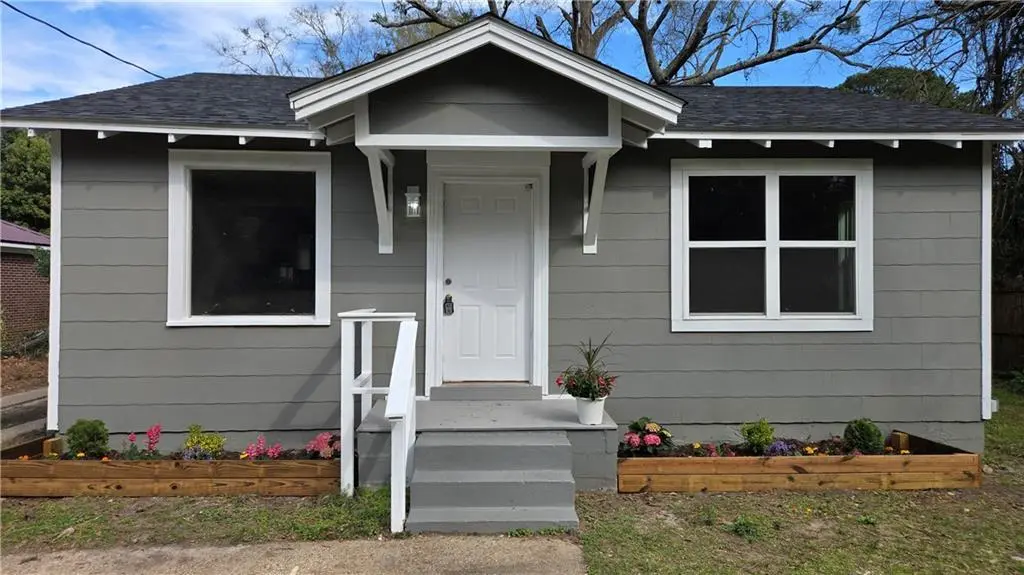
655 Shannon St · Mobile, AL
Flood risk 1/10 · Minimal
- FEMA flood zone
- X (unshaded)
- Chance of flooding over 30 yrs
- 0.0%
- Est. flood insurance / yr
- $507 – $1,088
Fire risk 1/10 · Minimal
- Est. fire insurance / yr
- $916 – $1,700
Heat risk 9/10 · Severe
- Hot days now (above 105°F)
- 6 days/yr
- Hot days in 30 yrs
- 18 days/yr
Wind risk 9/10 · Severe
- Chance of severe wind over 30 yrs
- 99.0%
Air-quality risk 2/10 · Minimal
- Unhealthy air days now
- 1 days/yr
- Unhealthy air days in 30 yrs
- 1 days/yr
Risk factors via First Street. Map © Google.
Why this score? — see what drove the D grade
The composite is a weighted blend of 9 inputs, each scored 0–100. Each bar is that input's sub-score; the figure is the points it added to the 100-point composite (weight × sub-score).
- Cash flow +15.9/30.0
- ARV discount +7.5/15.0
- DSCR +4.9/10.0
- Rent growth +3.8/5.0
- Livability +3.8/5.0
- 1% rule +3.2/10.0
- Condition / age +2.5/5.0
- Schools +2.3/10.0
- Appreciation +0.0/10.0
$127,900
🖨 Deal sheet (PDF) 📄 Offer letter ✓ Due diligence
Listing remarks
Charming and move-in ready, this adorable cottage offers a surprisingly spacious layout with 2 bedrooms and 1 bathroom. The open-concept design creates a bright, welcoming atmosphere, with the family room flowing seamlessly into the kitchen. The kitchen features a convenient eat-in counter with seating for four, along with all-new appliances, including a dishwasher, microwave, and electric range. Just off the kitchen, you'll find a full laundry room complete with a washer and dryer. Throughout the home, new luxury vinyl plank flooring, while the bathroom features tile flooring, a new tub/shower combination, new toilet, and a new vanity. Both bedrooms are generously sized and can comforta
Key facts
- Open-concept design
- Eat-in counter
- All-new appliances
Tags
Property features AI
Exterior
- Parking: 2 parking spaces; Driveway; Level driveway; Kitchen-level entry
- Utilities: Cable available; Electricity available; Natural gas available; Water available; Electric: Other; Sewer: Other
- Home design: Residential single-family home
- Construction: Built in 1951; Pillar/post/pier foundation; Shingle roof; Other construction materials
- Exterior features: Private yard; Back yard fencing; View
Interior
- Kitchen: Dishwasher; Electric cooktop; Electric range; Microwave; Breakfast bar; White cabinets; Other surface counters; View to family room
- Bedrooms: 2 bedrooms
- Flooring: Laminate
- Bathrooms: 1 full bathroom
- Heating & cooling: Central heating; Central air conditioning
- Interior features: 9-foot ceilings on the main level; Open view from kitchen to family room; Breakfast bar; White kitchen cabinets; Other surface counters
- Laundry & utility: Washer; Dryer
Neighborhood map
What this means for you Summary
Snapshot
- This is a 2-bed/1.0-bath single-family listed at $128k.
Deal economics
- At list price, monthly cash flow is $62 ($741/yr) — positive.
- The deal already cash-flows at list — no discount required.
- To meet the 1% rule (rent ≥ 1% of price), the offer needs to be $105k (17.8% below list).
- Recommended offer: $105k (17.8% below list) — sets the bar for 1% rule.
- Cap rate 6.9% vs local median 4.9% in Mobile — top-decile yield for the area; either an underpriced asset or a hidden risk that comps aren't pricing in. Stress-test before assuming the spread holds.
Location & tenants
- Location reads 75/100 on livability (#20 in AL, #4,262 nationally) — a middle-class / working-renter tenant base. Strengths: commute A+, cost of living A+, housing A+; Watch: crime F, employment D-.
- Mobile County (urban): math 15% / reading 39% proficiency, ranked #81 of 129 in AL (top 63%) — low school quality limits family demand, transient renter base, plan for 1-2y turnover; 67% free/reduced lunch — lower-income household profile, screen leases tightly.
- Zoned schools: Maryvale Elementary School (math 5% / reading 25%, grade F, #505 of 627 statewide, top 81%, 494 students, 92% FRL); Lillie B Williamson High School (math 2% / reading 12%, grade F, #273 of 305 statewide, top 89%, 956 students, 94% FRL) — zoned schools average 93% FRL vs 67% district-wide (26 pts higher); higher-poverty schools than district average — tighter screening recommended.
- Zoned-school proficiency averages 11% at this address vs 27% district-wide (-16 pts) — the specific schools serving this property underperform the Mobile County average; the district grade overstates school quality for this exact location.
- Market conditions: Rents rising fast (+5.1%/yr); 175 active listings in the ZIP; 29 comparable units currently listed for rent nearby; rentals lingering (median 46d on market — plan ~5-8 weeks vacancy on turnover, expect pricing pressure); 59% of comp listings sitting > 30 days — soft ceiling on asking rent; 1,678 units permitted in Mobile County in 2024 (264 in 5+ unit buildings).
Forward outlook
- Local home prices are declining (-3.0%/yr); year-one equity from $884 of loan paydown is wiped out by about $4k of value loss. Plan a longer hold.
- Mobile County population projected to shrink 8% by 2050 — rents likely to lag national; underwrite the cash flow, not the appreciation.
Negotiation context
- Only 6 days on market — expect competitive offers; lowballing is unlikely to land.
- Current owner paid $50k; list at $128k implies a 156% gain — meaningful room to come down on a strong offer.
Risks & watch-outs
- Watch-outs: built in 1951 — expect roof / HVAC / electrical / plumbing capex.
- Climate carrying-cost: severe wind risk, 99% chance of damaging wind over 30y; extreme-heat days projected 6→18/yr by 2055 (HVAC capex compounding) — expect insurance premiums to compound above CPI over the hold.
Questions for the listing agent
- Built in 1951 — when were the roof, HVAC, electrical panel, plumbing, and water heater last replaced?
- Is there a deadline driving the sale (1031 exchange, divorce, estate, relocation)? That informs how much negotiation room exists.
- Schools are D-rated, which usually means shorter tenancies and higher turnover. Who's the typical renter profile here, and what's been the actual vacancy rate?
- Crime grade is F in this area — have there been break-ins, vandalism, or insurance claims at this property in the last 3 years? What carrier currently insures it and at what premium?
- The area grade is low — what's the realistic commute time and amenity access for the typical tenant pool here? Any planned neighborhood developments (good or bad) we should know about?
- What's the average days-on-market for RENTAL listings here right now (not sales)? A rising rental-DOM trend means longer vacancies and softer asking-rent achievability than the comps imply.
- What's the recent tenant-quality profile in this submarket — average credit score on applications, eviction rate, late-payment / NSF rate, and stable-employment percentage? A property-management company in the area should have these aggregated.
- How much new for-sale + rental construction is in the pipeline within 1–3 miles? Heavy new supply typically softens prices + rents 12–24 months out; constrained supply supports both.
Investment metrics
- 1% rule
- 0.82% ✗
- Cap rate
- 6.87%
- Cash-on-cash
- 2.07%
- DSCR
- 1.09
- GRM
- 10.1
CMA / ARV
- ARV (on-the-fly)
- $45,414
- Comps found
- 12
Show comp detail 12 sales within ~0.75 mi
| Address | Dist | Beds/Ba | Sqft | Sold | Price | $/sf | Match |
|---|---|---|---|---|---|---|---|
| 2565 Kreitner St | 0.13mi | 2/1.0 | 915 (+9%) | 8mo | $149,999 | $164 | 73 |
| 460 Pinehill Dr | 0.38mi | 3/1.0 (+1) | 864 (+3%) | 3mo | $51,500 | $60 | 70 |
| 729 Jemison St | 0.39mi | 2/1.0 | 863 (+3%) | 13mo | $10,000 | $12 | 67 |
| 2067 Victory Ct | 0.73mi | 2/1.0 | 846 (+1%) | 5mo | $44,500 | $53 | 61 |
| 461 Pinehill Dr | 0.39mi | 2/1.0 | 802 (-5%) | 16mo | $59,433 | $74 | 60 |
| 731 Jemison St | 0.39mi | 2/1.0 | 951 (+13%) | 2mo | $75,531 | $79 | 58 |
| 419 Crenshaw St | 0.65mi | 3/1.0 (+1) | 872 (+4%) | 3mo | $36,000 | $41 | 56 |
| 702 Glenwood St | 0.62mi | 2/1.0 | 889 (+6%) | 7mo | $40,000 | $45 | 56 |
| 705 Euclid Ave | 0.57mi | 2/1.0 | 805 (-4%) | 20mo | $25,000 | $31 | 50 |
| 919 Rowell St | 0.48mi | 2/1.0 | 932 (+11%) | 16mo | $50,000 | $54 | 46 |
| 2407 Senator St | 0.44mi | 3/1.0 (+1) | 900 (+7%) | 20mo | $25,000 | $28 | 46 |
| 2561 Pleasant Valley Rd | 0.38mi | 3/1.0 (+1) | 925 (+10%) | 20mo | $90,000 | $97 | 43 |
Match score weights: distance 35% · size 25% · config 20% · recency 20%. Top-matched comps best support the ARV.
Projected returns pro-forma
-3.0% appreciation · 5.06% rent growth · sell at horizon
- IRR
- -11.0%
- Equity multiple
- 0.59×
- Total profit
- $-14,626
- Equity at exit
- $19,070
- IRR
- 0.6%
- Equity multiple
- 1.05×
- Total profit
- $1,623
- Equity at exit
- $11,058
Cash invested: $35,812 (down + closing). Projections, not guarantees.
Landlord ↔ Tenant lean methodology
- Overall (STATE)
- 90 Strongly Landlord-Friendly
- State Alabama
- 90 Strongly Landlord-Friendly · R+15
- County
- — inherits STATE
- City
- — inherits STATE
ZIP-level market 36606
- Rents YoY
- 5.1%
- Active inventory
- 175
- Price-to-rent
- 10.1×
Monthly cashflow live
- Estimated rent
- $1,052 high interval (Pro) →
- Mortgage (P&I)
- −$671
- Tax from tax record
- −$45 /mo · $540/yr
- Insurance
- −$53
- HOA
- −$0
- Vacancy / Maint / Mgmt
- −$221
- Net cashflow
- $62
Break-even live
Sensitivity live
| Price | -10% $134 | -5% $98 | +0% $62 | +5% $26 | +10% $-11 |
|---|---|---|---|---|---|
| Rent | -10% $-21 | -5% $20 | +0% $62 | +5% $103 | +10% $145 |
| Rate | -1.0pp $126 | -0.5pp $94 | base $62 | +0.5pp $29 | +1.0pp $-5 |
UW: 25.0% down · 7.5% · 30yr · 1.5% tax · 5.0% vac · 8.0% maint · 8.0% mgmt
Financing live
Cash to close
- Down payment
- $31,975
- Closing costs
- $3,837
- Reserves months
- —
- Total cash needed
- —
Loan-product check · same deal, 3 products live
Conventional
25% down · 7.5% · 30yr
- Down + closing
- —
- Monthly P&I
- —
- Monthly cashflow
- —
- DSCR
- —
- Eligible?
- —
Personal DTI + credit; lowest rate.
DSCR
20% down · 8.5% · 30yr
- Down + closing
- —
- Monthly P&I
- —
- Monthly cashflow
- —
- DSCR
- —
- Eligible?
- —
No personal income docs; deal must DSCR.
Hard money
10% down · 12.0% · 12mo
- Down + closing
- —
- Monthly P&I
- —
- Monthly cashflow
- —
- DSCR
- —
- Eligible?
- —
Short-term bridge; refi at stabilization.
Rent comps 29 comps
| Address | Beds | Baths | Sqft | Rent | $/sqft | DOM | Units | Dist |
|---|---|---|---|---|---|---|---|---|
| 900 Courtney St Mobile, AL | 2.0 | 1.0 | 1020 | $1,200 | $1.18 | 45d | 1 | 0.39mi |
| 767 Jemison St Mobile, AL | 2.0 | 1.0 | 850 | $750 | $0.88 | 45d | 1 | 0.43mi |
| 728 Bankhead Pl Mobile, AL | 2.0 | 1.0 | 810 | $675 | $0.83 | 45d | 1 | 0.49mi |
| 461 Magnolia Rd Unit A Mobile, AL | 2.0 | 1.0 | 989 | $825 | $0.83 | 45d | 1 | 0.57mi |
| 442 Cottage Hill Rd Unit 13 Mobile, AL | 1.0 | 1.0 | 637 | $860 | $1.35 | 45d | 1 | 0.60mi |
| 562 Clarke St Mobile, AL | 2.0 | 1.0 | 1061 | $1,025 | $0.97 | 45d | 1 | 0.63mi |
| 400 Westwood St Mobile, AL | 1.0–2.0 | 1.0 | 750 | $1,005 | $1.34 | 45d | 1 | 0.64mi |
| 2904 Pleasant Valley Rd Mobile, AL | 2.0 | 1.0 | 815 | $899 | $1.10 | 45d | 1 | 0.76mi |
| 2008 W Victory Dr Mobile, AL | 3.0 | 1.0 | 1011 | $1,200 | $1.19 | 45d | 1 | 0.76mi |
| 2656 Pathway Pl Mobile, AL | 2.0–3.0 | 1.0 | 778 | $949 | $1.22 | 15d | 9 | 0.78mi |
| 2901 Pleasant Valley Rd Mobile, AL | 1.0 | 1.0 | 578 | $775 | $1.34 | 45d | 1 | 0.78mi |
| 751 Farnell Ln Mobile, AL | 2.0 | 1.0 | 1100 | $1,400 | $1.27 | 45d | 1 | 0.81mi |
| 2503 Richard Ave Mobile, AL | 2.0 | 1.0 | 928 | $805 | $0.87 | 15d | 1 | 0.94mi |
| 2425 Nortons Ln Unit C Mobile, AL | 2.0 | 1.0 | 1050 | $1,200 | $1.14 | 45d | 1 | 0.95mi |
| 2425 Nortons Ln Unit D Mobile, AL | 2.0 | 1.0 | 1050 | $1,100 | $1.05 | 15d | 1 | 0.95mi |
| 2859 Brierwood Dr Mobile, AL | 3.0 | 1.0 | 1057 | $1,500 | $1.42 | 15d | 1 | 0.99mi |
| 957 Navco Rd Mobile, AL | 2.0 | 1.5 | 812 | $850 | $1.05 | 23d | 1 | 1.00mi |
| 505 Bel Air Blvd Mobile, AL | 1.0–2.0 | 1.0–2.0 | 976 | $1,274 | $1.30 | 15d | 16 | 1.01mi |
| 2500 Taylor Ave Mobile, AL | 2.0 | 1.0 | 840 | $1,195 | $1.42 | 45d | 1 | 1.02mi |
| 168 W Collins St Mobile, AL | 3.0 | 1.0 | 968 | $725 | $0.75 | 23d | 1 | 1.10mi |
| 276 S Sage Ave Mobile, AL | 1.0–2.0 | 1.0 | 850 | $1,055 | $1.24 | 45d | 1 | 1.11mi |
| 3171 Pleasant Valley Rd Mobile, AL | 2.0 | 1.0 | 875 | $800 | $0.91 | 45d | 1 | 1.15mi |
| 104 Ellinor St Mobile, AL | 2.0 | 1.0 | 896 | $1,275 | $1.42 | 23d | 1 | 1.20mi |
| 3210 Pleasant Valley Rd Mobile, AL | 2.0 | 1.0 | 850 | $825 | $0.97 | 45d | 1 | 1.23mi |
| 916 Delmar Dr Mobile, AL | 3.0 | 1.0 | 1100 | $1,400 | $1.27 | 15d | 1 | 1.29mi |
| 2161 Homewood St Unit B Mobile, AL | 1.0 | 1.0 | 600 | $1,295 | $2.16 | 23d | 1 | 1.31mi |
| 1302 Navco Rd Mobile, AL | 2.0 | 1.0 | 1009 | $935 | $0.93 | 15d | 13 | 1.37mi |
| 2604 Dauphin St #210 Mobile, AL | 2.0 | 1.0 | 950 | $1,150 | $1.21 | 23d | 1 | 1.47mi |
| 2604 Dauphin St Mobile, AL | 2.0 | 1.0 | 950 | $1,072 | $1.13 | 45d | 2 | 1.47mi |
Listing history 18 events
-
2026-06-21days on market $127,900 Active 6 DOM
-
2026-06-18days on market $127,900 Active 3 DOM
-
2026-06-17days on market $127,900 Active 2 DOM
-
2026-06-15remarks 699-char remark
-
2026-06-15pricedays on market $127,900 Active 1 DOM
-
2026-06-08days on market $130,000 Active 88 DOM
-
2026-06-07days on market $130,000 Active 87 DOM
-
2026-06-05days on market $130,000 Active 84 DOM
-
2026-06-03days on market $130,000 Active 83 DOM
-
2026-06-02days on market $130,000 Active 82 DOM
-
2026-06-01days on market $130,000 Active 81 DOM
-
2026-05-31days on market $130,000 Active 80 DOM
-
2026-05-30days on market $130,000 Active 79 DOM
-
2026-05-22status Active
-
2026-04-30status Pending
-
2026-04-28price $130,000
-
2026-02-19$135,000 Active
-
2025-08-11soldstatus $50,000
ⓘ Source: listings_history table (triggers on properties + properties_extension) + one-shot
backfill from property_details.listing_events for pre-trigger history.
Tax reassessment forecast AL · Resets to sale price
- Current annual tax
- $540 · $45/mo
- Projected year-2 tax
- $540 · $45/mo
- Expected delta
- $0/yr ($0/mo · 0.0%)
ⓘ Screening estimate from a state-policy table — verify with the county assessor before closing.
Climate risk First Street
- Flood 1/10 Low FEMA zone X (unshaded) · 0% chance over 30 yrs
- Wildfire 1/10 Low
- Heat 9/10 Extreme 6 d/yr ≥105°F today · 18 d/yr by 30 yrs out
- Wind 9/10 Extreme 99% chance of damaging wind over 30 yrs
- Air quality 2/10 Low 1 unhealthy d/yr today · 1 by 30 yrs out
Nearby sold comps map
Loading sold comps map…
Walkable amenities ~0.75 mi
Loading nearby amenities…
Taxation est. · year 1
- Rental income
- $12,618
- − Mortgage interest
- −$7,164
- − Property taxes
- −$540
- − Insurance
- −$640
- − Repairs & maintenance
- −$1,009
- − Management
- −$1,009
- − Depreciation
- −$3,721
- Taxable loss
- −$1,465
- Est. tax savings @ 24.0%
- +$352
- After-tax cash flow
- $1,092/yr
For passive investors: Depreciation is non-cash, so a rental often shows a tax loss while cash-flowing — sheltering income. Rental losses are passive: they offset passive income freely, and up to $25,000/yr can offset ordinary (W-2) income if you actively participate and your MAGI is under $100k (phasing out to $0 by $150k); unused losses carry forward. On sale, claimed depreciation is recaptured at up to 25%, and gains may owe capital-gains tax (a 1031 exchange can defer both). Figures are a year-1 estimate at your 24.0% rate — not tax advice; consult a CPA.
Schools (NCES district)
- District
- Mobile County
- NCES district ID
- 0102370
- Math proficiency
- 15% ▼ -28.00%
- Reading proficiency
- 39% ▬ 0.00%
- Median HH income
- $42,455
- Composite
- 22.9/100
- National rank
- #8002
- State rank
- #81 of 129 in AL
Livability — Mobile
- Score
- 75/100
- State rank
- #20
- US rank
- #4262
Category grades
Schools grade is shown separately in the Schools card above.
Census & demographics
- Census place
- Mobile, AL
- County
- Mobile County · 246,577 people
- City population
- 205,729
- Metro
- Mobile, AL
- Population (ZIP)
- 18,728
- Household income
- $51,303
- Rent vs Own
- Severe rent burden
- 999.0
Population outlook (Mobile County) Hauer SSP2
- Today (2025)
- 415,303 people
- By 2030
- 411,755 · -0.9%
- By 2040
- 399,670 · -3.8%
- By 2050
- 382,616 · -7.9%
- By 2075
- 337,353 · -18.8%
- By 2100
- 283,391 · -31.8%
Race, ethnicity, and origin ACS 2023
- Neighborhood character
- Majority Black (56%)
- Race & ethnicity
- Black 56% White 37% Two or more races 5% Hispanic / Latino 4%
- Common ancestry
- Italian 2% Scottish 2% Lithuanian 1%
- Foreign-born
- 3% · Canada
- Languages at home
- 96% English-only · Spanish 3%
Political lean MEDSL · Mobile
- 2024 margin
- R (+16.4) · D 41.3% · R 57.7%
- 2008→2024 swing
- -7.7pp toward R · 2008: -8.7pp · 2024: -16.4pp
- All cycles
- 2024: R+16.4 2020: R+11.9 2016: R+13.9 2012: R+9.3 2008: R+8.7
Not yet ingested
- Civics
- —
Market trends
- HPI YoY
- ▼ -232.19%
- Current HPI
- 145.9025
- Rent YoY
- ▲ 5.06%
- Metro
- Mobile, AL
- State GDP YoY
- ▲ 2.94%
- F500 in state
- 4
Industry mix (Fortune 500 HQ in AL)
| Industry | F500 HQs | Revenue |
|---|---|---|
| Financial Services | 1 | $8B |
|
||
| Healthcare | 1 | $5B |
|
||
Price history
+155.8% since first listed3 events — show timeline
- 2026-06-15 Listed $127,900 GCMLS AL
- 2026-04-28 Price Changed $130,000 GCMLS AL
- 2025-08-11 Sold (Public Records) $50,000 Public Records
Property tax history
+0.3%/yrLatest (2025): $540 · +6.2% YoY. Source: county tax records.
Cash-flow waterfall
monthlySold comps — $/sqft
last 12 mo · ≤1 miLoading sold comps…