 🏗️ New Construction
6728 Spanish Lakes Blvd · Vero Beach South, FL
Flood risk 1/10 · Minimal
- FEMA flood zone
- X (unshaded)
- Chance of flooding over 30 yrs
- 0.0%
- Est. flood insurance / yr
- $507 – $1,088
Fire risk 3/10 · Minor
- Est. fire insurance / yr
- $947 – $1,759
Heat risk 10/10 · Severe
- Hot days now (above 107°F)
- 7 days/yr
- Hot days in 30 yrs
- 24 days/yr
Wind risk 10/10 · Severe
- Chance of severe wind over 30 yrs
- 99.0%
Air-quality risk 1/10 · Minimal
- Unhealthy air days now
- 0 days/yr
- Unhealthy air days in 30 yrs
- 0 days/yr
Risk factors via First Street. Map © Google.
Why this score? — see what drove the C+ grade
The composite is a weighted blend of 9 inputs, each scored 0–100. Each bar is that input's sub-score; the figure is the points it added to the 100-point composite (weight × sub-score).
- Cash flow +26.3/30.0
- DSCR +8.9/10.0
- ARV discount +7.5/15.0
- 1% rule +7.0/10.0
- Livability +3.9/5.0
- Condition / age +3.8/5.0
- Schools +3.7/10.0
- Rent growth +2.5/5.0
- Appreciation +0.0/10.0
$279,000
🖨 Deal sheet (PDF) 📄 Offer letter ✓ Due diligence
Listing remarks
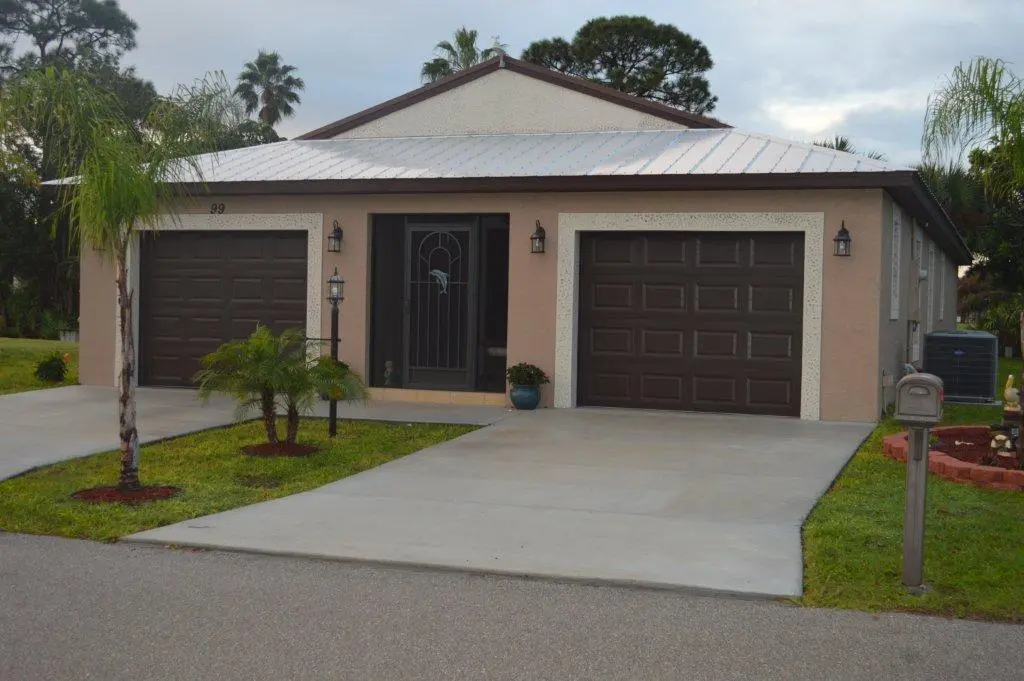
Our most Popular Model: The Windsor offers unmatched value with 3 full bedrooms, 2 baths, and a car garage + golf-cart garage. Enjoy high vaulted ceilings, a chef's kitchen with a large island, and open concept living perfect for entertaining. Built for comfort and peace of mind with solid block construction and impact windows. Whether you're relaxing at home or enjoying the clubhouse, golf course, or pickleball courts, this home delivers the 55+ lifestyle you've been dreaming of. All models are built with 3/16th true plywood roof sheathing, hurricane tie straps, R-30 insulation, & hip roof designs ensuring big insurance premium discounts. Our homes are equipped with all energy effici
Key facts
- Open concept living
- Hurricane tie straps
- Chef's kitchen
Tags
Property features AI
Finance
- Other: Home warranty included
- Financial info: Pets allowed with no restrictions
- HOA & community: Senior community
Exterior
- Parking: Attached 2-car garage with garage door opener; Two covered parking spaces
- Security: Security patrol
- Utilities: Public water; Public sewer; Three-phase electric; Sewer and water available
- Home design: Single family residence; New construction; One-story; Faces west
- Construction: Built by Wynne Building Corporation (model: The Windsor); Concrete/Stucco/CBS construction; Metal roof with wood truss/rafter; Built in 2026 (new construction)
- Exterior features: Covered patio; Open porch; Patio and porch areas; Paved road frontage; Not waterfront
Interior
- Kitchen: Dishwasher; Electric range; Microwave; Refrigerator; Electric water heater
- Bedrooms: Three bedrooms on the main level
- Flooring: Carpet; Laminate; Wood
- Bathrooms: Two full bathrooms
- Heating & cooling: Central electric heating; Central electric air conditioning
- Interior features: Cathedral ceilings; Vaulted ceilings; Entrance foyer; Kitchen island; Walk-in closets; Split bedroom layout; Pull-down attic stairs
- Laundry & utility: Laundry area inside the home
Neighborhood map
What this means for you Summary
Snapshot
- This is a 3-bed/2.0-bath single-family listed at $279k. Condition is rated good.
Deal economics
- At list price, monthly cash flow is $516 ($6k/yr) — positive.
- To cash-flow at today's rent, offer at most $274k (1.6% below list).
- To meet the 1% rule (rent ≥ 1% of price), the offer needs to be $240k (13.9% below list).
- Recommended offer: $240k (13.9% below list) — sets the bar for 1% rule.
- Cap rate 9.4% vs local median 4.3% in Vero Beach South — top-decile yield for the area; either an underpriced asset or a hidden risk that comps aren't pricing in. Stress-test before assuming the spread holds.
Location & tenants
- Location reads 78/100 on livability (#163 in FL, #2,445 nationally) — a middle-class / working-renter tenant base. Strengths: commute A+, housing A+, health & safety A; Watch: amenities F.
- St. Lucie (urban): math 40% / reading 48% proficiency, ranked #51 of 73 in FL (top 70%) — families likely to look elsewhere, expect single-tenant / working-renter base with shorter leases.
- Zoned schools: Manatee Academy K-8 (math 53% / reading 51%, grade C-, #990 of 2,144 statewide, top 48%, 1,664 students, 65% FRL); Southern Oaks Middle School (math 39% / reading 43%, grade F, #353 of 571 statewide, top 63%, 894 students, 76% FRL); Fort Pierce Central High School (math 15% / reading 45%, grade F, #441 of 667 statewide, top 67%, 3,091 students, 62% FRL).
- Market conditions: 296 active listings in the ZIP; 1 comparable units currently listed for rent nearby; 4,868 units permitted in St. Lucie County in 2024 (268 in 5+ unit buildings).
- At $2,401/mo this rent would consume 46% of the median local household income ($63k/yr) (locally 140% of renters already pay >50% of income on rent) — very limited rent-growth headroom before tenants either downsize or default.
Forward outlook
- Local home prices are declining (-3.0%/yr); year-one equity from $1k of loan paydown is wiped out by about $6k of value loss. Plan a longer hold.
- St. Lucie County population projected at +20% by 2050 — long-run rental-demand tailwind backs the buy-and-hold thesis.
- At projected returns (-3.0% appreciation + 3.0% rent growth), your $56k cash investment doubles in ~10 years — after that, you're playing with house money.
Negotiation context
- It's been on market 42 days — a 3% lower offer ($271k) is reasonable based on typical stale-listing flexibility.
- 4 sale attempts since 2y ago with the ask held roughly flat each time — persistent listings suggest the price (not the market) is what's stuck; bring a comps-based counter.
Risks & watch-outs
- Climate carrying-cost: severe wind risk, 99% chance of damaging wind over 30y; extreme-heat days projected 7→24/yr by 2055 (HVAC capex compounding) — expect insurance premiums to compound above CPI over the hold.
Questions for the listing agent
- It's been on market 42 days. Have you received any prior offers? Is the seller open to a 14% concession, seller financing, or rate buy-down credit?
- Is there a deadline driving the sale (1031 exchange, divorce, estate, relocation)? That informs how much negotiation room exists.
- What's the average days-on-market for RENTAL listings here right now (not sales)? A rising rental-DOM trend means longer vacancies and softer asking-rent achievability than the comps imply.
- What's the recent tenant-quality profile in this submarket — average credit score on applications, eviction rate, late-payment / NSF rate, and stable-employment percentage? A property-management company in the area should have these aggregated.
- How much new for-sale + rental construction is in the pipeline within 1–3 miles? Heavy new supply typically softens prices + rents 12–24 months out; constrained supply supports both.
Investment metrics
- 1% rule
- 1.20% ✓
- Cap rate
- 9.39%
- Cash-on-cash
- 11.06%
- DSCR
- 1.49
- GRM
- 6.9
CMA / ARV
- ARV (on-the-fly)
- $199,842
- Comps found
- 5
Show comp detail 5 sales within ~0.75 mi
| Address | Dist | Beds/Ba | Sqft | Sold | Price | $/sf | Match |
|---|---|---|---|---|---|---|---|
| 6539 Yedra Ave | 0.27mi | 2/2.5 (-1) | 1,839 (+5%) | 2mo | $309,000 | $168 | 70 |
| 6449 Alemendra St | 0.55mi | 3/2.5 | 1,753 (0%) | 5mo | $309,000 | $176 | 68 |
| 6631 Nuevo Lagos | 0.32mi | 3/2.0 | 1,714 (-2%) | 21mo | $175,000 | $102 | 64 |
| 14374 Azucena Court Ct | 0.38mi | 2/2.0 (-1) | 1,599 (-9%) | 9mo | $175,000 | $109 | 55 |
| 6655 Alemendra St | 0.44mi | 2/2.0 (-1) | 1,530 (-13%) | 2mo | $175,000 | $114 | 52 |
Match score weights: distance 35% · size 25% · config 20% · recency 20%. Top-matched comps best support the ARV.
Projected returns pro-forma
-3.0% appreciation · 3.0% rent growth · sell at horizon
- IRR
- 0.2%
- Equity multiple
- 1.01×
- Total profit
- $511
- Equity at exit
- $29,797
- IRR
- 9.9%
- Equity multiple
- 1.77×
- Total profit
- $42,902
- Equity at exit
- $17,279
Cash invested: $55,956 (down + closing). Projections, not guarantees.
Landlord ↔ Tenant lean methodology
- Overall (STATE)
- 87 Strongly Landlord-Friendly
- State Florida
- 87 Strongly Landlord-Friendly · R+3
- County
- — inherits STATE
- City
- — inherits STATE
ZIP-level market 34951
- Home prices YoY
- -23.6%
- Active inventory
- 296
- Price-to-rent
- 9.7×
Monthly cashflow live
- Estimated rent
- $2,401 medium interval (Pro) →
- Mortgage (P&I)
- −$1,048
- Tax est. 1.5%
- −$250 /mo · $2,998/yr
- Insurance
- −$83
- HOA
- −$0
- Vacancy / Maint / Mgmt
- −$504
- Net cashflow
- $516
Break-even live
Sensitivity live
| Price | -10% $654 | -5% $585 | +0% $516 | +5% $447 | +10% $378 |
|---|---|---|---|---|---|
| Rent | -10% $326 | -5% $421 | +0% $516 | +5% $611 | +10% $706 |
| Rate | -1.0pp $617 | -0.5pp $567 | base $516 | +0.5pp $464 | +1.0pp $411 |
UW: 25.0% down · 7.5% · 30yr · 1.5% tax · 5.0% vac · 8.0% maint · 8.0% mgmt
Financing live
Cash to close
- Down payment
- $49,960
- Closing costs
- $5,995
- Reserves months
- —
- Total cash needed
- —
Loan-product check · same deal, 3 products live
Conventional
25% down · 7.5% · 30yr
- Down + closing
- —
- Monthly P&I
- —
- Monthly cashflow
- —
- DSCR
- —
- Eligible?
- —
Personal DTI + credit; lowest rate.
DSCR
20% down · 8.5% · 30yr
- Down + closing
- —
- Monthly P&I
- —
- Monthly cashflow
- —
- DSCR
- —
- Eligible?
- —
No personal income docs; deal must DSCR.
Hard money
10% down · 12.0% · 12mo
- Down + closing
- —
- Monthly P&I
- —
- Monthly cashflow
- —
- DSCR
- —
- Eligible?
- —
Short-term bridge; refi at stabilization.
Rent comps 1 comps
| Address | Beds | Baths | Sqft | Rent | $/sqft | DOM | Units | Dist |
|---|---|---|---|---|---|---|---|---|
| 6765 Spanish Lakes Blvd Fort Pierce, FL | 2.0 | 2.0 | 1368 | $2,500 | $1.83 | 25d | 1 | 0.02mi |
Listing history 17 events
-
2026-06-07statusdays on market $279,000 Pending 42 DOM
-
2026-06-05days on market $279,000 Active 40 DOM
-
2026-06-03days on market $279,000 Active 39 DOM
-
2026-06-02days on market $279,000 Active 38 DOM
-
2026-06-01days on market $279,000 Active 37 DOM
-
2026-05-31days on market $279,000 Active 36 DOM
-
2026-05-30days on market $279,000 Active 35 DOM
-
2026-05-17price $279,000
-
2026-04-25$289,000 Active
-
2026-04-13historical
-
2026-02-04price $289,000
-
2025-06-08$299,000 Active
-
2025-05-13$299,000 Active
-
2025-05-12historical
-
2024-11-07price $299,000
-
2024-10-23$320,000 Active
-
2024-09-19price $309,000
ⓘ Source: listings_history table (triggers on properties + properties_extension) + one-shot
backfill from property_details.listing_events for pre-trigger history.
Climate risk First Street
- Flood 1/10 Low FEMA zone X (unshaded) · 0% chance over 30 yrs
- Wildfire 3/10 Moderate
- Heat 10/10 Extreme 7 d/yr ≥107°F today · 24 d/yr by 30 yrs out
- Wind 10/10 Extreme 99% chance of damaging wind over 30 yrs
- Air quality 1/10 Low 0 unhealthy d/yr today · 0 by 30 yrs out
Nearby sold comps map
Loading sold comps map…
Walkable amenities ~0.75 mi
Loading nearby amenities…
Taxation est. · year 1
- Rental income
- $28,815
- − Mortgage interest
- −$11,194
- − Property taxes
- −$2,998
- − Insurance
- −$999
- − Repairs & maintenance
- −$2,305
- − Management
- −$2,305
- − Depreciation
- −$5,814
- Taxable income
- $3,200
- Est. tax owed @ 24.0%
- −$768
- After-tax cash flow
- $5,423/yr
For passive investors: Depreciation is non-cash, so a rental often shows a tax loss while cash-flowing — sheltering income. Rental losses are passive: they offset passive income freely, and up to $25,000/yr can offset ordinary (W-2) income if you actively participate and your MAGI is under $100k (phasing out to $0 by $150k); unused losses carry forward. On sale, claimed depreciation is recaptured at up to 25%, and gains may owe capital-gains tax (a 1031 exchange can defer both). Figures are a year-1 estimate at your 24.0% rate — not tax advice; consult a CPA.
Condition & rehab AI · 3 photos
This home is in excellent condition with no visible repairs needed. It offers a good return on investment with updates that can significantly increase its resale and rental value.
Value-add opportunities
- Both Painting exterior and interior — Enhances curb appeal and interior aesthetics
- Both Landscaping improvements — Enhances curb appeal and adds value
- Both New roof inspection — Ensures durability and adds value
Renovation cost estimate screening
Value-add ROI direction
- Both Painting exterior and interior — Enhances curb appeal and interior aesthetics ↑
- Both Landscaping improvements — Enhances curb appeal and adds value ↑
- Both New roof inspection — Ensures durability and adds value ↑
ⓘ Cost ranges are severity-bucket heuristics (US national rule-of-thumb). Get contractor quotes + a written scope before underwriting a rehab budget.
Schools (NCES district)
- District
- St. Lucie
- NCES district ID
- 1201770
- Math proficiency
- 40% ▼ -11.00%
- Reading proficiency
- 48% ▼ -4.00%
- Median HH income
- $44,737
- Composite
- 37.28/100
- National rank
- #4449
- State rank
- #51 of 73 in FL
Livability — Vero Beach South
- Score
- 78/100
- State rank
- #163
- US rank
- #2445
Category grades
Schools grade is shown separately in the Schools card above.
Census & demographics
- County
- Saint Lucie County · 337,150 people
- Metro
- Port St. Lucie, FL
- Population (ZIP)
- 17,148
- Household income
- $63,122
- Rent vs Own
- Severe rent burden
- 140.0
Population outlook (St. Lucie County) Hauer SSP2
- Today (2025)
- 338,016 people
- By 2030
- 355,687 · +5.2%
- By 2040
- 385,521 · +14.1%
- By 2050
- 406,106 · +20.1%
- By 2075
- 441,054 · +30.5%
- By 2100
- 436,885 · +29.2%
Race, ethnicity, and origin ACS 2023
- Neighborhood character
- Predominantly White (74%)
- Race & ethnicity
- White 74% Black 13% Hispanic / Latino 8% Two or more races 7% Asian 2%
- Hispanic origin (detail)
- Mexican 2% Puerto Rican 2% Cuban 2%
- Common ancestry
- Romanian 3% Italian 2% Lithuanian 2%
- Foreign-born
- 10% · Canada, Jamaica, Vietnam
- Languages at home
- 88% English-only · Spanish 7% French/Haitian/Cajun 3% Vietnamese 1%
Political lean MEDSL · St. Lucie
- 2024 margin
- Lean R (+9.1) · D 45.1% · R 54.2%
- 2008→2024 swing
- -21.2pp toward R · 2008: 12.1pp · 2024: -9.1pp
- All cycles
- 2024: R+9.1 2020: R+1.6 2016: R+2.5 2012: D+7.9 2008: D+12.1
Not yet ingested
- Civics
- —
Market trends
- HPI YoY
- ▼ -106.06%
- Current HPI
- 343.1376
- Rent YoY
- —
- Metro
- Port St. Lucie, FL
- State GDP YoY
- ▲ 3.28%
- F500 in state
- 36
Industry mix (Fortune 500 HQ in FL)
| Industry | F500 HQs | Revenue |
|---|---|---|
| Industrial Technology | 2 | $29B |
|
||
| Insurance | 2 | $17B |
|
||
| Retail | 1 | $60B |
|
||
| Technology Distribution | 1 | $58B |
|
||
| Homebuilding | 1 | $35B |
|
||
| Technology Manufacturing | 1 | $35B |
|
||
Price history
-9.7% since first listed10 events — show timeline
- 2026-05-17 Price Changed $279,000 Beaches MLS
- 2026-04-25 Listed $289,000 Beaches MLS
- 2026-04-13 Listing Removed — Beaches MLS
- 2026-02-04 Price Changed $289,000 Beaches MLS
- 2025-06-08 Listed $299,000 RAIRCMLS
- 2025-05-13 Listed $299,000 Beaches MLS
- 2025-05-12 Listing Removed — Beaches MLS
- 2024-11-07 Price Changed $299,000 Beaches MLS
- 2024-10-23 Listed $320,000 Beaches MLS
- 2024-09-19 Price Changed $309,000 RAIRCMLS
Cash-flow waterfall
monthlySold comps — $/sqft
last 12 mo · ≤1 miLoading sold comps…