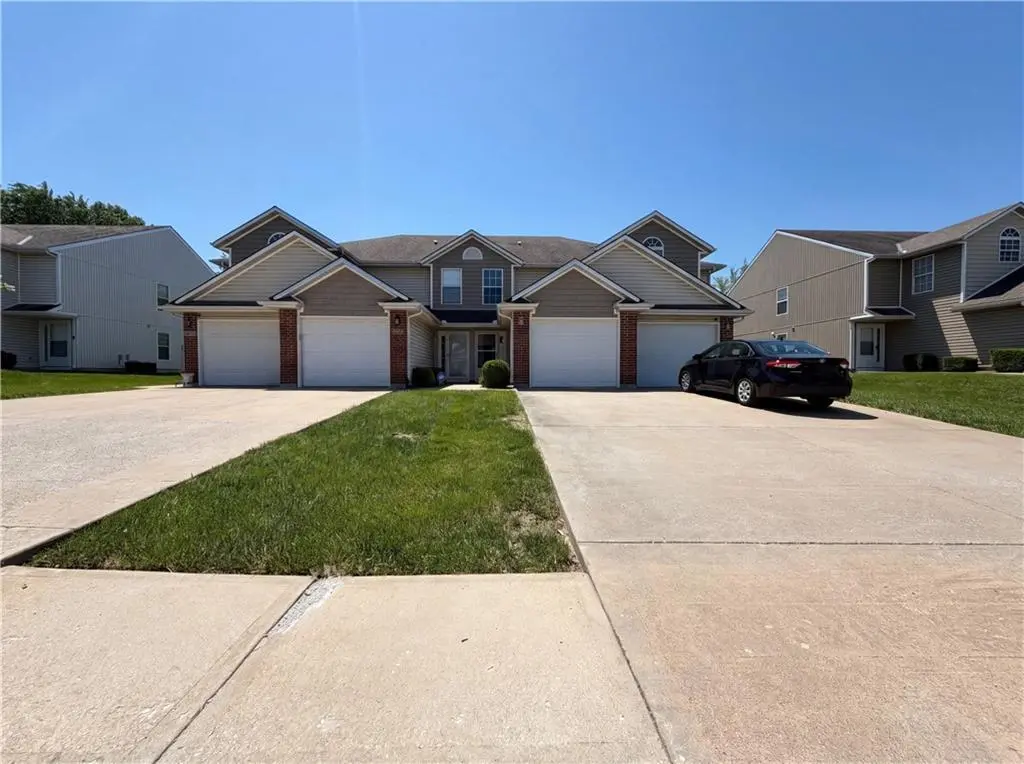
10559 E 46th Ter · Kansas City, MO
Flood risk 1/10 · Minimal
- FEMA flood zone
- X (unshaded)
- Chance of flooding over 30 yrs
- 0.0%
- Est. flood insurance / yr
- $507 – $1,088
Fire risk 1/10 · Minimal
- Est. fire insurance / yr
- $1,054 – $1,958
Heat risk 4/10 · Minor
- Hot days now (above 106°F)
- 7 days/yr
- Hot days in 30 yrs
- 17 days/yr
Wind risk 2/10 · Minimal
- Chance of severe wind over 30 yrs
- —
Air-quality risk 3/10 · Minor
- Unhealthy air days now
- 3 days/yr
- Unhealthy air days in 30 yrs
- 5 days/yr
Risk factors via First Street. Map © Google.
Why this score? — see what drove the D grade
The composite is a weighted blend of 9 inputs, each scored 0–100. Each bar is that input's sub-score; the figure is the points it added to the 100-point composite (weight × sub-score).
- Cash flow +12.7/30.0
- ARV discount +10.4/15.0
- 1% rule +4.1/10.0
- Livability +3.9/5.0
- DSCR +3.8/10.0
- Rent growth +2.8/5.0
- Condition / age +2.5/5.0
- Schools +1.8/10.0
- Appreciation +0.0/10.0
$170,000
🖨 Deal sheet (PDF) 📄 Offer letter ✓ Due diligence
Listing remarks MLS
Like new townhome has 2 large bedrooms and 2 full baths and a 1 car garage. Large eat in kitchen and living room with gas fireplace. Priced for a quick sale so bring your buyers!
Key facts
- Warm fireplace
- Accent backsplash
- $67 HOA
Tags
Property features AI
Finance
- Other: Living area approximately 1,278 (public records); Property age reported as 16–20 years
- HOA & community: Timbers East Townhomes HOA; HOA dues $200 quarterly; No maintenance provided
Exterior
- Parking: Attached garage with space for 1 car
- Utilities: Public water; Public sewer
- Home design: Attached townhouse; 2-story layout; Residential property
- Construction: Vinyl siding; Composition roof
- Exterior features: Lot about 871 square feet; Flood plain status unknown
Interior
- Bedrooms: 2 bedrooms
- Bathrooms: 2 full baths and 1 half bath
- Heating & cooling: Forced air heating; Electric cooling (central)
- Interior features: One fireplace
Neighborhood map
What this means for you Summary
Snapshot
- This is a 2-bed/2.5-bath townhouse listed at $170k.
Deal economics
- At list price, monthly cash flow is $-20 ($-236/yr) — negative.
- To cash-flow at today's rent, offer at most $167k (2.0% below list).
- To meet the 1% rule (rent ≥ 1% of price), the offer needs to be $155k (8.7% below list).
- Recommended offer: $155k (8.7% below list) — sets the bar for 1% rule.
- Cap rate 6.2% vs local median 3.9% in Kansas City — top-decile yield for the area; either an underpriced asset or a hidden risk that comps aren't pricing in. Stress-test before assuming the spread holds.
Location & tenants
- Location reads 78/100 on livability (#28 in MO, #2,671 nationally) — a middle-class / working-renter tenant base. Strengths: amenities A+, commute A+, cost of living A+; Watch: crime F.
- Raytown C-2 (suburban): math 12% / reading 28% proficiency, ranked #302 of 324 in MO (top 93%) — low school quality limits family demand, transient renter base, plan for 1-2y turnover.
- Zoned schools: Little Blue Elementary (math 12% / reading 27%, grade F, #941 of 1,115 statewide, top 86%, 373 students, 65% FRL); Raytown Middle (math 11% / reading 25%, grade F, #349 of 391 statewide, top 89%, 731 students, 73% FRL); Raytown Sr. High (math 7% / reading 29%, grade F, #482 of 521 statewide, top 92%, 1,365 students, 65% FRL).
- Market conditions: Rents rising (+1.3%/yr); 208 active listings in the ZIP; 16 comparable units currently listed for rent nearby; rentals leasing fast (median 10d on market — plan ~1-2 weeks tenant-placement turnaround); 4,002 units permitted in Jackson County in 2024 (2,271 in 5+ unit buildings).
Forward outlook
- Local home prices are declining (-3.0%/yr); year-one equity from $1k of loan paydown is wiped out by about $5k of value loss. Plan a longer hold.
- Jackson County population projected at +4% by 2050 — modest demand growth; plan on rents tracking national, not racing it.
Negotiation context
- It's been on market 25 days — a 2% lower offer ($167k) is reasonable based on typical stale-listing flexibility.
- 4 sale attempts since 20y ago with the ask held roughly flat each time — persistent listings suggest the price (not the market) is what's stuck; bring a comps-based counter.
Questions for the listing agent
- What do current leases actually rent for vs. the listed asking? Can we see a recent rent roll and the last 12 months of T-12 income?
- What does the HOA fee cover, when was the last increase, and are there any pending special assessments or reserve-fund shortfalls?
- Is there a deadline driving the sale (1031 exchange, divorce, estate, relocation)? That informs how much negotiation room exists.
- Crime grade is F in this area — have there been break-ins, vandalism, or insurance claims at this property in the last 3 years? What carrier currently insures it and at what premium?
- The area grade is low — what's the realistic commute time and amenity access for the typical tenant pool here? Any planned neighborhood developments (good or bad) we should know about?
- What's the average days-on-market for RENTAL listings here right now (not sales)? A rising rental-DOM trend means longer vacancies and softer asking-rent achievability than the comps imply.
- What's the recent tenant-quality profile in this submarket — average credit score on applications, eviction rate, late-payment / NSF rate, and stable-employment percentage? A property-management company in the area should have these aggregated.
- How much new for-sale + rental construction is in the pipeline within 1–3 miles? Heavy new supply typically softens prices + rents 12–24 months out; constrained supply supports both.
Investment metrics
- 1% rule
- 0.91% ✗
- Cap rate
- 6.15%
- Cash-on-cash
- -0.49%
- DSCR
- 0.98
- GRM
- 9.1
CMA / ARV
- ARV (median comp)
- $181,704
- List price
- $170,000
- Delta
- -6.44%
- Verdict
- FAIR
- Comps
- 20 within 1.0 mi
Show comp detail 12 sales within ~0.75 mi
| Address | Dist | Beds/Ba | Sqft | Sold | Price | $/sf | Match |
|---|---|---|---|---|---|---|---|
| 10631 E 46th Ter | 0.03mi | 2/2.5 | 1,263 (-1%) | 1mo | $189,500 | $150 | 96 |
| 10633 E 46th Ter | 0.04mi | 2/2.5 | 1,256 (-2%) | 4mo | $185,000 | $147 | 92 |
| 10612 E 46th Ter | 0.04mi | 2/2.5 | 1,272 (-0%) | 10mo | $185,000 | $145 | 89 |
| 10720 E 46th Ter | 0.18mi | 2/2.0 | 1,280 (+0%) | 1mo | $330,000 | $258 | 88 |
| 10719 E 46th Ter | 0.17mi | 3/2.0 (+1) | 1,300 (+2%) | 0mo | $225,000 | $173 | 82 |
| 10623 E 46th St | 0.06mi | 2/2.5 | 1,214 (-5%) | 8mo | $183,000 | $151 | 82 |
| 10547 E 46th Ter | 0.01mi | 3/2.5 (+1) | 1,374 (+8%) | 3mo | $164,900 | $120 | 80 |
| 10721 46th Ter E | 0.18mi | 3/2.0 (+1) | 1,300 (+2%) | 4mo | $225,000 | $173 | 79 |
| 10717 E 46th Ter | 0.16mi | 3/2.0 (+1) | 1,300 (+2%) | 7mo | $225,000 | $173 | 77 |
| 10715 46th Ter E | 0.15mi | 3/2.0 (+1) | 1,300 (+2%) | 8mo | $225,000 | $173 | 77 |
| 10609 E 41st St | 0.74mi | 2/1.5 | 1,256 (-2%) | 9mo | $125,000 | $100 | 51 |
| 10536 E 45th Ter | 0.20mi | 3/2.0 (+1) | 1,467 (+15%) | 10mo | $250,000 | $170 | 51 |
Match score weights: distance 35% · size 25% · config 20% · recency 20%. Top-matched comps best support the ARV.
Projected returns pro-forma
-3.0% appreciation · 1.34% rent growth · sell at horizon
- IRR
- -19.1%
- Equity multiple
- 0.34×
- Total profit
- $-31,281
- Equity at exit
- $25,348
- IRR
- -15.6%
- Equity multiple
- 0.19×
- Total profit
- $-38,699
- Equity at exit
- $14,698
Cash invested: $47,600 (down + closing). Projections, not guarantees.
Landlord ↔ Tenant lean methodology
- Overall (STATE)
- 81 Strongly Landlord-Friendly
- State Missouri
- 81 Strongly Landlord-Friendly · R+10
- County
- — inherits STATE
- City
- — inherits STATE
ZIP-level market 64133
- Rents YoY
- 1.3%
- Active inventory
- 208
- Price-to-rent
- 9.1×
Monthly cashflow live
- Estimated rent
- $1,552 high interval (Pro) →
- Mortgage (P&I)
- −$891
- Tax from tax record
- −$217 /mo · $2,598/yr
- Insurance
- −$71
- HOA
- −$67
- Vacancy / Maint / Mgmt
- −$326
- Net cashflow
- $-20
Break-even live
Sensitivity live
| Price | -10% $77 | -5% $28 | +0% $-20 | +5% $-68 | +10% $-116 |
|---|---|---|---|---|---|
| Rent | -10% $-142 | -5% $-81 | +0% $-20 | +5% $42 | +10% $103 |
| Rate | -1.0pp $66 | -0.5pp $24 | base $-20 | +0.5pp $-64 | +1.0pp $-108 |
UW: 25.0% down · 7.5% · 30yr · 1.5% tax · 5.0% vac · 8.0% maint · 8.0% mgmt
Financing live
Cash to close
- Down payment
- $42,500
- Closing costs
- $5,100
- Reserves months
- —
- Total cash needed
- —
Loan-product check · same deal, 3 products live
Conventional
25% down · 7.5% · 30yr
- Down + closing
- —
- Monthly P&I
- —
- Monthly cashflow
- —
- DSCR
- —
- Eligible?
- —
Personal DTI + credit; lowest rate.
DSCR
20% down · 8.5% · 30yr
- Down + closing
- —
- Monthly P&I
- —
- Monthly cashflow
- —
- DSCR
- —
- Eligible?
- —
No personal income docs; deal must DSCR.
Hard money
10% down · 12.0% · 12mo
- Down + closing
- —
- Monthly P&I
- —
- Monthly cashflow
- —
- DSCR
- —
- Eligible?
- —
Short-term bridge; refi at stabilization.
Rent comps 16 comps
| Address | Beds | Baths | Sqft | Rent | $/sqft | DOM | Units | Dist |
|---|---|---|---|---|---|---|---|---|
| 10410 E 45th Ter Kansas City, MO | 3.0 | 2.0 | 1774 | $1,849 | $1.04 | 3d | 1 | 0.19mi |
| 10408 E 45th Ter Kansas City, MO | 3.0 | 2.0 | 1774 | $2,100 | $1.18 | 45d | 1 | 0.19mi |
| 10415 E 43rd St Kansas City, MO | 1.0–2.0 | 1.0–2.0 | 784 | $1,084 | $1.38 | 3d | 12 | 0.35mi |
| 4808 Appleton Ave Kansas City, MO | 3.0 | 1.0 | 925 | $1,395 | $1.51 | 16d | 1 | 0.35mi |
| 4837 Overton Ave Kansas City, MO | 3.0 | 1.5 | 1344 | $1,611 | $1.20 | 23d | 1 | 0.53mi |
| 4934 Appleton Ave Kansas City, MO | 3.0 | 2.0 | 1000 | $1,395 | $1.40 | 18d | 1 | 0.53mi |
| 10500 E 42nd St Kansas City, MO | 1.0–3.0 | 1.0–2.5 | 915 | $1,084 | $1.19 | 18d | 2 | 0.63mi |
| 5035 Overton Ave Kansas City, MO | 3.0 | 2.0 | 1323 | $1,795 | $1.36 | 45d | 1 | 0.69mi |
| 11508 E 51st St Raytown, MO | 3.0 | 1.0 | 1644 | $1,500 | $0.91 | 4d | 1 | 0.84mi |
| 3927 Willow Ave Kansas City, MO | 1.0–3.0 | 1.0–2.0 | 997 | $1,152 | $1.15 | 3d | 11 | 0.89mi |
| 5517 Willow Ave Raytown, MO | 3.0 | 2.0 | 1415 | $1,850 | $1.31 | 3d | 1 | 1.12mi |
| 11121 E 56th Ter Raytown, MO | 2.0 | 1.0 | 1120 | $1,295 | $1.16 | 16d | 1 | 1.33mi |
| 5312 Hunter St Raytown, MO | 3.0 | 1.5 | 912 | $1,450 | $1.59 | 3d | 1 | 1.42mi |
| 5312 Hunter St Raytown, MO | 3.0 | 1.5 | 912 | $1,450 | $1.59 | 4d | 1 | 1.42mi |
| 12701 E 47th Terrace Ct S Independence, MO | 3.0 | 2.0 | 1597 | $2,000 | $1.25 | 5d | 1 | 1.46mi |
| 5106 S Grand Ave Independence, MO | 3.0 | 1.0 | 1218 | $1,586 | $1.30 | 9d | 1 | 1.49mi |
HOA detail
- Monthly dues
- $67 · $804/yr
- Likely covers
- gas
Listing history 14 events
-
2026-06-21days on market $170,000 Active 25 DOM
-
2026-06-18days on market $170,000 Active 22 DOM
-
2026-06-17status $170,000 Active 21 DOM
-
2026-06-07statusdays on market $170,000 Pending 21 DOM
-
2026-06-03days on market $170,000 Active 20 DOM
-
2026-06-02days on market $170,000 Active 19 DOM
-
2026-06-01days on market $170,000 Active 18 DOM
-
2026-05-31days on market $170,000 Active 17 DOM
-
2026-05-14$170,000 Active 426-char remark
-
2012-02-21$72,500 178-char remark
Show marketing remark (178 chars)
Like new townhome has 2 large bedrooms and 2 full baths and a 1 car garage. Large eat in kitchen and living room with gas fireplace. Priced for a quick sale so bring your buyers!
-
2007-03-08soldstatus
-
2007-02-20soldstatus
-
2007-02-16soldstatus
Show marketing remark (369 chars)
Lowest price in the area for new construction. Very large townhome with elegant interior; includes refrig, garage dr opener, microwave. No maintenance at all, low dues. Can live here for a while, then have your first investment property later-$2000 to closing costs! Near brand new shopping center opening in 2007--close to highways and everywhere! Zero down financing.
-
2006-08-08$99,900
Show marketing remark (369 chars)
Lowest price in the area for new construction. Very large townhome with elegant interior; includes refrig, garage dr opener, microwave. No maintenance at all, low dues. Can live here for a while, then have your first investment property later-$2000 to closing costs! Near brand new shopping center opening in 2007--close to highways and everywhere! Zero down financing.
ⓘ Source: listings_history table (triggers on properties + properties_extension) + one-shot
backfill from property_details.listing_events for pre-trigger history.
Tax reassessment forecast MO · Resets to sale price
- Current annual tax
- $2,598 · $217/mo
- Projected year-2 tax
- $2,598 · $217/mo
- Expected delta
- $0/yr ($0/mo · 0.0%)
ⓘ Screening estimate from a state-policy table — verify with the county assessor before closing.
Climate risk First Street
- Flood 1/10 Low FEMA zone X (unshaded) · 0% chance over 30 yrs
- Wildfire 1/10 Low
- Heat 4/10 Moderate 7 d/yr ≥106°F today · 17 d/yr by 30 yrs out
- Wind 2/10 Low
- Air quality 3/10 Moderate 3 unhealthy d/yr today · 5 by 30 yrs out
Nearby sold comps map
Loading sold comps map…
Walkable amenities ~0.75 mi
Loading nearby amenities…
Taxation est. · year 1
- Rental income
- $18,626
- − Mortgage interest
- −$9,523
- − Property taxes
- −$2,598
- − Insurance
- −$850
- − Repairs & maintenance
- −$1,490
- − Management
- −$1,490
- − HOA
- −$804
- − Depreciation
- −$4,945
- Taxable loss
- −$3,074
- Est. tax savings @ 24.0%
- +$738
- After-tax cash flow
- $502/yr
For passive investors: Depreciation is non-cash, so a rental often shows a tax loss while cash-flowing — sheltering income. Rental losses are passive: they offset passive income freely, and up to $25,000/yr can offset ordinary (W-2) income if you actively participate and your MAGI is under $100k (phasing out to $0 by $150k); unused losses carry forward. On sale, claimed depreciation is recaptured at up to 25%, and gains may owe capital-gains tax (a 1031 exchange can defer both). Figures are a year-1 estimate at your 24.0% rate — not tax advice; consult a CPA.
Schools (NCES district)
- District
- Raytown C-2
- NCES district ID
- 2926070
- Math proficiency
- 12% ▼ -11.00%
- Reading proficiency
- 28% ▼ -9.00%
- Median HH income
- $47,215
- Composite
- 17.59/100
- National rank
- #9039
- State rank
- #302 of 324 in MO
Livability — Kansas City
- Score
- 78/100
- State rank
- #28
- US rank
- #2671
Category grades
Schools grade is shown separately in the Schools card above.
Census & demographics
- Census place
- Kansas City, MO
- County
- Jackson County · 687,798 people
- City population
- 439,467
- Metro
- Kansas City, MO-KS
- Population (ZIP)
- 36,249
- Household income
- $67,750
- Rent vs Own
- Severe rent burden
- 1173.0
Population outlook (Jackson County) Hauer SSP2
- Today (2025)
- 719,589 people
- By 2030
- 731,456 · +1.6%
- By 2040
- 746,689 · +3.8%
- By 2050
- 749,289 · +4.1%
- By 2075
- 736,227 · +2.3%
- By 2100
- 668,210 · -7.1%
Race, ethnicity, and origin ACS 2023
- Neighborhood character
- Diverse neighborhood (Simpson 0.64)
- Race & ethnicity
- White 46% Black 37% Hispanic / Latino 12% Two or more races 9%
- Hispanic origin (detail)
- Mexican 10%
- Common ancestry
- Italian 7% Slovak 1% Lithuanian 1%
- Foreign-born
- 5% · Canada
- Languages at home
- 90% English-only · Spanish 7% French/Haitian/Cajun 1%
Political lean MEDSL · Jackson
- 2024 margin
- D (+19.3) · D 58.9% · R 39.5% · Other 1.6%
- 2008→2024 swing
- -6.1pp toward R · 2008: 25.4pp · 2024: 19.3pp
- All cycles
- 2024: D+19.3 2020: D+22.0 2016: D+16.6 2012: D+19.0 2008: D+25.4
Not yet ingested
- Civics
- —
Market trends
- HPI YoY
- ▼ -155.40%
- Current HPI
- 263.6915
- Rent YoY
- ▲ 1.34%
- Metro
- Kansas City, MO-KS
- State GDP YoY
- ▲ 1.84%
- F500 in state
- 20
Industry mix (Fortune 500 HQ in MO)
| Industry | F500 HQs | Revenue |
|---|---|---|
| Healthcare | 1 | $163B |
|
||
| Insurance | 1 | $21B |
|
||
| Industrial Technology | 1 | $17B |
|
||
| Retail | 1 | $16B |
|
||
| Industrial Distribution | 1 | $10B |
|
||
| Utilities | 1 | $9B |
|
||
Price history
+70.2% since first listed10 events — show timeline
- 2026-06-17 Relisted — Heartland MLS as Distributed by MLS Grid
- 2026-06-04 Pending — Heartland MLS as Distributed by MLS Grid
- 2026-06-04 Listing Removed — Heartland MLS as Distributed by MLS Grid
- 2026-05-14 Listed $170,000 Heartland MLS as Distributed by MLS Grid
- 2026-05-07 Sold (Public Records) — Public Records
- 2012-02-21 Listed $72,500 Heartland MLS as Distributed by MLS Grid
- 2007-03-08 Sold (Public Records) — Public Records
- 2007-02-20 Sold (Public Records) — Public Records
- 2007-02-16 Sold (MLS) — Heartland MLS as Distributed by MLS Grid
- 2006-08-08 Listed $99,900 Heartland MLS as Distributed by MLS Grid
Property tax history
+5.5%/yrLatest (2025): $2,598 · -9.0% YoY. Source: county tax records.
Cash-flow waterfall
monthlySold comps — $/sqft
last 12 mo · ≤1 miLoading sold comps…