 Fourplex
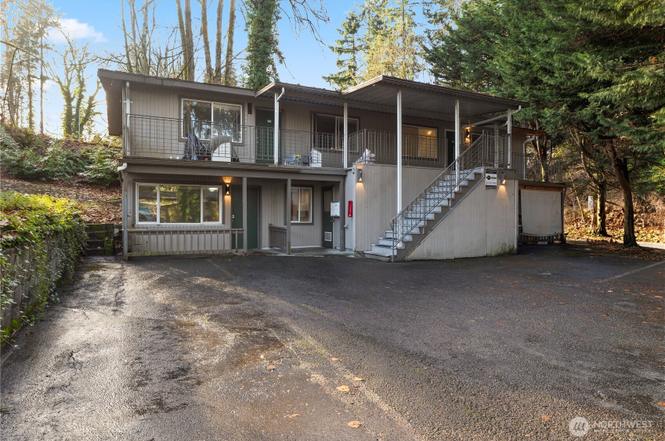
4809 S 252nd Pl · Kent, WA
Flood risk 1/10 · Minimal
- FEMA flood zone
- X (unshaded)
- Chance of flooding over 30 yrs
- 0.0%
- Est. flood insurance / yr
- $507 – $1,088
Fire risk 1/10 · Minimal
- Est. fire insurance / yr
- $604 – $1,122
Heat risk 3/10 · Minor
- Hot days now (above 88°F)
- 6 days/yr
- Hot days in 30 yrs
- 12 days/yr
Wind risk 1/10 · Minimal
- Chance of severe wind over 30 yrs
- —
Air-quality risk 7/10 · Major
- Unhealthy air days now
- 9 days/yr
- Unhealthy air days in 30 yrs
- 10 days/yr
Risk factors via First Street. Map © Google.
Why this score? — see what drove the D grade
The composite is a weighted blend of 9 inputs, each scored 0–100. Each bar is that input's sub-score; the figure is the points it added to the 100-point composite (weight × sub-score).
- Cash flow +14.9/30.0
- ARV discount +7.5/15.0
- Schools +4.8/10.0
- DSCR +4.6/10.0
- Livability +4.0/5.0
- 1% rule +3.5/10.0
- Condition / age +2.5/5.0
- Rent growth +2.3/5.0
- Appreciation +0.0/10.0
$900,000
🖨 Deal sheet 📄 Offer letter ✓ Due diligence
Multi-family units
County records classify this as Multi-Family (2-4 Unit). Listing-text estimate: 4 units. confirmed
Listing remarks
Timber Heights 4-plex for sale. The subject property has benefited from recent capital improvements, including updated property systems, new roof and modernized interior finishes. The combination of updated interiors, improved building systems, and efficient layouts positions the properties as attractive, low-management investments with predictable cash flow for years to come. This turn key deal is being offered for sale both as in individual sale or as a joint sale alongside the adjacent fourplex currently on the market. Please reference the document room for access to marketing, rent roll and form 17.
Key facts
- Efficient layouts
- New roof
- 7,400 sq ft lot
Tags
Property features AI
Finance
- Other: 4 total units; No units below grade; Vacancy rate: 5%; Unit rents (actual): 4807-A $1,695; 4807-B $1,220; 4809-A $1,695; 4809-B $1,695
- Financial info: Gross scheduled income: $81,486; Gross adjusted income: $77,411; Total monthly income: $6,790; Total expenses: $20,036; Insurance expense: $2,000; Other expense: $5,870; Net operating income: $57,375; Gross rent multiplier: 12.2; Listing terms: Conventional
Exterior
- Parking: 8 uncovered parking spaces
- Utilities: Sewer connected; Electric service
- Home design: Residential income property (multi-family quadruplex); 2-story structure; Good condition; Flat roof
- Construction: Wood construction; Built in 1990 (effective year); Slab foundation
- Exterior features: Wood products siding; Located on a cul-de-sac
Interior
- Kitchen: Range/oven in every unit; Refrigerator in every unit; Dishwasher in every unit
- Bedrooms: Unit 4807 - A: 2 bedrooms; Unit 4807 - B: 2 bedrooms; Unit 4809 - A: 2 bedrooms; Unit 4809 - B: 2 bedrooms
- Flooring: Vinyl plank
- Bathrooms: Each unit has 1 bathroom
- Heating & cooling: Forced air heating; No central cooling
- Interior features: Vinyl plank flooring
- Laundry & utility: Electric energy source
Neighborhood map
What this means for you Summary
Snapshot
- This is a 4 × 2-bed/1.0-bath units multifamily listed at $900k.
Deal economics
- At list price, monthly cash flow is $263 ($3k/yr) — positive. Per door: $66/mo.
- The deal already cash-flows at list — no discount required.
- To meet the 1% rule (rent ≥ 1% of price), the offer needs to be $761k (15.4% below list).
- Recommended offer: $761k (15.4% below list) — sets the bar for 1% rule.
- Cap rate 6.6% vs local median 2.7% in Kent — top-decile yield for the area; either an underpriced asset or a hidden risk that comps aren't pricing in. Stress-test before assuming the spread holds.
Location & tenants
- Location reads 79/100 on livability (#109 in WA, #2,154 nationally) — a middle-class / working-renter tenant base. Strengths: amenities A+, commute A+, housing A+; Watch: schools C-, crime F, cost of living F.
- Kent School District (urban): math 47% / reading 57% proficiency, ranked #109 of 291 in WA (top 38%) — acceptable for families but not a draw, mixed tenant base, ~2y average lease.
- Market conditions: Rents soft (-0.7%/yr); 124 active listings in the ZIP; solid renter incomes; 10,555 units permitted in King County in 2024 (7,119 in 5+ unit buildings).
- At $7,612/mo this rent would consume 111% of the median local household income ($83k/yr) (locally 2581% of renters already pay >50% of income on rent) — very limited rent-growth headroom before tenants either downsize or default.
Forward outlook
- Local home prices are declining (-3.0%/yr); year-one equity from $6k of loan paydown is wiped out by about $27k of value loss. Plan a longer hold.
- King County population projected at +44% by 2050 — long-run rental-demand tailwind backs the buy-and-hold thesis.
Negotiation context
- It's been on market 113 days — a 9% lower offer ($819k) is reasonable based on typical stale-listing flexibility.
- 2 sale attempts; this cycle's ask has dropped $100k (10%) from the opening price — seller is motivated, your offer sets the floor, not the list.
Questions for the listing agent
- It's been on market 113 days. Have you received any prior offers? Is the seller open to a 15% concession, seller financing, or rate buy-down credit?
- Can we see the unit-by-unit rent roll, current vacancy, and any below-market leases? What's the average tenancy length?
- What capital expenditures (roof, boiler, parking lot, exteriors) have been made in the last 5 years, and what's planned in the next 2?
- Built in 1963 — when were the roof, HVAC, electrical panel, plumbing, and water heater last replaced?
- Why hasn't it sold? Are there any deal-killer items the seller is aware of (foundation, flood, title, zoning, code violations)?
- Is there a deadline driving the sale (1031 exchange, divorce, estate, relocation)? That informs how much negotiation room exists.
- Crime grade is F in this area — have there been break-ins, vandalism, or insurance claims at this property in the last 3 years? What carrier currently insures it and at what premium?
- The area grade is low — what's the realistic commute time and amenity access for the typical tenant pool here? Any planned neighborhood developments (good or bad) we should know about?
- What's the average days-on-market for RENTAL listings here right now (not sales)? A rising rental-DOM trend means longer vacancies and softer asking-rent achievability than the comps imply.
- What's the recent tenant-quality profile in this submarket — average credit score on applications, eviction rate, late-payment / NSF rate, and stable-employment percentage? A property-management company in the area should have these aggregated.
- How much new apartment / multifamily construction is in the pipeline within 1–3 miles? Heavy new supply (>2% of stock underway) typically softens rents 12–24 months out; light construction supports rent growth.
Investment metrics
- 1% rule
- 0.85% ✗
- Cap rate
- 6.64%
- Cash-on-cash
- 1.25%
- DSCR
- 1.06
- GRM
- 9.9
CMA / ARV
No comps found within radius.
Projected returns pro-forma
-3.0% appreciation · 0.0% rent growth · sell at horizon
- IRR
- -17.5%
- Equity multiple
- 0.40×
- Total profit
- $-151,582
- Equity at exit
- $134,193
- IRR
- -16.0%
- Equity multiple
- 0.22×
- Total profit
- $-197,358
- Equity at exit
- $77,816
Cash invested: $252,000 (down + closing). Projections, not guarantees.
Landlord ↔ Tenant lean methodology
- Overall (STATE)
- 28 Tenant-Leaning
- State Washington
- 28 Tenant-Leaning · D+8
- County
- — inherits STATE
- City
- — inherits STATE
ZIP-level market 98032
- Rents YoY
- -0.7%
- Active inventory
- 124
- Price-to-rent
- 39.4×
Monthly cashflow live
- Estimated rent
- $7,612 high interval (Pro) →
- Mortgage (P&I)
- −$4,720
- Tax from tax record
- −$656 /mo · $7,872/yr
- Insurance
- −$375
- HOA
- −$0
- Vacancy / Maint / Mgmt
- −$1,599
- Net cashflow
- $263
Break-even live
4-unit breakdown (identical units grouped — click to expand)
| Units | Beds | Baths | Est. rent |
|---|---|---|---|
| 4× units | 2 | 1 | $7,612 |
| #1 | 2 | 1 | $1,903 |
| #2 | 2 | 1 | $1,903 |
| #3 | 2 | 1 | $1,903 |
| #4 | 2 | 1 | $1,903 |
| Total (4 units) | $7,612 | ||
UW: 25.0% down · 7.5% · 30yr · 1.5% tax · 5.0% vac · 8.0% maint · 8.0% mgmt
Financing live
Cash to close
- Down payment
- $225,000
- Closing costs
- $27,000
- Reserves months
- —
- Total cash needed
- —
Loan-product check · same deal, 3 products live
Conventional
25% down · 7.5% · 30yr
- Down + closing
- —
- Monthly P&I
- —
- Monthly cashflow
- —
- DSCR
- —
- Eligible?
- —
Personal DTI + credit; lowest rate.
DSCR
20% down · 8.5% · 30yr
- Down + closing
- —
- Monthly P&I
- —
- Monthly cashflow
- —
- DSCR
- —
- Eligible?
- —
No personal income docs; deal must DSCR.
Hard money
10% down · 12.0% · 12mo
- Down + closing
- —
- Monthly P&I
- —
- Monthly cashflow
- —
- DSCR
- —
- Eligible?
- —
Short-term bridge; refi at stabilization.
Listing history 6 events
-
2026-06-18days on market $900,000 Active 113 DOM
-
2026-06-17days on market $900,000 Active 112 DOM
-
2026-06-16days on market $900,000 Active 111 DOM
-
2026-06-15days on market $900,000 Active 110 DOM
-
2026-06-13remarks 610-char remark
-
2026-06-13$900,000 Active 108 DOM
ⓘ Source: listings_history table (triggers on properties + properties_extension) + one-shot
backfill from property_details.listing_events for pre-trigger history.
Tax reassessment forecast WA · Resets to sale price
- Current annual tax
- $7,872 · $656/mo
- Projected year-2 tax
- $8,820 · $735/mo
- Expected delta
- +$948/yr (+$79/mo · 12.0%)
ⓘ Screening estimate from a state-policy table — verify with the county assessor before closing.
Climate risk First Street
- Flood 1/10 Low FEMA zone X (unshaded) · 0% chance over 30 yrs
- Wildfire 1/10 Low
- Heat 3/10 Moderate 6 d/yr ≥88°F today · 12 d/yr by 30 yrs out
- Wind 1/10 Low
- Air quality 7/10 Severe 9 unhealthy d/yr today · 10 by 30 yrs out
Nearby sold comps map
Loading sold comps map…
Walkable amenities ~0.75 mi
Loading nearby amenities…
Taxation est. · year 1
- Rental income
- $91,344
- − Mortgage interest
- −$50,414
- − Property taxes
- −$7,872
- − Insurance
- −$4,500
- − Repairs & maintenance
- −$7,308
- − Management
- −$7,308
- − Depreciation
- −$26,182
- Taxable loss
- −$12,239
- Est. tax savings @ 24.0%
- +$2,937
- After-tax cash flow
- $6,091/yr
For passive investors: Depreciation is non-cash, so a rental often shows a tax loss while cash-flowing — sheltering income. Rental losses are passive: they offset passive income freely, and up to $25,000/yr can offset ordinary (W-2) income if you actively participate and your MAGI is under $100k (phasing out to $0 by $150k); unused losses carry forward. On sale, claimed depreciation is recaptured at up to 25%, and gains may owe capital-gains tax (a 1031 exchange can defer both). Figures are a year-1 estimate at your 24.0% rate — not tax advice; consult a CPA.
Schools (NCES district)
- District
- Kent School District
- NCES district ID
- 5303960
- Math proficiency
- 47% ▼ -1.00%
- Reading proficiency
- 57% ▼ -1.00%
- Median HH income
- $69,823
- Composite
- 48.25/100
- National rank
- #4714
- State rank
- #109 of 291 in WA
Livability — Kent
- Score
- 79/100
- State rank
- #109
- US rank
- #2154
Category grades
Schools grade is shown separately in the Schools card above.
Census & demographics
- Census place
- Kent, WA
- County
- King County · 2,251,916 people
- City population
- 119,479
- Metro
- Seattle-Tacoma-Bellevue, WA
- Population (ZIP)
- 40,862
- Household income
- $82,636
- Rent vs Own
- Severe rent burden
- 2581.0
Population outlook (King County) Hauer SSP2
- Today (2025)
- 2,576,485 people
- By 2030
- 2,803,316 · +8.8%
- By 2040
- 3,255,921 · +26.4%
- By 2050
- 3,706,444 · +43.9%
- By 2075
- 4,746,063 · +84.2%
- By 2100
- 5,407,730 · +109.9%
Race, ethnicity, and origin ACS 2023
- Neighborhood character
- Highly diverse neighborhood (Simpson 0.79)
- Race & ethnicity
- White 32% Hispanic / Latino 24% Asian 17% Black 16% Two or more races 12% Pacific Islander 4%
- Hispanic origin (detail)
- Mexican 18%
- Common ancestry
- Portuguese 4% Italian 4% Lithuanian 2%
- Foreign-born
- 33% · Canada, Vietnam, China
- Languages at home
- 57% English-only · Spanish 19% Other Indo-European 6% Other Asian/Pacific 4%
Political lean MEDSL · King
- 2024 margin
- Solid D (+51.7) · D 74.2% · R 22.5% · Other 3.4%
- 2008→2024 swing
- +9.6pp toward D · 2008: 42.1pp · 2024: 51.7pp
- All cycles
- 2024: D+51.7 2020: D+52.7 2016: D+50.4 2012: D+39.9 2008: D+42.1
Not yet ingested
- Civics
- —
Market trends
- HPI YoY
- ▼ -527.12%
- Current HPI
- 299.2499
- Rent YoY
- ▼ -0.68%
- Metro
- Seattle-Tacoma-Bellevue, WA
- State GDP YoY
- ▲ 4.65%
- F500 in state
- 22
Industry mix (Fortune 500 HQ in WA)
| Industry | F500 HQs | Revenue |
|---|---|---|
| Retail | 2 | $269B |
|
||
| Technology / Retail | 1 | $638B |
|
||
| Technology | 1 | $245B |
|
||
| Telecommunications | 1 | $38B |
|
||
| Food / Beverage | 1 | $36B |
|
||
| Automotive / Trucks | 1 | $34B |
|
||
Price history
-53.7% since first listed9 events — show timeline
- 2026-06-12 Relisted — NWMLS as Distributed by MLS Grid
- 2026-06-12 Price Changed $900,000 NWMLS as Distributed by MLS Grid
- 2026-05-01 Delisted — NWMLS as Distributed by MLS Grid
- 2026-03-05 Price Changed $950,000 NWMLS as Distributed by MLS Grid
- 2026-01-14 Listed $1,000,000 NWMLS as Distributed by MLS Grid
- 2024-10-01 Sold (Public Records) $5,427,250 Public Records
- 2018-07-30 Sold (Public Records) $6,084,000 Public Records
- 2016-04-29 Sold (Public Records) $2,946,500 Public Records
- 2006-10-18 Sold (Public Records) $1,943,000 Public Records
Property tax history
+4.5%/yrLatest (2025): $7,872 · -10.2% YoY. Source: county tax records.
Cash-flow waterfall
monthlySold comps — $/sqft
last 12 mo · ≤1 miLoading sold comps…