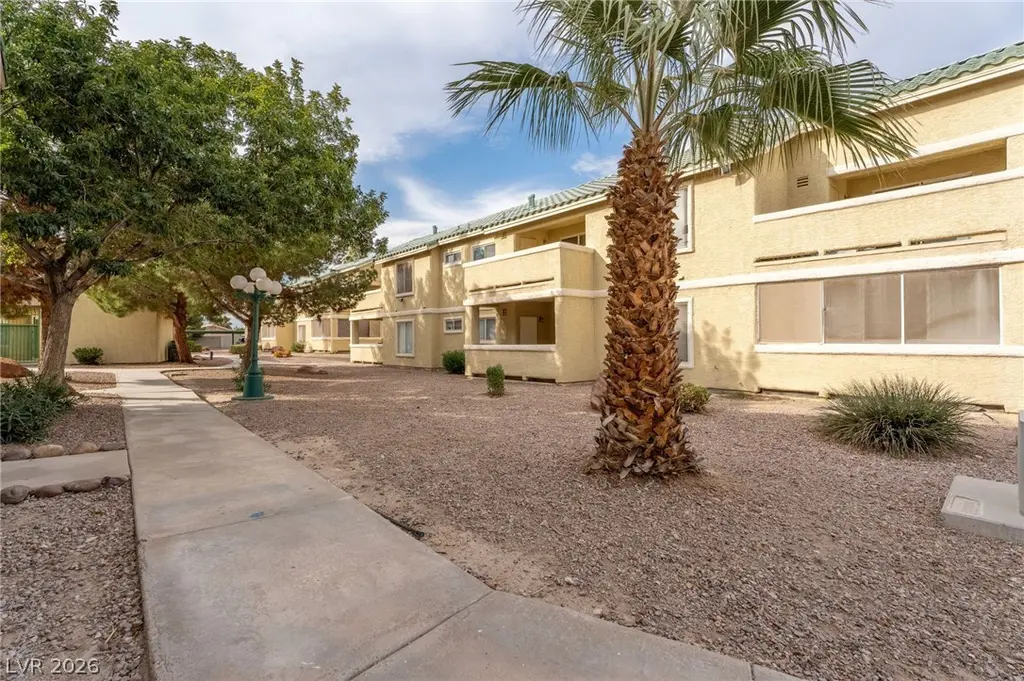
1401 Linnbaker Ln #202 · Las Vegas, NV
Flood risk 1/10 · Minimal
- FEMA flood zone
- X (unshaded)
- Chance of flooding over 30 yrs
- 0.0%
- Est. flood insurance / yr
- $507 – $1,088
Fire risk 1/10 · Minimal
- Est. fire insurance / yr
- $490 – $910
Heat risk 8/10 · Major
- Hot days now (above 108°F)
- 7 days/yr
- Hot days in 30 yrs
- 17 days/yr
Wind risk 1/10 · Minimal
- Chance of severe wind over 30 yrs
- —
Air-quality risk 4/10 · Minor
- Unhealthy air days now
- 4 days/yr
- Unhealthy air days in 30 yrs
- 5 days/yr
Risk factors via First Street. Map © Google.
Why this score? — see what drove the D grade
The composite is a weighted blend of 9 inputs, each scored 0–100. Each bar is that input's sub-score; the figure is the points it added to the 100-point composite (weight × sub-score).
- Cash flow +15.0/30.0
- ARV discount +7.5/15.0
- 1% rule +5.0/10.0
- DSCR +5.0/10.0
- Livability +4.0/5.0
- Rent growth +2.9/5.0
- Schools +2.6/10.0
- Condition / age +2.5/5.0
- Appreciation +0.0/10.0
$1,150
🖨 Deal sheet 📄 Offer letter ✓ Due diligence
Listing remarks MLS
This home is ready for move in. The spacious 2-bedroom, 2-bath home is located in a desirable gated community that offers peace of mind and added security. Residents can enjoy access to two sparkling community pools, creating a resort-style atmosphere year-round. With its strong rental appeal and excellent amenities, this home is an ideal choice for investors or future homeowners alike. Depending on terms owner is willing to carry
Key facts
- Community pool
- In unit laundry
- $290 HOA
Tags
Neighborhood map
What this means for you Summary
Snapshot
- This is a 2-bed/2.0-bath condo listed at $1k.
Deal economics
- At list price, monthly cash flow is $751 ($9k/yr) — positive.
- The deal already cash-flows at list — no discount required.
- Meets the 1% rule at list price ($1k rent vs $1k).
Location & tenants
- Location reads 80/100 on livability (#2 in NV, #1,723 nationally) — a professional / high-income tenant draw. Strengths: amenities A+, commute A+, housing A+; Watch: crime F.
- Clark County School District (urban): math 21% / reading 39% proficiency, ranked #11 of 17 in NV (top 65%) — families likely to look elsewhere, expect single-tenant / working-renter base with shorter leases.
- Market conditions: Rents rising (+1.8%/yr); 260 active listings in the ZIP; 40 comparable units currently listed for rent nearby; rentals at typical pace (median 22d on market — plan ~3-4 weeks tenant-placement turnaround); 14,754 units permitted in Clark County in 2024 (2,301 in 5+ unit buildings).
Forward outlook
- Local home prices are declining (-3.0%/yr); year-one equity from $8 of loan paydown is wiped out by about $34 of value loss. Plan a longer hold.
- Clark County population projected at +36% by 2050 — long-run rental-demand tailwind backs the buy-and-hold thesis.
- At projected returns (-3.0% appreciation + 1.8% rent growth), your $322 cash investment doubles in ~1 year — after that, you're playing with house money.
Negotiation context
- Only 6 days on market — expect competitive offers; lowballing is unlikely to land.
- 4 sale attempts since 17y ago; this cycle's ask has dropped $184k (99%) from the opening price — seller is motivated, your offer sets the floor, not the list.
Risks & watch-outs
- Watch-outs: HOA is 22% of rent.
- Climate carrying-cost: extreme-heat days projected 7→17/yr by 2055 (HVAC capex compounding) — expect insurance premiums to compound above CPI over the hold.
Questions for the listing agent
- What does the HOA fee cover, when was the last increase, and are there any pending special assessments or reserve-fund shortfalls?
- Any open or pending special assessments — roof, HVAC, plumbing, elevator, façade? What's the per-unit balance and payoff schedule, and is the seller paying it off at close or rolling it to the buyer?
- Is there a deadline driving the sale (1031 exchange, divorce, estate, relocation)? That informs how much negotiation room exists.
- Crime grade is F in this area — have there been break-ins, vandalism, or insurance claims at this property in the last 3 years? What carrier currently insures it and at what premium?
- The area grade is low — what's the realistic commute time and amenity access for the typical tenant pool here? Any planned neighborhood developments (good or bad) we should know about?
- What's the average days-on-market for RENTAL listings here right now (not sales)? A rising rental-DOM trend means longer vacancies and softer asking-rent achievability than the comps imply.
- What's the recent tenant-quality profile in this submarket — average credit score on applications, eviction rate, late-payment / NSF rate, and stable-employment percentage? A property-management company in the area should have these aggregated.
- How much new apartment / multifamily construction is in the pipeline within 1–3 miles? Heavy new supply (>2% of stock underway) typically softens rents 12–24 months out; light construction supports rent growth.
Investment metrics
- 1% rule
- 115.50% ✓
- Cap rate
- 790.36%
- Cash-on-cash
- 2800.23%
- DSCR
- 125.59
- GRM
- 0.1
CMA / ARV
No comps found within radius.
Projected returns pro-forma
-3.0% appreciation · 1.78% rent growth · sell at horizon
- IRR
- —
- Equity multiple
- 144.66×
- Total profit
- $46,258
- Equity at exit
- $171
- IRR
- —
- Equity multiple
- 299.94×
- Total profit
- $96,259
- Equity at exit
- $99
Cash invested: $322 (down + closing). Projections, not guarantees.
Landlord ↔ Tenant lean methodology
- Overall (STATE)
- 71 Landlord-Friendly
- State Nevada
- 71 Landlord-Friendly · R+1
- County
- — inherits STATE
- City
- — inherits STATE
ZIP-level market 89110
- Rents YoY
- 1.8%
- Active inventory
- 260
- Price-to-rent
- 0.1×
Monthly cashflow live
- Estimated rent
- $1,328 high interval (Pro) →
- Mortgage (P&I)
- −$6
- Tax est. 1.5%
- −$1 /mo · $17/yr
- Insurance
- −$0
- HOA
- −$290
- Vacancy / Maint / Mgmt
- −$279
- Net cashflow
- $751
Break-even live
UW: 25.0% down · 7.5% · 30yr · 1.5% tax · 5.0% vac · 8.0% maint · 8.0% mgmt
Financing live
Cash to close
- Down payment
- $288
- Closing costs
- $34
- Reserves months
- —
- Total cash needed
- —
Loan-product check · same deal, 3 products live
Conventional
25% down · 7.5% · 30yr
- Down + closing
- —
- Monthly P&I
- —
- Monthly cashflow
- —
- DSCR
- —
- Eligible?
- —
Personal DTI + credit; lowest rate.
DSCR
20% down · 8.5% · 30yr
- Down + closing
- —
- Monthly P&I
- —
- Monthly cashflow
- —
- DSCR
- —
- Eligible?
- —
No personal income docs; deal must DSCR.
Hard money
10% down · 12.0% · 12mo
- Down + closing
- —
- Monthly P&I
- —
- Monthly cashflow
- —
- DSCR
- —
- Eligible?
- —
Short-term bridge; refi at stabilization.
Rent comps 40 comps
| Address | Beds | Baths | Sqft | Rent | $/sqft | DOM | Units | Dist |
|---|---|---|---|---|---|---|---|---|
| 1440 Jamielinn Ln #102 Las Vegas, NV | 2.0 | 2.0 | 1047 | $1,150 | $1.10 | 4d | 1 | 0.07mi |
| 4302 Lynnann Dr Las Vegas, NV | 2.0 | 1.5 | 952 | $1,350 | $1.42 | 44d | 1 | 0.19mi |
| 4156 Abrams Ave Las Vegas, NV | 3.0 | 2.0 | 1005 | $1,700 | $1.69 | 44d | 1 | 0.19mi |
| 1492 N Lamb Blvd Las Vegas, NV | 1.0–2.0 | 1.0 | 739 | $1,529 | $2.07 | 2d | 9 | 0.20mi |
| 917 Bridgewater St Las Vegas, NV | 2.0 | 1.0 | 749 | $1,050 | $1.40 | 44d | 1 | 0.22mi |
| 1400 Henry Ave Unit D Las Vegas, NV | 2.0 | 1.0 | 898 | $915 | $1.02 | 44d | 1 | 0.25mi |
| 4105 Abrams Ave Las Vegas, NV | 3.0 | 2.5 | 1400 | $2,094 | $1.50 | 44d | 1 | 0.25mi |
| 3980 E Owens Ave Unit 206 Las Vegas, NV | 2.0 | 2.0 | 880 | $1,400 | $1.59 | 44d | 1 | 0.32mi |
| 3980 E Owens Ave Unit 122 Las Vegas, NV | 2.0 | 2.0 | 880 | $1,450 | $1.65 | 44d | 1 | 0.32mi |
| 1111 N Lamb Blvd #209 Las Vegas, NV | 3.0 | 2.0 | 1310 | $1,399 | $1.07 | 3d | 1 | 0.35mi |
| 1111 N Lamb Blvd #125 Las Vegas, NV | 2.0 | 2.0 | 1076 | $1,299 | $1.21 | 17d | 1 | 0.35mi |
| 3972 Danny Melamed Ave #102 Las Vegas, NV | 2.0 | 2.0 | 895 | $985 | $1.10 | 44d | 1 | 0.36mi |
| 1517 Frank Aved St #202 Las Vegas, NV | 2.0 | 2.0 | 895 | $1,025 | $1.15 | 15d | 1 | 0.36mi |
| 3961 Danny Melamed Ave #201 Las Vegas, NV | 2.0 | 2.0 | 895 | $999 | $1.12 | 44d | 1 | 0.38mi |
| 3956 Danny Melamed Ave #101 Las Vegas, NV | 2.0 | 2.0 | 895 | $1,050 | $1.17 | 2d | 1 | 0.41mi |
| 3956 Danny Melamed Ave #101 Las Vegas, NV | 2.0 | 2.0 | 895 | $1,050 | $1.17 | 8d | 1 | 0.41mi |
| 1700 N Lamb Blvd Las Vegas, NV | 2.0 | 2.0 | 989 | $1,475 | $1.49 | 8d | 2 | 0.41mi |
| 870 Flagstone Way Las Vegas, NV | 2.0 | 1.5 | 1102 | $1,450 | $1.32 | 24d | 1 | 0.43mi |
| 882 Ripple Way Las Vegas, NV | 2.0 | 1.5 | 1116 | $1,499 | $1.34 | 24d | 1 | 0.44mi |
| 894 Rhinegold Way Las Vegas, NV | 2.0 | 1.5 | 1116 | $1,340 | $1.20 | 44d | 1 | 0.50mi |
| 4160 E Tonopah Ave Unit 4160 Tonopah 115 Las Vegas, NV | 2.0 | 1.0 | 803 | $1,200 | $1.49 | 22d | 1 | 0.50mi |
| 4220 E Tonopah Ave Apt 204 Las Vegas, NV | 2.0 | 1.0 | 900 | $1,000 | $1.11 | 44d | 1 | 0.52mi |
| 4181 Terrestrial Dr Unit 120 Las Vegas, NV | 2.0 | 1.0 | 803 | $1,050 | $1.31 | 44d | 1 | 0.52mi |
| 4181 Terrestrial Ln Las Vegas, NV | 2.0 | 1.0 | 803 | $1,100 | $1.37 | 44d | 1 | 0.52mi |
| 1858 Dwarf Star Dr Unit 233 Las Vegas, NV | 2.0 | 1.0 | 800 | $1,200 | $1.50 | 24d | 1 | 0.59mi |
| 3630 E Owens Ave Las Vegas, NV | 2.0–3.0 | 1.0–2.0 | 924 | $900 | $0.97 | 2d | 28 | 0.70mi |
| 4162 Orbit Ave Unit 2055 Las Vegas, NV | 2.0 | 1.0 | 803 | $1,000 | $1.25 | 24d | 1 | 0.71mi |
| 628 Triest Ct Apt D Las Vegas, NV | 2.0 | 1.0 | 731 | $950 | $1.30 | 8d | 1 | 0.72mi |
| 1998 Dwarf Star Dr Unit 1041 Las Vegas, NV | 2.0 | 1.0 | 803 | $1,150 | $1.43 | 2d | 1 | 0.72mi |
| 1836 Luna Alegre St Las Vegas, NV | 3.0 | 2.5 | 1369 | $1,840 | $1.34 | 12d | 1 | 0.75mi |
| 4000 E Bonanza Rd Las Vegas, NV | 1.0–2.0 | 1.0–2.0 | 850 | $1,525 | $1.79 | 3d | 7 | 0.79mi |
| 3638 Via El Monte Ave Las Vegas, NV | 3.0 | 2.5 | 1195 | $1,850 | $1.55 | 44d | 1 | 0.85mi |
| 1888 Via del Rey Ct Las Vegas, NV | 3.0 | 2.5 | 1200 | $1,818 | $1.51 | 3d | 1 | 0.86mi |
| 824 Hedge Way #2 Las Vegas, NV | 3.0 | 2.0 | 1022 | $1,300 | $1.27 | 22d | 1 | 0.88mi |
| 4770 E Owens Ave Las Vegas, NV | 1.0–2.0 | 1.0–2.0 | 915 | $1,559 | $1.70 | 4d | 10 | 0.90mi |
| 1001 N Pecos Rd Las Vegas, NV | 1.0–3.0 | 1.0–2.0 | 875 | $1,188 | $1.36 | 3d | 7 | 0.92mi |
| 3700 E Bonanza Rd Las Vegas, NV | 1.0–2.0 | 1.0–2.0 | 850 | $1,260 | $1.48 | 2d | 8 | 0.94mi |
| 4521 E Bonanza Rd Las Vegas, NV | 1.0–2.0 | 1.0–2.0 | 897 | $1,827 | $2.04 | 2d | 14 | 0.95mi |
| 1830 N Pecos Rd Las Vegas, NV | 1.0–2.0 | 1.0–2.0 | 822 | $1,367 | $1.66 | 3d | 5 | 0.96mi |
| 3650 E Lake Mead Blvd Las Vegas, NV | 1.0–3.0 | 1.0–2.0 | 868 | $1,250 | $1.44 | 3d | 19 | 0.97mi |
HOA detail condo
- Monthly dues
- $290 · $3,480/yr
- Likely covers
- poolsecurity
- Assessments
- None detected in remarks — confirm with the listing agent.
Listing history 21 events
-
2026-06-18days on market $1,150 Active 6 DOM
-
2026-06-17days on market $1,150 Active 5 DOM
-
2026-06-16days on market $1,150 Active 4 DOM
-
2026-06-15days on market $1,150 Active 3 DOM
-
2026-06-13remarks 699-char remark
-
2026-06-13pricestatusdays on market $1,150 Active 1 DOM
-
2026-06-02status $184,900 Pending 81 DOM
-
2026-06-01days on market $184,900 Active 81 DOM
-
2026-05-31days on market $184,900 Active 80 DOM
-
2026-03-12$184,900 Active 434-char remark
Show marketing remark (434 chars)
This home is ready for move in. The spacious 2-bedroom, 2-bath home is located in a desirable gated community that offers peace of mind and added security. Residents can enjoy access to two sparkling community pools, creating a resort-style atmosphere year-round. With its strong rental appeal and excellent amenities, this home is an ideal choice for investors or future homeowners alike. Depending on terms owner is willing to carry
-
2026-01-15historical
-
2025-11-14$184,900 Active
-
2014-03-17historical
-
2014-03-17soldstatus $55,000
-
2014-03-02historical Contingent Offer
-
2014-02-21$60,000 Exclusive Right
-
2009-12-11soldstatus $29,050
-
2009-12-11historical
-
2009-10-16$23,900
-
2006-08-25soldstatus $156,000
-
1995-08-24soldstatus $68,500
ⓘ Source: listings_history table (triggers on properties + properties_extension) + one-shot
backfill from property_details.listing_events for pre-trigger history.
Climate risk First Street
- Flood 1/10 Low FEMA zone X (unshaded) · 0% chance over 30 yrs
- Wildfire 1/10 Low
- Heat 8/10 Severe 7 d/yr ≥108°F today · 17 d/yr by 30 yrs out
- Wind 1/10 Low
- Air quality 4/10 Moderate 4 unhealthy d/yr today · 5 by 30 yrs out
Nearby sold comps map
Loading sold comps map…
Walkable amenities ~0.75 mi
Loading nearby amenities…
Taxation est. · year 1
- Rental income
- $15,939
- − Mortgage interest
- −$64
- − Property taxes
- −$17
- − Insurance
- −$6
- − Repairs & maintenance
- −$1,275
- − Management
- −$1,275
- − HOA
- −$3,480
- − Depreciation
- −$33
- Taxable income
- $9,788
- Est. tax owed @ 24.0%
- −$2,349
- After-tax cash flow
- $6,668/yr
For passive investors: Depreciation is non-cash, so a rental often shows a tax loss while cash-flowing — sheltering income. Rental losses are passive: they offset passive income freely, and up to $25,000/yr can offset ordinary (W-2) income if you actively participate and your MAGI is under $100k (phasing out to $0 by $150k); unused losses carry forward. On sale, claimed depreciation is recaptured at up to 25%, and gains may owe capital-gains tax (a 1031 exchange can defer both). Figures are a year-1 estimate at your 24.0% rate — not tax advice; consult a CPA.
Schools (NCES district)
- District
- Clark County School District
- NCES district ID
- 3200060
- Math proficiency
- 21% ▼ -13.00%
- Reading proficiency
- 39% ▼ -8.00%
- Median HH income
- $53,611
- Composite
- 26.48/100
- National rank
- #7211
- State rank
- #11 of 17 in NV
Livability — Las Vegas
- Score
- 80/100
- State rank
- #2
- US rank
- #1723
Category grades
Schools grade is shown separately in the Schools card above.
Census & demographics
- Census place
- Las Vegas, NV
- County
- Clark County · 2,306,105 people
- City population
- 1,643,591
- Metro
- Las Vegas-Henderson-Paradise, NV
- Population (ZIP)
- 69,107
- Household income
- $61,001
- Rent vs Own
- Severe rent burden
- 3134.0
Population outlook (Clark County) Hauer SSP2
- Today (2025)
- 2,504,101 people
- By 2030
- 2,693,770 · +7.6%
- By 2040
- 3,061,208 · +22.2%
- By 2050
- 3,400,072 · +35.8%
- By 2075
- 4,139,522 · +65.3%
- By 2100
- 4,596,916 · +83.6%
Race, ethnicity, and origin ACS 2023
- Neighborhood character
- Diverse neighborhood (Simpson 0.55)
- Race & ethnicity
- Hispanic / Latino 63% White 20% Two or more races 18% Black 8% Asian 5% Native American 2%
- Hispanic origin (detail)
- Mexican 52% Cuban 3%
- Common ancestry
- Lithuanian 1% Italian 1% Romanian 1%
- Foreign-born
- 31% · Canada
- Languages at home
- 42% English-only · Spanish 53% Tagalog/Filipino 2% Other Asian/Pacific 1%
Political lean MEDSL · Clark
- 2024 margin
- Toss-up / Even · D 50.4% · R 47.8% · Other 1.7%
- 2008→2024 swing
- -16.5pp toward R · 2008: 19.1pp · 2024: 2.6pp
- All cycles
- 2024: D+2.6 2020: D+9.3 2016: D+10.7 2012: D+14.5 2008: D+19.1
Not yet ingested
- Civics
- —
Market trends
- HPI YoY
- ▼ -165.11%
- Current HPI
- 299.1815
- Rent YoY
- ▲ 1.78%
- Metro
- Las Vegas-Henderson-Paradise, NV
- State GDP YoY
- ▲ 3.08%
- F500 in state
- 6
Industry mix (Fortune 500 HQ in NV)
| Industry | F500 HQs | Revenue |
|---|---|---|
| Hotels / Casinos | 3 | $36B |
|
||
Price history
+169.9% since first listed12 events — show timeline
- 2026-03-12 Listed $184,900 GLVAR
- 2026-01-15 Listing Removed — GLVAR
- 2025-11-14 Listed $184,900 GLVAR
- 2014-03-17 Listing Removed — GLVAR
- 2014-03-17 Sold (Public Records) $55,000 Public Records
- 2014-03-02 Contingent — GLVAR
- 2014-02-21 Listed $60,000 GLVAR
- 2009-12-11 Listing Removed — GLVAR
- 2009-12-11 Sold (MLS) $29,050 GLVAR
- 2009-10-16 Listed $23,900 GLVAR
- 2006-08-25 Sold (Public Records) $156,000 Public Records
- 1995-08-24 Sold (Public Records) $68,500 Public Records
Property tax history
-1.6%/yrLatest (2025): $611 · +7.5% YoY. Source: county tax records.
Cash-flow waterfall
monthlySold comps — $/sqft
last 12 mo · ≤1 miLoading sold comps…