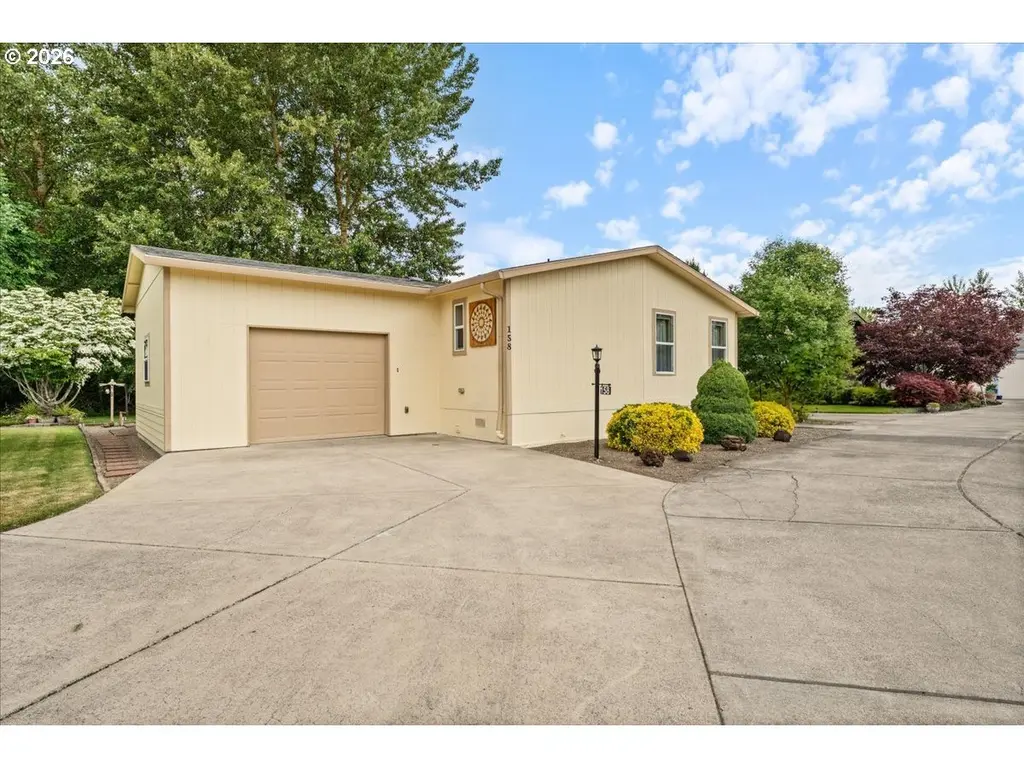
5101 NE 121st Ave #158 · Vancouver, WA
Flood risk No data
- FEMA flood zone
- —
- Chance of flooding over 30 yrs
- —
- Est. flood insurance / yr
- —
Fire risk No data
- Est. fire insurance / yr
- —
Heat risk No data
- Hot days now (above threshold)
- —
- Hot days in 30 yrs
- —
Wind risk No data
- Chance of severe wind over 30 yrs
- —
Air-quality risk No data
- Unhealthy air days now
- —
- Unhealthy air days in 30 yrs
- —
Risk factors via First Street. Map © Google.
Why this score? — see what drove the D+ grade
The composite is a weighted blend of 9 inputs, each scored 0–100. Each bar is that input's sub-score; the figure is the points it added to the 100-point composite (weight × sub-score).
- Cash flow +17.7/30.0
- ARV discount +7.5/15.0
- DSCR +5.5/10.0
- Schools +4.3/10.0
- Livability +4.1/5.0
- 1% rule +3.9/10.0
- Rent growth +2.7/5.0
- Condition / age +2.5/5.0
- Appreciation +0.0/10.0
$255,000
🖨 Deal sheet 📄 Offer letter ✓ Due diligence
Listing remarks MLS
Fantastic 3BR,2BTH,1512 S.F. 2009 Golden West Mfg. Home Facing Green Belt Preserve--Most Desirable Location in Creekside Estates-Maybe Clark Counties Finest Park and the Only One with a Year around Pool-This Home Has a Large Open Island Kitchen/Dining Room/Family Room Combination-Access to Deck and Patio Area Facing Green Belt-Master Suite & WI Closet-Heat Pump-Scissor Vault Thruout-Rec Center and Gated RV Parking--Minimal Fee
Key facts
- Green space
- Private back deck
- Community clubhouse
Tags
Property features AI
Finance
- Financial info: Land lease present; lease expiration April 27, 2027; Monthly lot rent $950
- HOA & community: Community amenities include commons, lap pool, library, grounds maintenance, management, meeting room, party room, road maintenance, and spa/hot tub; Park name: Creekside Estates; Pets allowed with restrictions; Home must be park approved; Land lease in place (monthly lot rent)
Exterior
- Parking: Driveway; Attached 1-car garage
- Utilities: Public water; Public sewer; Electric service; Internet: Cable and DSL
- Home design: Manufactured home in park (Golden Oak model 27x56); Single-story layout; Park/greenbelt and trees/woods views; Entry/main level living
- Construction: Built in 2009; Skirting foundation; Composition roof
- Exterior features: Deck; Fenced yard; Yard; Cement siding
Interior
- Kitchen: Island; Pantry; Free-standing range; Range hood; Dishwasher; Disposal; Free-standing refrigerator; Water purifier
- Bedrooms: Primary bedroom on main level with ensuite and walk-in closet; Second bedroom on main level; Third bedroom on main level
- Flooring: Laminate flooring; Vinyl flooring; Wall-to-wall carpet
- Bathrooms: Two full bathrooms (both on main level)
- Heating & cooling: Heat pump for heating and cooling
- Interior features: Main-floor bedroom with bath and walk-in shower (accessible); Vaulted ceilings in multiple rooms; Ceiling fans in primary and other bedrooms; Laundry area with washer/dryer included; Solar tube lighting; Water purifier; Double-pane windows with vinyl frames; Laminate, vinyl and wall-to-wall carpet flooring; Crawl space basement
- Laundry & utility: Washer and dryer included; Laundry on main level; Electric hot water
Neighborhood map
What this means for you Summary
Snapshot
- This is a 3-bed/2.0-bath manufactured listed at $255k.
Deal economics
- At list price, monthly cash flow is $206 ($2k/yr) — positive.
- The deal already cash-flows at list — no discount required.
- To meet the 1% rule (rent ≥ 1% of price), the offer needs to be $228k (10.6% below list).
- Recommended offer: $228k (10.6% below list) — sets the bar for 1% rule.
- Cap rate 7.3% vs local median 2.7% in Vancouver — top-decile yield for the area; either an underpriced asset or a hidden risk that comps aren't pricing in. Stress-test before assuming the spread holds.
Location & tenants
- Location reads 82/100 on livability (#62 in WA, #1,133 nationally) — a professional / high-income tenant draw. Strengths: amenities A+, commute A+, housing A+; Watch: crime F, cost of living D-.
- Evergreen School District (Clark) (urban): math 41% / reading 51% proficiency, ranked #164 of 291 in WA (top 56%) — families likely to look elsewhere, expect single-tenant / working-renter base with shorter leases.
- Zoned schools: Image Elementary School (462 students, 67% FRL); Covington Middle School (868 students, 73% FRL); Heritage High School (1,625 students, 68% FRL) — zoned schools average 69% FRL vs 39% district-wide (31 pts higher); higher-poverty schools than district average — tighter screening recommended.
- Market conditions: Rents flat; 461 active listings in the ZIP; 35 comparable units currently listed for rent nearby; rentals at typical pace (median 24d on market — plan ~3-4 weeks tenant-placement turnaround); 46% of comp listings sitting > 30 days — soft ceiling on asking rent; solid renter incomes; 3,547 units permitted in Clark County in 2024 (1,361 in 5+ unit buildings).
Forward outlook
- Local home prices are declining (-3.0%/yr); year-one equity from $2k of loan paydown is wiped out by about $8k of value loss. Plan a longer hold.
- Clark County population projected at +29% by 2050 — long-run rental-demand tailwind backs the buy-and-hold thesis.
Negotiation context
- Only 13 days on market — expect competitive offers; lowballing is unlikely to land.
- 3 sale attempts since 9y ago with the ask held roughly flat each time — persistent listings suggest the price (not the market) is what's stuck; bring a comps-based counter.
- Current owner paid $180k; 42% above their basis — modest negotiation headroom, anchor on the comps not their cost.
Questions for the listing agent
- Is there a deadline driving the sale (1031 exchange, divorce, estate, relocation)? That informs how much negotiation room exists.
- Crime grade is F in this area — have there been break-ins, vandalism, or insurance claims at this property in the last 3 years? What carrier currently insures it and at what premium?
- The area grade is low — what's the realistic commute time and amenity access for the typical tenant pool here? Any planned neighborhood developments (good or bad) we should know about?
- What's the average days-on-market for RENTAL listings here right now (not sales)? A rising rental-DOM trend means longer vacancies and softer asking-rent achievability than the comps imply.
- What's the recent tenant-quality profile in this submarket — average credit score on applications, eviction rate, late-payment / NSF rate, and stable-employment percentage? A property-management company in the area should have these aggregated.
- How much new for-sale + rental construction is in the pipeline within 1–3 miles? Heavy new supply typically softens prices + rents 12–24 months out; constrained supply supports both.
Investment metrics
- 1% rule
- 0.89% ✗
- Cap rate
- 7.26%
- Cash-on-cash
- 3.46%
- DSCR
- 1.15
- GRM
- 9.3
CMA / ARV
- ARV (on-the-fly)
- $164,808
- Comps found
- 12
Show comp detail 12 sales within ~0.75 mi
| Address | Dist | Beds/Ba | Sqft | Sold | Price | $/sf | Match |
|---|---|---|---|---|---|---|---|
| 5101 NE 121st Ave #12 | 0.15mi | 3/2.0 | 1,501 (-1%) | 1mo | $146,000 | $97 | 91 |
| 5101 NE 121st Ave #1 | 0.15mi | 3/2.0 | 1,512 (0%) | 4mo | $230,000 | $152 | 90 |
| 5101 NE 121st Ave #154 | 0.02mi | 2/2.0 (-1) | 1,566 (+4%) | 1mo | $170,000 | $109 | 87 |
| 5101 NE 121st Ave #118 | 0.15mi | 3/2.0 | 1,432 (-5%) | 2mo | $220,000 | $154 | 83 |
| 5101 NE 121st Ave | 0.15mi | 3/2.0 | 1,617 (+7%) | 2mo | $185,000 | $114 | 80 |
| 5404 NE 121st Ave #73 | 0.35mi | 3/2.0 | 1,536 (+2%) | 1mo | $75,000 | $49 | 80 |
| 5101 NE 121st Ave #9 | 0.15mi | 3/2.0 | 1,635 (+8%) | 2mo | $223,000 | $136 | 78 |
| 5101 NE 121st Ave #51 | 0.15mi | 3/2.0 | 1,350 (-11%) | 0mo | $100,000 | $74 | 75 |
| 5404 NE 121st Ave #69 | 0.35mi | 3/2.0 | 1,436 (-5%) | 2mo | $75,000 | $52 | 74 |
| 5404 NE 121st Ave #44 | 0.35mi | 2/2.0 (-1) | 1,431 (-5%) | 4mo | $140,000 | $98 | 66 |
| 5101 NE 121st Ave #21 | 0.15mi | 3/2.0 | 1,289 (-15%) | 4mo | $145,000 | $112 | 66 |
| 13217 NE 59th St #126 | 0.44mi | 2/2.0 (-1) | 1,568 (+4%) | 4mo | $140,000 | $89 | 65 |
Match score weights: distance 35% · size 25% · config 20% · recency 20%. Top-matched comps best support the ARV.
Projected returns pro-forma
-3.0% appreciation · 0.63% rent growth · sell at horizon
- IRR
- -13.4%
- Equity multiple
- 0.53×
- Total profit
- $-33,577
- Equity at exit
- $38,021
- IRR
- -8.3%
- Equity multiple
- 0.53×
- Total profit
- $-33,404
- Equity at exit
- $22,048
Cash invested: $71,400 (down + closing). Projections, not guarantees.
Landlord ↔ Tenant lean methodology
- Overall (STATE)
- 28 Tenant-Leaning
- State Washington
- 28 Tenant-Leaning · D+8
- County
- — inherits STATE
- City
- — inherits STATE
ZIP-level market 98682
- Rents YoY
- 0.6%
- Active inventory
- 461
- Price-to-rent
- 9.3×
Monthly cashflow live
- Estimated rent
- $2,281 high interval (Pro) →
- Mortgage (P&I)
- −$1,337
- Tax from tax record
- −$152 /mo · $1,827/yr
- Insurance
- −$106
- HOA
- −$0
- Vacancy / Maint / Mgmt
- −$479
- Net cashflow
- $206
Break-even live
UW: 25.0% down · 7.5% · 30yr · 1.5% tax · 5.0% vac · 8.0% maint · 8.0% mgmt
Financing live
Cash to close
- Down payment
- $63,750
- Closing costs
- $7,650
- Reserves months
- —
- Total cash needed
- —
Loan-product check · same deal, 3 products live
Conventional
25% down · 7.5% · 30yr
- Down + closing
- —
- Monthly P&I
- —
- Monthly cashflow
- —
- DSCR
- —
- Eligible?
- —
Personal DTI + credit; lowest rate.
DSCR
20% down · 8.5% · 30yr
- Down + closing
- —
- Monthly P&I
- —
- Monthly cashflow
- —
- DSCR
- —
- Eligible?
- —
No personal income docs; deal must DSCR.
Hard money
10% down · 12.0% · 12mo
- Down + closing
- —
- Monthly P&I
- —
- Monthly cashflow
- —
- DSCR
- —
- Eligible?
- —
Short-term bridge; refi at stabilization.
Rent comps 35 comps
| Address | Beds | Baths | Sqft | Rent | $/sqft | DOM | Units | Dist |
|---|---|---|---|---|---|---|---|---|
| 12600 NE 49th St Unit F16 Vancouver, WA | 2.0 | 2.0 | 1170 | $1,695 | $1.45 | 23d | 1 | 0.24mi |
| 4825 NE 124th Ct Vancouver, WA | 3.0 | 2.5 | 1586 | $2,295 | $1.45 | 43d | 1 | 0.28mi |
| 11716 NE 49th St Vancouver, WA | 1.0–3.0 | 1.0–2.5 | 1090 | $2,250 | $2.06 | 7d | 15 | 0.42mi |
| 5719 NE 135th Ave Vancouver, WA | 3.0 | 2.0 | 1260 | $1,995 | $1.58 | 43d | 1 | 0.54mi |
| 11328 NE 51st Cir Vancouver, WA | 2.0–4.0 | 1.0–2.0 | 1086 | $1,862 | $1.71 | 7d | 8 | 0.58mi |
| 11205 NE 49th St Unit 11209B Vancouver, WA | 2.0 | 1.0 | 1104 | $1,675 | $1.52 | 12d | 1 | 0.69mi |
| 13806 NE 47th St Vancouver, WA | 3.0 | 2.0 | 1185 | $2,779 | $2.35 | 19d | 1 | 0.72mi |
| 4303 NE 136th Ave Vancouver, WA | 3.0 | 2.5 | 1736 | $2,500 | $1.44 | 43d | 1 | 0.76mi |
| 13815 NE 63rd St Vancouver, WA | 3.0 | 2.5 | 1601 | $2,395 | $1.50 | 23d | 1 | 0.84mi |
| 11603 NE 71st St Vancouver, WA | 1.0–3.0 | 1.0–2.0 | 991 | $2,563 | $2.59 | 1d | 55 | 0.95mi |
| 6509 NE 139th Ct Vancouver, WA | 3.0 | 2.0 | 1525 | $2,529 | $1.66 | 43d | 1 | 0.97mi |
| 4202 NE Morrow Rd #201 Vancouver, WA | 3.0 | 2.0 | 1155 | $2,345 | $2.03 | 43d | 1 | 1.02mi |
| 4202 NE Morrow Rd Vancouver, WA | 3.0 | 2.0 | 1155 | $2,395 | $2.07 | 43d | 1 | 1.02mi |
| 6715 NE 139th Pl Vancouver, WA | 3.0 | 2.5 | 1423 | $2,400 | $1.69 | 4d | 1 | 1.02mi |
| 6719 NE 139th Pl Vancouver, WA | 3.0 | 2.5 | 1492 | $2,570 | $1.72 | 43d | 1 | 1.02mi |
| 12317 NE 33rd St Vancouver, WA | 4.0 | 3.0 | 1700 | $2,739 | $1.61 | 43d | 1 | 1.05mi |
| 6117 NE 105th Ave Vancouver, WA | 3.0 | 2.5 | 1521 | $2,249 | $1.48 | 21d | 1 | 1.10mi |
| 11703 NE 32nd St Vancouver, WA | 2.0 | 2.0 | 1158 | $2,095 | $1.81 | 43d | 1 | 1.15mi |
| 6001 NE 102nd Ave Vancouver, WA | 2.0–3.0 | 2.0 | 1125 | $1,850 | $1.64 | 1d | 6 | 1.15mi |
| 3109 NE 118th Ave Vancouver, WA | 3.0 | 2.5 | 1833 | $2,595 | $1.42 | 43d | 1 | 1.16mi |
| 3605 NE 141st Ave Vancouver, WA | 3.0 | 2.0 | 1126 | $2,500 | $2.22 | 2d | 1 | 1.16mi |
| 10300 NE 61st Cir Unit 10404 Vancouver, WA | 3.0 | 2.5 | 1653 | $2,495 | $1.51 | 7d | 1 | 1.17mi |
| 10300 NE 61st Cir Unit 10315 Vancouver, WA | 3.0 | 2.5 | 1486 | $2,495 | $1.68 | 23d | 1 | 1.17mi |
| 3708 NE 109th Ave Vancouver, WA | 1.0–3.0 | 1.0–2.0 | 899 | $2,156 | $2.40 | 2d | 30 | 1.20mi |
| 7415 NE 136th Ave Vancouver, WA | 3.0 | 2.5 | 1674 | $2,495 | $1.49 | 44d | 1 | 1.25mi |
| 2641 NE 130th Ct Vancouver, WA | 3.0 | 2.5 | 1624 | $2,595 | $1.60 | 4d | 1 | 1.34mi |
| 12607 NE 27th Way Vancouver, WA | 3.0 | 2.5 | 2023 | $2,695 | $1.33 | 2d | 1 | 1.35mi |
| 7815 NE 117th Ave Unit 7815-2 Vancouver, WA | 3.0 | 1.5 | 1200 | $1,845 | $1.54 | 43d | 1 | 1.35mi |
| 2630 NE 131st Ct Vancouver, WA | 3.0 | 2.5 | 1768 | $2,695 | $1.52 | 7d | 1 | 1.36mi |
| 2617 NE 131st Ct Vancouver, WA | 4.0 | 3.0 | 1820 | $2,495 | $1.37 | 23d | 1 | 1.39mi |
| 12509 NE 26th St Vancouver, WA | 3.0 | 2.5 | 1688 | $2,495 | $1.48 | 43d | 1 | 1.39mi |
| 2642 NE 116th Pl Vancouver, WA | 3.0 | 2.0 | 1434 | $2,350 | $1.64 | 16d | 1 | 1.40mi |
| 13024 NE 26th St Vancouver, WA | 3.0 | 2.5 | 1559 | $2,295 | $1.47 | 43d | 1 | 1.40mi |
| 2264 NE 116th Pl Vancouver, WA | 4.0 | 2.5 | 1480 | $2,700 | $1.82 | 43d | 1 | 1.45mi |
| 2601 NE 115th Pl Vancouver, WA | 3.0 | 2.5 | 1435 | $2,800 | $1.95 | 43d | 1 | 1.45mi |
Listing history 10 events
-
2026-06-18days on market $255,000 Active 13 DOM
-
2026-06-17days on market $255,000 Active 12 DOM
-
2026-06-16days on market $255,000 Active 11 DOM
-
2026-06-15days on market $255,000 Active 10 DOM
-
2026-06-13days on market $255,000 Active 8 DOM
-
2026-06-13days on market $255,000 Active 7 DOM
-
2026-06-09days on market $255,000 Active 4 DOM
-
2026-06-08days on market $255,000 Active 3 DOM
-
2026-06-07remarks 693-char remark
-
2026-06-07$255,000 Active 2 DOM
ⓘ Source: listings_history table (triggers on properties + properties_extension) + one-shot
backfill from property_details.listing_events for pre-trigger history.
Tax reassessment forecast WA · Resets to sale price
- Current annual tax
- $1,827 · $152/mo
- Projected year-2 tax
- $2,499 · $208/mo
- Expected delta
- +$672/yr (+$56/mo · 36.8%)
ⓘ Screening estimate from a state-policy table — verify with the county assessor before closing.
Nearby sold comps map
Loading sold comps map…
Walkable amenities ~0.75 mi
Loading nearby amenities…
Taxation est. · year 1
- Rental income
- $27,370
- − Mortgage interest
- −$14,284
- − Property taxes
- −$1,827
- − Insurance
- −$1,275
- − Repairs & maintenance
- −$2,190
- − Management
- −$2,190
- − Depreciation
- −$7,418
- Taxable loss
- −$1,814
- Est. tax savings @ 24.0%
- +$435
- After-tax cash flow
- $2,908/yr
For passive investors: Depreciation is non-cash, so a rental often shows a tax loss while cash-flowing — sheltering income. Rental losses are passive: they offset passive income freely, and up to $25,000/yr can offset ordinary (W-2) income if you actively participate and your MAGI is under $100k (phasing out to $0 by $150k); unused losses carry forward. On sale, claimed depreciation is recaptured at up to 25%, and gains may owe capital-gains tax (a 1031 exchange can defer both). Figures are a year-1 estimate at your 24.0% rate — not tax advice; consult a CPA.
Schools (NCES district)
- District
- Evergreen School District (Clark)
- NCES district ID
- 5302700
- Math proficiency
- 41% ▼ -3.00%
- Reading proficiency
- 51% ▼ -3.00%
- Median HH income
- $59,418
- Composite
- 42.53/100
- National rank
- #6859
- State rank
- #164 of 291 in WA
Livability — Vancouver
- Score
- 82/100
- State rank
- #62
- US rank
- #1133
Category grades
Schools grade is shown separately in the Schools card above.
Census & demographics
- Census place
- Vancouver, WA
- County
- Clark County · 513,189 people
- City population
- 360,195
- Metro
- Portland-Vancouver-Hillsboro, OR-WA
- Population (ZIP)
- 68,305
- Household income
- $99,918
- Rent vs Own
- Severe rent burden
- 1618.0
Population outlook (Clark County) Hauer SSP2
- Today (2025)
- 529,610 people
- By 2030
- 563,242 · +6.4%
- By 2040
- 625,905 · +18.2%
- By 2050
- 681,558 · +28.7%
- By 2075
- 805,967 · +52.2%
- By 2100
- 877,450 · +65.7%
Race, ethnicity, and origin ACS 2023
- Neighborhood character
- Predominantly White (69%)
- Race & ethnicity
- White 69% Hispanic / Latino 15% Two or more races 13% Asian 6% Black 2% Pacific Islander 1%
- Hispanic origin (detail)
- Mexican 12%
- Common ancestry
- Portuguese 3% Subsaharan African 3% Scotch-Irish 2%
- Foreign-born
- 13% · Canada, Vietnam, South Korea
- Languages at home
- 79% English-only · Spanish 8% Russian/Polish/Slavic 6% Other Asian/Pacific 2%
Political lean MEDSL · Clark
- 2024 margin
- Lean D (+7.0) · D 52.1% · R 45.1% · Other 2.8%
- 2008→2024 swing
- +0.9pp no change · 2008: 6.1pp · 2024: 7.0pp
- All cycles
- 2024: D+7.0 2020: D+5.1 2016: D+0.1 2012: D+0.1 2008: D+6.1
Not yet ingested
- Civics
- —
Market trends
- HPI YoY
- ▼ -303.95%
- Current HPI
- 307.0529
- Rent YoY
- ▲ 0.63%
- Metro
- Portland-Vancouver-Hillsboro, OR-WA
- State GDP YoY
- ▲ 4.65%
- F500 in state
- 22
Industry mix (Fortune 500 HQ in WA)
| Industry | F500 HQs | Revenue |
|---|---|---|
| Retail | 2 | $269B |
|
||
| Technology / Retail | 1 | $638B |
|
||
| Technology | 1 | $245B |
|
||
| Telecommunications | 1 | $38B |
|
||
| Food / Beverage | 1 | $36B |
|
||
| Automotive / Trucks | 1 | $34B |
|
||
Price history
+52.7% since first listed7 events — show timeline
- 2026-06-05 Listed $255,000 RMLS
- 2018-04-27 Sold (MLS) $179,900 RMLS
- 2018-04-20 Pending — RMLS
- 2018-04-11 Listed $179,900 RMLS
- 2017-04-21 Sold (MLS) $170,000 RMLS
- 2017-03-23 Pending — RMLS
- 2017-03-21 Listed $167,000 RMLS
Property tax history
+10.7%/yrLatest (2026): $1,827 · +71.2% YoY. Source: county tax records.
Cash-flow waterfall
monthlySold comps — $/sqft
last 12 mo · ≤1 miLoading sold comps…