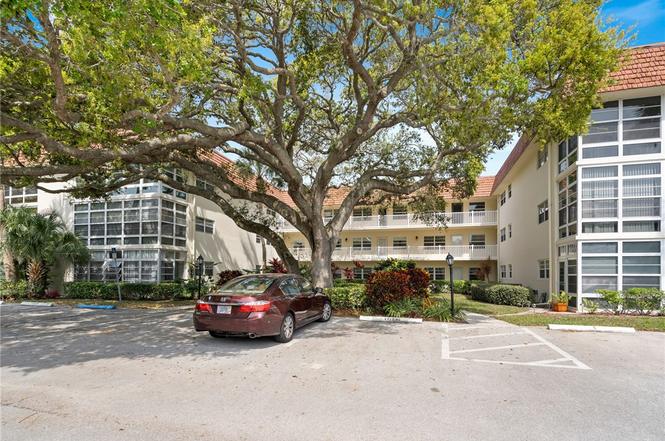
5400 Highway A1a Unit C21 · Indian River Shores, FL
Flood risk 6/10 · Moderate
- FEMA flood zone
- X (unshaded)
- Chance of flooding over 30 yrs
- 0.59%
- Est. flood insurance / yr
- $507 – $1,088
Fire risk 1/10 · Minimal
- Est. fire insurance / yr
- $947 – $1,759
Heat risk 10/10 · Severe
- Hot days now (above 105°F)
- 7 days/yr
- Hot days in 30 yrs
- 25 days/yr
Wind risk 10/10 · Severe
- Chance of severe wind over 30 yrs
- 99.0%
Air-quality risk 1/10 · Minimal
- Unhealthy air days now
- 0 days/yr
- Unhealthy air days in 30 yrs
- 0 days/yr
Risk factors via First Street. Map © Google.
Why this score? — see what drove the B+ grade
The composite is a weighted blend of 9 inputs, each scored 0–100. Each bar is that input's sub-score; the figure is the points it added to the 100-point composite (weight × sub-score).
- Cash flow +26.5/30.0
- ARV discount +15.0/15.0
- 1% rule +9.9/10.0
- DSCR +9.0/10.0
- Rent growth +5.0/5.0
- Schools +4.2/10.0
- Livability +3.4/5.0
- Condition / age +2.5/5.0
- Appreciation +0.0/10.0
$259,000
🖨 Deal sheet 📄 Offer letter ✓ Due diligence
Listing remarks
Turnkey, Ocean Front Community, East of A1A, quiet corner location, 55+ active community living w/ clubhouse and heated pool. Large sunny patio featuring impact windows. Your new breezy, beachy, home awaits! Rmsizesapprox/subj2err.
Key facts
- Clubhouse
- East of a1a
- Heated pool
Tags
Property features AI
Finance
- Other: Has view
- Financial info: Pets not allowed
- HOA & community: Del Mar Association with monthly fee ($571); Association fees cover common areas, cable TV, insurance, structure maintenance, reserve fund, sewer, trash and water; Dues paid quarterly; On-site property manager; Community amenities include pool and shuffleboard, library; Senior community
Exterior
- Parking: Assigned uncovered parking
- Security: Smoke detectors
- Utilities: Public water; County sewer
- Home design: 3-story building; North-facing; Attached property
- Construction: Block, concrete and stucco construction
- Exterior features: Enclosed porch; Porch; Beach access; Community pool (heated, electric heat)
Interior
- Kitchen: Dishwasher; Microwave; Range; Refrigerator; Electric water heater
- Bedrooms: Bedroom (13 x 10); Bedroom (13 x 12)
- Flooring: Carpet; Laminate
- Bathrooms: 2 full bathrooms
- Heating & cooling: Central heating (electric); Central air conditioning (electric)
- Interior features: Window treatments; Furnished
- Laundry & utility: Common area laundry
Neighborhood map
What this means for you Summary
Snapshot
- This is a 2-bed/2.0-bath townhouse listed at $259k.
Deal economics
- At list price, monthly cash flow is $683 ($8k/yr) — positive.
- The deal already cash-flows at list — no discount required.
- Meets the 1% rule at list price ($4k rent vs $259k).
- Recommended offer: $228k (12.0% below list) — sets the bar for market timing.
- Cap rate 9.5% vs local median 1.5% in Indian River Shores — top-decile yield for the area; either an underpriced asset or a hidden risk that comps aren't pricing in. Stress-test before assuming the spread holds.
Location & tenants
- Location reads 68/100 on livability (#517 in FL) — a middle-class / working-renter tenant base. Strengths: crime A+, employment A+, housing A-; Watch: schools C-, amenities F, commute F.
- Indian River (other): math 48% / reading 52% proficiency, ranked #35 of 73 in FL (top 48%) — acceptable for families but not a draw, mixed tenant base, ~2y average lease.
- Market conditions: Rents rising fast (+11.0%/yr); 498 active listings in the ZIP; 26 comparable units currently listed for rent nearby; rentals at typical pace (median 21d on market — plan ~3-4 weeks tenant-placement turnaround); high-income renter base; 564 units permitted in Indian River County in 2024 (281 in 5+ unit buildings).
- This rent runs 31% of the median local income ($150k/yr) — at the standard rent-burdened threshold; future hikes will face affordability resistance.
Forward outlook
- Local home prices are declining (-3.0%/yr); year-one equity from $2k of loan paydown is wiped out by about $8k of value loss. Plan a longer hold.
- Indian River County population projected at +18% by 2050 — long-run rental-demand tailwind backs the buy-and-hold thesis.
- At projected returns (-3.0% appreciation + 8.0% rent growth), your $73k cash investment doubles in ~7 years — after that, you're playing with house money.
Negotiation context
- It's been on market 124 days — a 12% lower offer ($228k) is reasonable based on typical stale-listing flexibility.
- 4 sale attempts since 2y ago with the ask held roughly flat each time — persistent listings suggest the price (not the market) is what's stuck; bring a comps-based counter.
Risks & watch-outs
- Climate carrying-cost: major flood risk; severe wind risk, 99% chance of damaging wind over 30y; extreme-heat days projected 7→25/yr by 2055 (HVAC capex compounding) — expect insurance premiums to compound above CPI over the hold.
Questions for the listing agent
- It's been on market 124 days. Have you received any prior offers? Is the seller open to a 12% concession, seller financing, or rate buy-down credit?
- Built in 1972 — when were the roof, HVAC, electrical panel, plumbing, and water heater last replaced?
- What does the HOA fee cover, when was the last increase, and are there any pending special assessments or reserve-fund shortfalls?
- Why hasn't it sold? Are there any deal-killer items the seller is aware of (foundation, flood, title, zoning, code violations)?
- Is there a deadline driving the sale (1031 exchange, divorce, estate, relocation)? That informs how much negotiation room exists.
- What's the average days-on-market for RENTAL listings here right now (not sales)? A rising rental-DOM trend means longer vacancies and softer asking-rent achievability than the comps imply.
- What's the recent tenant-quality profile in this submarket — average credit score on applications, eviction rate, late-payment / NSF rate, and stable-employment percentage? A property-management company in the area should have these aggregated.
- How much new for-sale + rental construction is in the pipeline within 1–3 miles? Heavy new supply typically softens prices + rents 12–24 months out; constrained supply supports both.
Investment metrics
- 1% rule
- 1.49% ✓
- Cap rate
- 9.46%
- Cash-on-cash
- 11.30%
- DSCR
- 1.50
- GRM
- 5.6
CMA / ARV
- ARV (on-the-fly)
- $318,000
- Comps found
- 12
Show comp detail 12 sales within ~0.75 mi
| Address | Dist | Beds/Ba | Sqft | Sold | Price | $/sf | Match |
|---|---|---|---|---|---|---|---|
| 5400 Highway A1a Unit D31 | 0.12mi | 2/2.0 | 1,200 (0%) | 2mo | $290,000 | $242 | 93 |
| 5400 Highway A1a Unit H24 | 0.12mi | 2/2.0 | 1,200 (0%) | 3mo | $275,000 | $229 | 92 |
| 5151 Highway A1a #103 | 0.28mi | 2/2.0 | 1,200 (0%) | 2mo | $490,000 | $408 | 85 |
| 5300 Highway A1a #206 | 0.14mi | 2/2.0 | 1,300 (+8%) | 0mo | $325,000 | $250 | 80 |
| 5300 Highway A1a #412 | 0.14mi | 2/2.0 | 1,300 (+8%) | 1mo | $380,000 | $292 | 79 |
| 5400 A1a Hwy Unit I-10 | 0.12mi | 2/2.0 | 1,300 (+8%) | 2mo | $275,000 | $212 | 79 |
| 5400 Highway A1a Unit G31 | 0.12mi | 2/2.0 | 1,300 (+8%) | 3mo | $345,000 | $265 | 78 |
| 5300 Highway A1a #401 | 0.14mi | 2/2.0 | 1,300 (+8%) | 2mo | $325,000 | $250 | 78 |
| 5100 Highway A1a Unit 56G | 0.47mi | 2/2.0 | 1,170 (-2%) | 3mo | $315,000 | $269 | 71 |
| 5400 Highway A1a Unit C9 | 0.10mi | 2/2.0 | 1,300 (+8%) | 12mo | $283,000 | $218 | 71 |
| 5100 Highway A1a Unit D33 | 0.48mi | 2/2.0 | 1,170 (-2%) | 3mo | $380,000 | $325 | 71 |
| 5100 Highway A1a Hwy Unit 44E | 0.47mi | 2/2.0 | 1,170 (-2%) | 12mo | $410,000 | $350 | 64 |
Match score weights: distance 35% · size 25% · config 20% · recency 20%. Top-matched comps best support the ARV.
Projected returns pro-forma
-3.0% appreciation · 8.0% rent growth · sell at horizon
- IRR
- 7.4%
- Equity multiple
- 1.31×
- Total profit
- $22,309
- Equity at exit
- $38,618
- IRR
- 21.4%
- Equity multiple
- 3.34×
- Total profit
- $169,788
- Equity at exit
- $22,394
Cash invested: $72,520 (down + closing). Projections, not guarantees.
Landlord ↔ Tenant lean methodology
- Overall (STATE)
- 87 Strongly Landlord-Friendly
- State Florida
- 87 Strongly Landlord-Friendly · R+3
- County
- — inherits STATE
- City
- — inherits STATE
ZIP-level market 32963
- Rents YoY
- 11.0%
- Active inventory
- 498
- Price-to-rent
- 5.6×
Monthly cashflow live
- Estimated rent
- $3,853 high interval (Pro) →
- Mortgage (P&I)
- −$1,358
- Tax est. 1.5%
- −$324 /mo · $3,885/yr
- Insurance
- −$108
- HOA
- −$571
- Vacancy / Maint / Mgmt
- −$809
- Net cashflow
- $683
Break-even live
UW: 25.0% down · 7.5% · 30yr · 1.5% tax · 5.0% vac · 8.0% maint · 8.0% mgmt
Financing live
Cash to close
- Down payment
- $64,750
- Closing costs
- $7,770
- Reserves months
- —
- Total cash needed
- —
Loan-product check · same deal, 3 products live
Conventional
25% down · 7.5% · 30yr
- Down + closing
- —
- Monthly P&I
- —
- Monthly cashflow
- —
- DSCR
- —
- Eligible?
- —
Personal DTI + credit; lowest rate.
DSCR
20% down · 8.5% · 30yr
- Down + closing
- —
- Monthly P&I
- —
- Monthly cashflow
- —
- DSCR
- —
- Eligible?
- —
No personal income docs; deal must DSCR.
Hard money
10% down · 12.0% · 12mo
- Down + closing
- —
- Monthly P&I
- —
- Monthly cashflow
- —
- DSCR
- —
- Eligible?
- —
Short-term bridge; refi at stabilization.
Rent comps 26 comps
| Address | Beds | Baths | Sqft | Rent | $/sqft | DOM | Units | Dist |
|---|---|---|---|---|---|---|---|---|
| 5400 Jimmy Buffett Memorial Hwy Indian River Shores, FL | 2.0 | 2.0 | 1200 | $1,800 | $1.50 | 20d | 1 | 0.03mi |
| 5400 Jimmy Buffett Memorial Hwy Unit A19 Indian River Shores, FL | 1.0 | 1.5 | 900 | $3,000 | $3.33 | 20d | 1 | 0.03mi |
| 5400 Jimmy Buffett Memorial Hwy Unit 5400A11 Indian River Shores, FL | 1.0 | 2.0 | 1000 | $2,500 | $2.50 | 20d | 1 | 0.08mi |
| 5400 Jimmy Buffett Memorial Hwy Unit B8 Indian River Shores, FL | 1.0 | 1.5 | 1000 | $1,650 | $1.65 | 13d | 1 | 0.08mi |
| 5400 Jimmy Buffett Memorial Hwy Unit I24 Indian River Shores, FL | 1.0 | 1.5 | 1000 | $1,650 | $1.65 | 20d | 1 | 0.08mi |
| 5300 Jimmy Buffett Memorial Hwy #301 Indian River Shores, FL | 2.0 | 2.0 | 1300 | $7,000 | $5.38 | 20d | 1 | 0.16mi |
| 5300 Jimmy Buffett Memorial Hwy Unit 408 Indian River Shores, FL | 2.0 | 2.0 | 1300 | $9,000 | $6.92 | 20d | 1 | 0.17mi |
| 5300 Jimmy Buffett Memorial Hwy Unit 305 Indian River Shores, FL | 2.0 | 2.0 | 1300 | $6,000 | $4.62 | 20d | 1 | 0.17mi |
| 5300 Jimmy Buffett Memorial Hwy Unit 214 Indian River Shores, FL | 2.0 | 2.0 | 1300 | $5,500 | $4.23 | 20d | 1 | 0.17mi |
| 5300 Jimmy Buffett Memorial Hwy Unit 314 Indian River Shores, FL | 2.0 | 2.0 | 1300 | $3,000 | $2.31 | 20d | 1 | 0.17mi |
| 837 Seminole Ln Vero Beach, FL | 2.0 | 2.0 | 860 | $2,800 | $3.26 | 13d | 1 | 0.20mi |
| 5151 Jimmy Buffett Memorial Hwy Unit 514 Indian River Shores, FL | 1.0 | 1.0 | 937 | $1,750 | $1.87 | 20d | 1 | 0.28mi |
| 5151 Jimmy Buffett Memorial Hwy Unit 512 Indian River Shores, FL | 2.0 | 2.0 | 1339 | $4,600 | $3.44 | 20d | 1 | 0.28mi |
| 5151 Jimmy Buffett Memorial Hwy Unit 305 Indian River Shores, FL | 2.0 | 2.0 | 1339 | $2,300 | $1.72 | 20d | 1 | 0.28mi |
| 5151 Jimmy Buffett Memorial Hwy Unit 516 Indian River Shores, FL | 1.0 | 1.5 | 937 | $3,000 | $3.20 | 20d | 1 | 0.29mi |
| 5100 Jimmy Buffett Memorial Hwy Unit 58G INDN RIV SHRS, FL | 2.0 | 2.0 | 1170 | $6,000 | $5.13 | 20d | 1 | 0.53mi |
| 4890 Bethel Creek Dr #5 Vero Beach, FL | 2.0 | 2.5 | 1244 | $2,200 | $1.77 | 20d | 1 | 0.95mi |
| 4834 Bethel Creek Dr Vero Beach, FL | 2.0 | 2.5 | 1500 | $2,900 | $1.93 | 20d | 1 | 0.97mi |
| 4601 Highway A1A #202 Vero Beach, FL | 2.0 | 2.0 | 1440 | $3,250 | $2.26 | 20d | 1 | 1.14mi |
| 4600 Highway A1A #507 Vero Beach, FL | 2.0 | 2.0 | 1400 | $5,000 | $3.57 | 20d | 1 | 1.17mi |
| 4450 Highway A1A #303 Vero Beach, FL | 2.0 | 2.0 | 1080 | $3,500 | $3.24 | 20d | 1 | 1.22mi |
| 4450 Highway A1A #404 Vero Beach, FL | 2.0 | 2.0 | 1080 | $3,499 | $3.24 | 13d | 1 | 1.22mi |
| 4450 Florida A1A Unit 102 Vero Beach, FL | 2.0 | 2.0 | 1000 | $3,900 | $3.90 | 20d | 1 | 1.22mi |
| 4400 Highway A1A #10 Vero Beach, FL | 2.0 | 2.0 | 800 | $5,500 | $6.88 | 20d | 1 | 1.29mi |
| 4150 Highway A1A #111 Vero Beach, FL | 2.0 | 2.0 | 1300 | $2,600 | $2.00 | 20d | 1 | 1.43mi |
| 4141 Ocean Dr Vero Beach, FL | 2.0–3.0 | 2.0 | 1200 | $3,500 | $2.92 | 13d | 4 | 1.48mi |
HOA detail
- Monthly dues
- $571 · $6,852/yr
- Likely covers
- pool
Listing history 27 events
-
2026-06-19days on market $259,000 Active 124 DOM
-
2026-06-18days on market $259,000 Active 123 DOM
-
2026-06-17days on market $259,000 Active 122 DOM
-
2026-06-16days on market $259,000 Active 121 DOM
-
2026-06-15days on market $259,000 Active 120 DOM
-
2026-06-14days on market $259,000 Active 118 DOM
-
2026-06-13days on market $259,000 Active 117 DOM
-
2026-06-10days on market $259,000 Active 115 DOM
-
2026-06-09days on market $259,000 Active 114 DOM
-
2026-06-08days on market $259,000 Active 113 DOM
-
2026-06-07days on market $259,000 Active 112 DOM
-
2026-06-05days on market $259,000 Active 109 DOM
-
2026-06-02days on market $259,000 Active 107 DOM
-
2026-06-01days on market $259,000 Active 106 DOM
-
2026-05-31days on market $259,000 Active 105 DOM
-
2026-05-30days on market $259,000 Active 104 DOM
-
2026-05-21price $259,000
-
2026-02-14$270,000 Active
-
2026-02-09historical
-
2025-02-28price $270,000
-
2025-02-28price $270,000
-
2024-04-20price $285,000
-
2024-04-20price $285,000
-
2024-03-22status Active
-
2024-03-18historical Active Under Contract
-
2024-03-14$295,000 Active
-
2024-03-08$295,000 Active
ⓘ Source: listings_history table (triggers on properties + properties_extension) + one-shot
backfill from property_details.listing_events for pre-trigger history.
Climate risk First Street
- Flood 6/10 Major FEMA zone X (unshaded) · 59% chance over 30 yrs
- Wildfire 1/10 Low
- Heat 10/10 Extreme 7 d/yr ≥105°F today · 25 d/yr by 30 yrs out
- Wind 10/10 Extreme 99% chance of damaging wind over 30 yrs
- Air quality 1/10 Low 0 unhealthy d/yr today · 0 by 30 yrs out
Nearby sold comps map
Loading sold comps map…
Walkable amenities ~0.75 mi
Loading nearby amenities…
Taxation est. · year 1
- Rental income
- $46,238
- − Mortgage interest
- −$14,508
- − Property taxes
- −$3,885
- − Insurance
- −$1,295
- − Repairs & maintenance
- −$3,699
- − Management
- −$3,699
- − HOA
- −$6,852
- − Depreciation
- −$7,535
- Taxable income
- $4,765
- Est. tax owed @ 24.0%
- −$1,144
- After-tax cash flow
- $7,053/yr
For passive investors: Depreciation is non-cash, so a rental often shows a tax loss while cash-flowing — sheltering income. Rental losses are passive: they offset passive income freely, and up to $25,000/yr can offset ordinary (W-2) income if you actively participate and your MAGI is under $100k (phasing out to $0 by $150k); unused losses carry forward. On sale, claimed depreciation is recaptured at up to 25%, and gains may owe capital-gains tax (a 1031 exchange can defer both). Figures are a year-1 estimate at your 24.0% rate — not tax advice; consult a CPA.
Schools (NCES district)
- District
- Indian River
- NCES district ID
- 1200930
- Math proficiency
- 48% ▼ -9.00%
- Reading proficiency
- 52% ▼ -3.00%
- Median HH income
- $46,597
- Composite
- 42.45/100
- National rank
- #3218
- State rank
- #35 of 73 in FL
Livability — Indian River Shores
- Score
- 68/100
- State rank
- #517
- US rank
- #9512
Category grades
Schools grade is shown separately in the Schools card above.
Census & demographics
- Census place
- Indian River Shores, FL
- County
- Indian River County · 143,738 people
- City population
- 15,008
- Metro
- Sebastian-Vero Beach, FL
- Population (ZIP)
- 15,008
- Household income
- $149,923
- Rent vs Own
- Severe rent burden
- 119.0
Population outlook (Indian River County) Hauer SSP2
- Today (2025)
- 165,104 people
- By 2030
- 172,869 · +4.7%
- By 2040
- 185,640 · +12.4%
- By 2050
- 194,465 · +17.8%
- By 2075
- 211,115 · +27.9%
- By 2100
- 211,781 · +28.3%
Race, ethnicity, and origin ACS 2023
- Neighborhood character
- Predominantly White (92%)
- Race & ethnicity
- White 92% Two or more races 5% Hispanic / Latino 4% Asian 2%
- Common ancestry
- Slovak 5% Lithuanian 4% Italian 3%
- Foreign-born
- 9% · Canada
- Languages at home
- 92% English-only · Spanish 3% Other Indo-European 1% German/W. Germanic 1%
Political lean MEDSL · Indian River
- 2024 margin
- Strong R (+27.4) · D 36.0% · R 63.4%
- 2008→2024 swing
- -12.5pp toward R · 2008: -14.8pp · 2024: -27.4pp
- All cycles
- 2024: R+27.4 2020: R+21.6 2016: R+24.5 2012: R+22.3 2008: R+14.8
Not yet ingested
- Civics
- —
Market trends
- HPI YoY
- ▼ -180.47%
- Current HPI
- 312.0326
- Rent YoY
- ▲ 11.04%
- Metro
- Sebastian-Vero Beach, FL
- State GDP YoY
- ▲ 3.28%
- F500 in state
- 36
Industry mix (Fortune 500 HQ in FL)
| Industry | F500 HQs | Revenue |
|---|---|---|
| Industrial Technology | 2 | $29B |
|
||
| Insurance | 2 | $17B |
|
||
| Retail | 1 | $60B |
|
||
| Technology Distribution | 1 | $58B |
|
||
| Homebuilding | 1 | $35B |
|
||
| Technology Manufacturing | 1 | $35B |
|
||
Price history
-12.2% since first listed11 events — show timeline
- 2026-05-21 Price Changed $259,000 RAIRCMLS
- 2026-02-14 Listed $270,000 RAIRCMLS
- 2026-02-09 Listing Removed — Beaches MLS
- 2025-02-28 Price Changed $270,000 Beaches MLS
- 2025-02-28 Price Changed $270,000 RAIRCMLS
- 2024-04-20 Price Changed $285,000 Beaches MLS
- 2024-04-20 Price Changed $285,000 RAIRCMLS
- 2024-03-22 Relisted — RAIRCMLS
- 2024-03-18 Contingent — RAIRCMLS
- 2024-03-14 Listed $295,000 Beaches MLS
- 2024-03-08 Listed $295,000 RAIRCMLS
Cash-flow waterfall
monthlySold comps — $/sqft
last 12 mo · ≤1 miLoading sold comps…