8916 Lakeside Dr · Pinebrook, TX
Flood risk 1/10 · Minimal
- FEMA flood zone
- X (unshaded)
- Chance of flooding over 30 yrs
- 0.0%
- Est. flood insurance / yr
- $507 – $1,088
Fire risk 6/10 · Moderate
- Est. fire insurance / yr
- $1,222 – $2,270
Heat risk 8/10 · Major
- Hot days now (above 110°F)
- 6 days/yr
- Hot days in 30 yrs
- 20 days/yr
Wind risk 8/10 · Major
- Chance of severe wind over 30 yrs
- 98.0%
Air-quality risk 2/10 · Minimal
- Unhealthy air days now
- 1 days/yr
- Unhealthy air days in 30 yrs
- 1 days/yr
Risk factors via First Street. Map © Google.
Why this score? — see what drove the C+ grade
The composite is a weighted blend of 9 inputs, each scored 0–100. Each bar is that input's sub-score; the figure is the points it added to the 100-point composite (weight × sub-score).
- Cash flow +25.1/30.0
- DSCR +8.2/10.0
- ARV discount +7.5/15.0
- 1% rule +5.8/10.0
- Appreciation +5.0/10.0
- Schools +2.7/10.0
- Rent growth +2.5/5.0
- Livability +2.5/5.0
- Condition / age +2.5/5.0
$140,000
🖨 Deal sheet 📄 Offer letter ✓ Due diligence
Listing remarks MLS
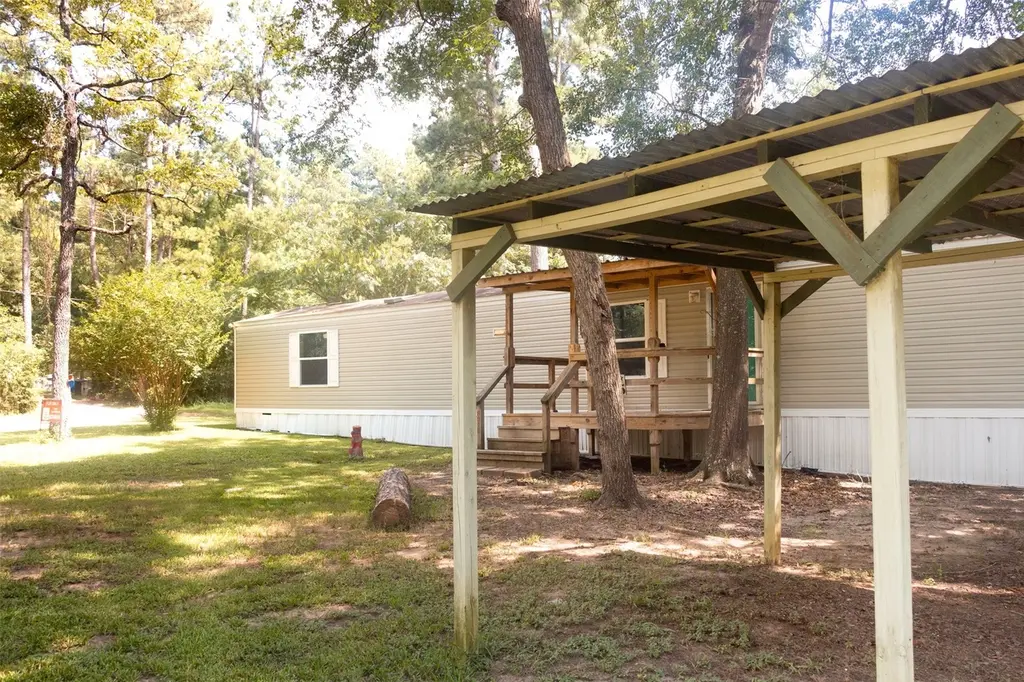
Welcome to your future home! This charming 3-bedroom, 2-bath property is the perfect blend of comfort and modern living. With a spacious layout, an inviting design, and an attached 2-car garage, this home is ready for families or anyone seeking a cozy retreat. The well-maintained yard offers outdoor space for relaxation or gatherings, while the thoughtfully designed interior ensures a seamless living experience. Whether you're a first-time buyer, upgrading to your dream home, or seeking a great investment opportunity, this property has everything you need. Don’t miss the chance to make it yours—schedule your tour today!
Key facts
- Well maintained yard
- 7,470 sq ft lot
- Parking
Tags
Neighborhood map
What this means for you Summary
Snapshot
- This is a 3-bed/2.0-bath manufactured listed at $140k.
Deal economics
- At list price, monthly cash flow is $310 ($4k/yr) — positive.
- The deal already cash-flows at list — no discount required.
- Meets the 1% rule at list price ($2k rent vs $140k).
- Recommended offer: $123k (12.0% below list) — sets the bar for market timing.
Location & tenants
- Location reads: area grade C — affects rentability + tenant quality, not the cash-flow math above.
- Navasota ISD (town): math 31% / reading 31% proficiency, ranked #600 of 826 in TX (top 73%) — families likely to look elsewhere, expect single-tenant / working-renter base with shorter leases; 68% free/reduced lunch — lower-income household profile, screen leases tightly.
- Market conditions: 173 active listings in the ZIP; 110 units permitted in Grimes County in 2024 (0 in 5+ unit buildings).
Forward outlook
- In year one you build about $5k of equity ($968 loan paydown + $4k appreciation (3.0% local appreciation)).
- Grimes County population projected at +10% by 2050 — modest demand growth; plan on rents tracking national, not racing it.
- At projected returns (3.0% appreciation + 3.0% rent growth), your $39k cash investment doubles in ~5 years — after that, you're playing with house money.
- By year 7, paydown + projected appreciation supports a ~$33k cash-out refi (75% LTV) — recoverable capital for the next deal without selling this one.
Negotiation context
- It's been on market 528 days — a 12% lower offer ($123k) is reasonable based on typical stale-listing flexibility.
- 4 sale attempts since 5y ago; this cycle's ask has dropped $13k (8%) from the opening price — seller is motivated, your offer sets the floor, not the list.
Risks & watch-outs
- Climate carrying-cost: severe wind risk, 98% chance of damaging wind over 30y; major wildfire risk; extreme-heat days projected 6→20/yr by 2055 (HVAC capex compounding) — expect insurance premiums to compound above CPI over the hold.
Questions for the listing agent
- It's been on market 528 days. Have you received any prior offers? Is the seller open to a 12% concession, seller financing, or rate buy-down credit?
- Why hasn't it sold? Are there any deal-killer items the seller is aware of (foundation, flood, title, zoning, code violations)?
- Is there a deadline driving the sale (1031 exchange, divorce, estate, relocation)? That informs how much negotiation room exists.
- What's the average days-on-market for RENTAL listings here right now (not sales)? A rising rental-DOM trend means longer vacancies and softer asking-rent achievability than the comps imply.
- What's the recent tenant-quality profile in this submarket — average credit score on applications, eviction rate, late-payment / NSF rate, and stable-employment percentage? A property-management company in the area should have these aggregated.
- How much new for-sale + rental construction is in the pipeline within 1–3 miles? Heavy new supply typically softens prices + rents 12–24 months out; constrained supply supports both.
Investment metrics
- 1% rule
- 1.08% ✓
- Cap rate
- 8.95%
- Cash-on-cash
- 9.49%
- DSCR
- 1.42
- GRM
- 7.7
CMA / ARV
No comps found within radius.
Projected returns pro-forma
3.0% appreciation · 3.0% rent growth · sell at horizon
- IRR
- 16.4%
- Equity multiple
- 1.93×
- Total profit
- $36,589
- Equity at exit
- $62,950
- IRR
- 17.9%
- Equity multiple
- 3.62×
- Total profit
- $102,547
- Equity at exit
- $97,014
Cash invested: $39,200 (down + closing). Projections, not guarantees.
Landlord ↔ Tenant lean methodology
- Overall (STATE)
- 87 Strongly Landlord-Friendly
- State Texas
- 87 Strongly Landlord-Friendly · R+5
- County
- — inherits STATE
- City
- — inherits STATE
ZIP-level market 77363
- Active inventory
- 173
- Price-to-rent
- 7.7×
Monthly cashflow live
- Estimated rent
- $1,507 medium interval (Pro) →
- Mortgage (P&I)
- −$734
- Tax from tax record
- −$88 /mo · $1,054/yr
- Insurance
- −$58
- HOA
- −$0
- Vacancy / Maint / Mgmt
- −$316
- Net cashflow
- $310
Break-even live
UW: 25.0% down · 7.5% · 30yr · 1.5% tax · 5.0% vac · 8.0% maint · 8.0% mgmt
Financing live
Cash to close
- Down payment
- $35,000
- Closing costs
- $4,200
- Reserves months
- —
- Total cash needed
- —
Loan-product check · same deal, 3 products live
Conventional
25% down · 7.5% · 30yr
- Down + closing
- —
- Monthly P&I
- —
- Monthly cashflow
- —
- DSCR
- —
- Eligible?
- —
Personal DTI + credit; lowest rate.
DSCR
20% down · 8.5% · 30yr
- Down + closing
- —
- Monthly P&I
- —
- Monthly cashflow
- —
- DSCR
- —
- Eligible?
- —
No personal income docs; deal must DSCR.
Hard money
10% down · 12.0% · 12mo
- Down + closing
- —
- Monthly P&I
- —
- Monthly cashflow
- —
- DSCR
- —
- Eligible?
- —
Short-term bridge; refi at stabilization.
Listing history 32 events
-
2026-06-18days on market $140,000 Active 528 DOM
-
2026-06-17days on market $140,000 Active 527 DOM
-
2026-06-16days on market $140,000 Active 526 DOM
-
2026-06-15days on market $140,000 Active 525 DOM
-
2026-06-13days on market $140,000 Active 523 DOM
-
2026-06-09days on market $140,000 Active 519 DOM
-
2026-06-08days on market $140,000 Active 518 DOM
-
2026-06-07days on market $140,000 Active 517 DOM
-
2026-06-04days on market $140,000 Active 514 DOM
-
2026-06-03days on market $140,000 Active 513 DOM
-
2026-06-02days on market $140,000 Active 512 DOM
-
2026-06-01days on market $140,000 Active 511 DOM
-
2026-05-31days on market $140,000 Active 510 DOM
-
2026-02-16price $140,000 639-char remark
Show marketing remark (639 chars)
Welcome to your future home! This charming 3-bedroom, 2-bath property is the perfect blend of comfort and modern living. With a spacious layout, an inviting design, and an attached 2-car garage, this home is ready for families or anyone seeking a cozy retreat. The well-maintained yard offers outdoor space for relaxation or gatherings, while the thoughtfully designed interior ensures a seamless living experience. Whether you're a first-time buyer, upgrading to your dream home, or seeking a great investment opportunity, this property has everything you need. Don’t miss the chance to make it yours—schedule your tour today!
-
2025-01-06$153,000 Active 639-char remark
Show marketing remark (639 chars)
Welcome to your future home! This charming 3-bedroom, 2-bath property is the perfect blend of comfort and modern living. With a spacious layout, an inviting design, and an attached 2-car garage, this home is ready for families or anyone seeking a cozy retreat. The well-maintained yard offers outdoor space for relaxation or gatherings, while the thoughtfully designed interior ensures a seamless living experience. Whether you're a first-time buyer, upgrading to your dream home, or seeking a great investment opportunity, this property has everything you need. Don’t miss the chance to make it yours—schedule your tour today!
-
2024-11-02historical
-
2024-10-02historical $1,450
-
2024-09-24price $1,450
-
2024-08-22price $165,000
-
2024-06-09$1,650
-
2024-04-29price $145,000
-
2024-04-25price $150,000
-
2024-04-04price $165,000
-
2024-03-25price $155,000
-
2024-03-14price $175,000
-
2023-11-01$210,000 Active
-
2022-03-04soldstatus
-
2022-03-03soldstatus Sold
-
2022-01-27status Pending
-
2021-12-16$90,000 Active
-
2019-11-26soldstatus
-
2010-03-12soldstatus
ⓘ Source: listings_history table (triggers on properties + properties_extension) + one-shot
backfill from property_details.listing_events for pre-trigger history.
Tax reassessment forecast TX · Resets to sale price
- Current annual tax
- $1,054 · $88/mo
- Projected year-2 tax
- $2,562 · $214/mo
- Expected delta
- +$1,508/yr (+$126/mo · 143.1%)
ⓘ Screening estimate from a state-policy table — verify with the county assessor before closing.
Climate risk First Street
- Flood 1/10 Low FEMA zone X (unshaded) · 0% chance over 30 yrs
- Wildfire 6/10 Major
- Heat 8/10 Severe 6 d/yr ≥110°F today · 20 d/yr by 30 yrs out
- Wind 8/10 Severe 98% chance of damaging wind over 30 yrs
- Air quality 2/10 Low 1 unhealthy d/yr today · 1 by 30 yrs out
Nearby sold comps map
Loading sold comps map…
Walkable amenities ~0.75 mi
Loading nearby amenities…
Taxation est. · year 1
- Rental income
- $18,084
- − Mortgage interest
- −$7,842
- − Property taxes
- −$1,054
- − Insurance
- −$700
- − Repairs & maintenance
- −$1,447
- − Management
- −$1,447
- − Depreciation
- −$4,073
- Taxable income
- $1,521
- Est. tax owed @ 24.0%
- −$365
- After-tax cash flow
- $3,357/yr
For passive investors: Depreciation is non-cash, so a rental often shows a tax loss while cash-flowing — sheltering income. Rental losses are passive: they offset passive income freely, and up to $25,000/yr can offset ordinary (W-2) income if you actively participate and your MAGI is under $100k (phasing out to $0 by $150k); unused losses carry forward. On sale, claimed depreciation is recaptured at up to 25%, and gains may owe capital-gains tax (a 1031 exchange can defer both). Figures are a year-1 estimate at your 24.0% rate — not tax advice; consult a CPA.
Schools (NCES district)
- District
- Navasota ISD
- NCES district ID
- 4832190
- Math proficiency
- 31% ▲ 1.00%
- Reading proficiency
- 31% ▲ 1.00%
- Median HH income
- $44,326
- Composite
- 26.5/100
- National rank
- #7205
- State rank
- #600 of 826 in TX
Livability — Pinebrook
No livability data for this city. (Only ~50 U.S. cities are tracked.)
Census & demographics
- Census place
- Pinebrook, TX
- Population (ZIP)
- 3,246
Population outlook (Grimes County) Hauer SSP2
- Today (2025)
- 28,910 people
- By 2030
- 29,539 · +2.2%
- By 2040
- 30,648 · +6.0%
- By 2050
- 31,698 · +9.6%
- By 2075
- 34,351 · +18.8%
- By 2100
- 33,565 · +16.1%
Race, ethnicity, and origin ACS 2023
- Neighborhood character
- Predominantly White (71%)
- Race & ethnicity
- White 71% Hispanic / Latino 19% Two or more races 15% Black 4%
- Hispanic origin (detail)
- Mexican 19%
- Common ancestry
- Slovak 3% Italian 3% Romanian 3%
- Foreign-born
- 8% · Canada, Vietnam
- Languages at home
- 84% English-only · Spanish 15% Vietnamese 1%
Political lean MEDSL · Grimes
- 2024 margin
- Solid R (+60.3) · D 19.5% · R 79.7%
- 2008→2024 swing
- -25.9pp toward R · 2008: -34.3pp · 2024: -60.3pp
- All cycles
- 2024: R+60.3 2020: R+53.2 2016: R+51.1 2012: R+44.2 2008: R+34.3
Not yet ingested
- Civics
- —
Market trends
- HPI YoY
- —
- Current HPI
- —
- Rent YoY
- —
- Metro
- —
- State GDP YoY
- ▲ 3.95%
- F500 in state
- 110
Industry mix (Fortune 500 HQ in TX)
| Industry | F500 HQs | Revenue |
|---|---|---|
| Energy | 16 | $1,198B |
|
||
| Technology | 5 | $198B |
|
||
| Engineering / Construction | 4 | $72B |
|
||
| Energy Services | 3 | $60B |
|
||
| Utilities | 3 | $41B |
|
||
| Healthcare | 2 | $330B |
|
||
Price history
+55.6% since first listed19 events — show timeline
- 2026-02-16 Price Changed $140,000 HARMLS
- 2025-01-06 Listed $153,000 HARMLS
- 2024-11-02 Listing Removed — HARMLS
- 2024-10-02 Rental Removed $1,450 HARMLS
- 2024-09-24 Price Changed $1,450 HARMLS
- 2024-08-22 Price Changed $165,000 HARMLS
- 2024-06-09 Listed for Rent $1,650 HARMLS
- 2024-04-29 Price Changed $145,000 HARMLS
- 2024-04-25 Price Changed $150,000 HARMLS
- 2024-04-04 Price Changed $165,000 HARMLS
- 2024-03-25 Price Changed $155,000 HARMLS
- 2024-03-14 Price Changed $175,000 HARMLS
- 2023-11-01 Listed $210,000 HARMLS
- 2022-03-04 Sold (Public Records) — Public Records
- 2022-03-03 Sold (MLS) — HARMLS
- 2022-01-27 Pending — HARMLS
- 2021-12-16 Listed $90,000 HARMLS
- 2019-11-26 Sold (Public Records) — Public Records
- 2010-03-12 Sold (Public Records) — Public Records
Property tax history
+3.5%/yrLatest (2025): $1,054 · +24.8% YoY. Source: county tax records.
Cash-flow waterfall
monthlySold comps — $/sqft
last 12 mo · ≤1 miLoading sold comps…