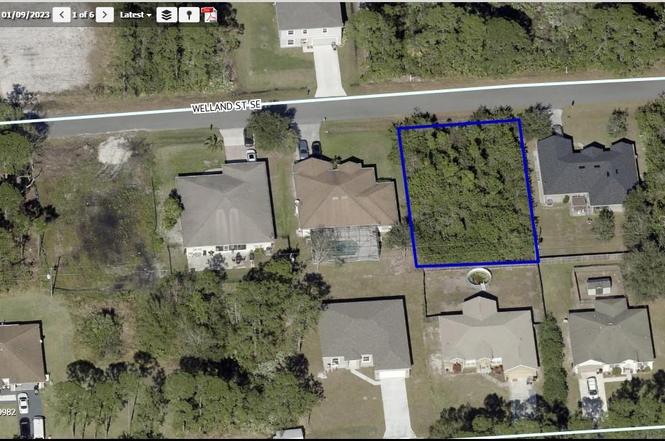
1620 Welland St SE · Palm Bay, FL
Flood risk 8/10 · Major
- FEMA flood zone
- X (unshaded)
- Chance of flooding over 30 yrs
- 0.99%
- Est. flood insurance / yr
- $507 – $1,088
Fire risk 4/10 · Minor
- Est. fire insurance / yr
- $947 – $1,759
Heat risk 9/10 · Severe
- Hot days now (above 106°F)
- 7 days/yr
- Hot days in 30 yrs
- 21 days/yr
Wind risk 10/10 · Severe
- Chance of severe wind over 30 yrs
- 99.0%
Air-quality risk 1/10 · Minimal
- Unhealthy air days now
- 0 days/yr
- Unhealthy air days in 30 yrs
- 0 days/yr
Risk factors via First Street. Map © Google.
Why this score? — see what drove the D- grade
The composite is a weighted blend of 9 inputs, each scored 0–100. Each bar is that input's sub-score; the figure is the points it added to the 100-point composite (weight × sub-score).
- Appreciation +10.0/10.0
- ARV discount +7.5/15.0
- Schools +4.7/10.0
- Cash flow +4.4/30.0
- Livability +3.6/5.0
- Rent growth +3.4/5.0
- Condition / age +2.5/5.0
- 1% rule +0.4/10.0
- DSCR +0.0/10.0
$394,999
🖨 Deal sheet 📄 Offer letter ✓ Due diligence
Listing remarks MLS
Palm Bay lot. Priced to sell fast! Seller has 5 lots total!
Key facts
- Open floor plan
- Spacious backyard
- Flexible bonus room
Tags
Property features AI
Finance
- Other: Lot approximately 0.23 acres (80 x 125); Living area 1,681 (public records); Total building area 2,270; Direction faces north; Permit number BL24-07117
- Financial info: No lease restrictions; Home warranty included
- HOA & community: Pets allowed; No association approval required
Exterior
- Parking: Attached garage with 2 spaces
- Utilities: Well water; Septic tank sewer; Electricity connected
- Home design: Single family residence; Residential property; One story; North-facing
- Construction: Block construction; Shingle roof; New construction; Built by Guida Design Group LLC; Completed condition; Slab foundation; 1 well; 1 septic system
- Exterior features: Other exterior features; Asphalt road access
Interior
- Kitchen: Dishwasher; Microwave; Range; Refrigerator
- Bedrooms: 3 bedrooms
- Flooring: Ceramic tile; Slab foundation
- Bathrooms: 2 full bathrooms; 1 half bathroom
- Heating & cooling: Central heating; Central air conditioning
- Interior features: Ceiling fans; Kitchen-family room combo; Living room-dining room combo; Solid surface counters; Split bedroom floor plan; Thermostat; Walk-in closets
- Laundry & utility: Dedicated laundry room
Neighborhood map
What this means for you Summary
Snapshot
- This is a 3-bed/2.5-bath land listed at $395k.
Deal economics
- At list price, monthly cash flow is $-1k ($-13k/yr) — negative.
- To cash-flow at today's rent, offer at most $234k (40.7% below list).
- To meet the 1% rule (rent ≥ 1% of price), the offer needs to be $213k (46.0% below list).
- Recommended offer: $213k (46.0% below list) — sets the bar for 1% rule.
Location & tenants
- Location reads 72/100 on livability (#366 in FL) — a middle-class / working-renter tenant base. Strengths: cost of living A+, housing A+; Watch: schools C-, employment D+, amenities F.
- Brevard (suburban): math 53% / reading 57% proficiency, ranked #19 of 73 in FL (top 26%) — acceptable for families but not a draw, mixed tenant base, ~2y average lease.
- Market conditions: Rents rising (+3.7%/yr); 1111 active listings in the ZIP; 16 comparable units currently listed for rent nearby; rentals at typical pace (median 24d on market — plan ~3-4 weeks tenant-placement turnaround); solid renter incomes; 4,602 units permitted in Brevard County in 2024 (702 in 5+ unit buildings).
- This rent runs 32% of the median local income ($80k/yr) — at the standard rent-burdened threshold; future hikes will face affordability resistance.
Forward outlook
- In year one you build about $42k of equity ($3k loan paydown + $40k appreciation (10.0% local appreciation)).
- Brevard County population projected at +15% by 2050 — modest demand growth; plan on rents tracking national, not racing it.
- By year 2, paydown + projected appreciation supports a ~$68k cash-out refi (75% LTV) — recoverable capital for the next deal without selling this one.
Negotiation context
- It's been on market 139 days — a 12% lower offer ($348k) is reasonable based on typical stale-listing flexibility.
- 8 sale attempts since 22y ago; this cycle's ask is 17895% above the opening price — seller raised mid-cycle; expect resistance to lowballs.
- Current owner paid $36k; list at $395k implies a 1013% gain — meaningful room to come down on a strong offer.
Risks & watch-outs
- Watch-outs: flood insurance adds $66/mo.
- Climate carrying-cost: severe flood risk; severe wind risk, 99% chance of damaging wind over 30y; extreme-heat days projected 7→21/yr by 2055 (HVAC capex compounding) — expect insurance premiums to compound above CPI over the hold.
Questions for the listing agent
- What do current leases actually rent for vs. the listed asking? Can we see a recent rent roll and the last 12 months of T-12 income?
- It's been on market 139 days. Have you received any prior offers? Is the seller open to a 46% concession, seller financing, or rate buy-down credit?
- What's the actual annual flood-insurance premium (NFIP or private), and is the property in a SFHA with mandatory coverage?
- Why hasn't it sold? Are there any deal-killer items the seller is aware of (foundation, flood, title, zoning, code violations)?
- Is there a deadline driving the sale (1031 exchange, divorce, estate, relocation)? That informs how much negotiation room exists.
- The area grade is low — what's the realistic commute time and amenity access for the typical tenant pool here? Any planned neighborhood developments (good or bad) we should know about?
- What's the average days-on-market for RENTAL listings here right now (not sales)? A rising rental-DOM trend means longer vacancies and softer asking-rent achievability than the comps imply.
- What's the recent tenant-quality profile in this submarket — average credit score on applications, eviction rate, late-payment / NSF rate, and stable-employment percentage? A property-management company in the area should have these aggregated.
- How much new for-sale + rental construction is in the pipeline within 1–3 miles? Heavy new supply typically softens prices + rents 12–24 months out; constrained supply supports both.
Investment metrics
- 1% rule
- 0.54% ✗
- Cap rate
- 3.12%
- Cash-on-cash
- -11.33%
- DSCR
- 0.50
- GRM
- 15.4
CMA / ARV
No comps found within radius.
Projected returns pro-forma
10.0% appreciation · 3.67% rent growth · sell at horizon
- IRR
- 16.0%
- Equity multiple
- 2.32×
- Total profit
- $145,931
- Equity at exit
- $355,846
- IRR
- 15.5%
- Equity multiple
- 5.42×
- Total profit
- $488,521
- Equity at exit
- $767,396
Cash invested: $110,600 (down + closing). Projections, not guarantees.
Landlord ↔ Tenant lean methodology
- Overall (STATE)
- 87 Strongly Landlord-Friendly
- State Florida
- 87 Strongly Landlord-Friendly · R+3
- County
- — inherits STATE
- City
- — inherits STATE
ZIP-level market 32909
- Home prices YoY
- 6.0%
- Rents YoY
- 3.7%
- Active inventory
- 1111
- Price-to-rent
- 15.4×
Monthly cashflow live
- Estimated rent
- $2,134 high interval (Pro) →
- Mortgage (P&I)
- −$2,071
- Tax est. 1.5%
- −$494 /mo · $5,925/yr
- Insurance
- −$165
- Flood insurance flood zone
- −$66 /mo · $798/yr
- HOA
- −$0
- Vacancy / Maint / Mgmt
- −$448
- Net cashflow
- $-1,110
Break-even live
UW: 25.0% down · 7.5% · 30yr · 1.5% tax · 5.0% vac · 8.0% maint · 8.0% mgmt
Financing live
Cash to close
- Down payment
- $98,750
- Closing costs
- $11,850
- Reserves months
- —
- Total cash needed
- —
Loan-product check · same deal, 3 products live
Conventional
25% down · 7.5% · 30yr
- Down + closing
- —
- Monthly P&I
- —
- Monthly cashflow
- —
- DSCR
- —
- Eligible?
- —
Personal DTI + credit; lowest rate.
DSCR
20% down · 8.5% · 30yr
- Down + closing
- —
- Monthly P&I
- —
- Monthly cashflow
- —
- DSCR
- —
- Eligible?
- —
No personal income docs; deal must DSCR.
Hard money
10% down · 12.0% · 12mo
- Down + closing
- —
- Monthly P&I
- —
- Monthly cashflow
- —
- DSCR
- —
- Eligible?
- —
Short-term bridge; refi at stabilization.
Rent comps 16 comps
| Address | Beds | Baths | Sqft | Rent | $/sqft | DOM | Units | Dist |
|---|---|---|---|---|---|---|---|---|
| 1674 Waltz St SE Palm Bay, FL | 3.0 | 2.0 | 1262 | $1,831 | $1.45 | 14d | 1 | 0.56mi |
| 1677 Lizette St SE Unit A Palm Bay, FL | 3.0 | 2.0 | 2080 | $1,900 | $0.91 | 14d | 1 | 0.59mi |
| 1660 Lizette St SE Unit 1 Palm Bay, FL | 4.0 | 2.0 | 1736 | $2,199 | $1.27 | 23d | 1 | 0.62mi |
| 1625 Waneta St SE Palm Bay, FL | 3.0 | 2.0 | 1631 | $2,100 | $1.29 | 19d | 1 | 0.70mi |
| 2036 Walsh Ave SE Palm Bay, FL | 3.0 | 2.0 | 1331 | $1,930 | $1.45 | 23d | 1 | 0.70mi |
| 1454 Graves St SE Palm Bay, FL | 3.0 | 2.0 | 1621 | $2,100 | $1.30 | 14d | 1 | 0.77mi |
| 1416 Martinez St SE Palm Bay, FL | 3.0 | 2.0 | 1747 | $2,000 | $1.14 | 14d | 1 | 0.91mi |
| 1406 Martinez St SE Palm Bay, FL | 4.0 | 2.0 | 2083 | $2,100 | $1.01 | 23d | 1 | 0.92mi |
| 1530 Paley Cir SE Palm Bay, FL | 4.0 | 2.0 | 1842 | $2,095 | $1.14 | 14d | 1 | 0.95mi |
| 1418 Paley Cir SE Palm Bay, FL | 3.0 | 2.0 | 1260 | $1,850 | $1.47 | 23d | 1 | 1.12mi |
| 1165 Rabbit St SE Palm Bay, FL | 3.0 | 2.0 | 1994 | $1,895 | $0.95 | 19d | 1 | 1.15mi |
| 1150 Tiger St SE Palm Bay, FL | 3.0 | 2.0 | 1690 | $1,950 | $1.15 | 14d | 1 | 1.20mi |
| 1068 Saint Johns St SE Palm Bay, FL | 3.0 | 2.0 | 1332 | $2,000 | $1.50 | 23d | 1 | 1.25mi |
| 1150 Raoul St SE Palm Bay, FL | 4.0 | 2.0 | 1787 | $2,300 | $1.29 | 23d | 1 | 1.27mi |
| 1517 Wacker Ave SE Palm Bay, FL | 4.0 | 2.0 | 1775 | $2,200 | $1.24 | 23d | 1 | 1.39mi |
| 978 Remington Green Dr SE Palm Bay, FL | 4.0 | 2.0 | 1830 | $2,200 | $1.20 | 23d | 1 | 1.49mi |
Listing history 26 events
-
2026-05-22historical $2,195
-
2026-05-01price $394,999
-
2026-02-05price $399,999
-
2026-01-31$2,195
-
2026-01-07$429,999 Active
-
2024-02-07soldstatus $35,500 Closed 59-char remark
Show marketing remark (59 chars)
Palm Bay lot. Priced to sell fast! Seller has 5 lots total!
-
2024-01-29soldstatus $35,500 Closed 144-char remark
Show marketing remark (144 chars)
Great lot at a great price. Won't last long. Seller has multiple lots available. Please call or text with questions and submit offers via email.
-
2024-01-03status Pending 59-char remark
Show marketing remark (144 chars)
Great lot at a great price. Won't last long. Seller has multiple lots available. Please call or text with questions and submit offers via email.
-
2024-01-03status Pending 144-char remark
Show marketing remark (144 chars)
Great lot at a great price. Won't last long. Seller has multiple lots available. Please call or text with questions and submit offers via email.
-
2023-12-08price $38,500 144-char remark
Show marketing remark (144 chars)
Great lot at a great price. Won't last long. Seller has multiple lots available. Please call or text with questions and submit offers via email.
-
2023-12-08price $39,500 144-char remark
Show marketing remark (144 chars)
Great lot at a great price. Won't last long. Seller has multiple lots available. Please call or text with questions and submit offers via email.
-
2023-11-20$38,500 Active 144-char remark
Show marketing remark (144 chars)
Great lot at a great price. Won't last long. Seller has multiple lots available. Please call or text with questions and submit offers via email.
-
2023-11-18$38,500 Active 59-char remark
Show marketing remark (59 chars)
Palm Bay lot. Priced to sell fast! Seller has 5 lots total!
-
2022-01-10soldstatus $31,500 Closed
-
2021-12-08historical Contingent
-
2021-12-01price $33,000
-
2021-11-08$35,000 Active
-
2020-09-18soldstatus $11,000 Closed
-
2020-08-28historical Contingent
-
2019-10-28$11,000 Active
-
2011-01-02historical
-
2010-01-11$11,000
-
2004-09-28soldstatus $23,500
-
2004-09-10soldstatus $23,500
-
2004-08-02$25,000
-
2004-07-23soldstatus $15,000
ⓘ Source: listings_history table (triggers on properties + properties_extension) + one-shot
backfill from property_details.listing_events for pre-trigger history.
Climate risk First Street
- Flood 8/10 Severe FEMA zone X (unshaded) · 99% chance over 30 yrs
- Wildfire 4/10 Moderate
- Heat 9/10 Extreme 7 d/yr ≥106°F today · 21 d/yr by 30 yrs out
- Wind 10/10 Extreme 99% chance of damaging wind over 30 yrs
- Air quality 1/10 Low 0 unhealthy d/yr today · 0 by 30 yrs out
Nearby sold comps map
Loading sold comps map…
Walkable amenities ~0.75 mi
Loading nearby amenities…
Taxation est. · year 1
- Rental income
- $25,608
- − Mortgage interest
- −$22,126
- − Property taxes
- −$5,925
- − Insurance
- −$2,772
- − Repairs & maintenance
- −$2,049
- − Management
- −$2,049
- − Depreciation
- −$11,491
- Taxable loss
- −$20,803
- Est. tax savings @ 24.0%
- +$4,993
- After-tax cash flow
- $-8,331/yr
For passive investors: Depreciation is non-cash, so a rental often shows a tax loss while cash-flowing — sheltering income. Rental losses are passive: they offset passive income freely, and up to $25,000/yr can offset ordinary (W-2) income if you actively participate and your MAGI is under $100k (phasing out to $0 by $150k); unused losses carry forward. On sale, claimed depreciation is recaptured at up to 25%, and gains may owe capital-gains tax (a 1031 exchange can defer both). Figures are a year-1 estimate at your 24.0% rate — not tax advice; consult a CPA.
Schools (NCES district)
- District
- Brevard
- NCES district ID
- 1200150
- Math proficiency
- 53% ▼ -9.00%
- Reading proficiency
- 57% ▼ -4.00%
- Median HH income
- $49,426
- Composite
- 46.86/100
- National rank
- #2370
- State rank
- #19 of 73 in FL
Livability — Palm Bay
- Score
- 72/100
- State rank
- #366
- US rank
- #6458
Category grades
Schools grade is shown separately in the Schools card above.
Census & demographics
- Census place
- Palm Bay, FL
- County
- Brevard County · 602,871 people
- City population
- 132,211
- Metro
- Palm Bay-Melbourne-Titusville, FL
- Population (ZIP)
- 41,804
- Household income
- $79,977
- Rent vs Own
- Severe rent burden
- 697.0
Population outlook (Brevard County) Hauer SSP2
- Today (2025)
- 623,254 people
- By 2030
- 648,420 · +4.0%
- By 2040
- 690,009 · +10.7%
- By 2050
- 715,669 · +14.8%
- By 2075
- 775,744 · +24.5%
- By 2100
- 776,687 · +24.6%
Race, ethnicity, and origin ACS 2023
- Neighborhood character
- Diverse neighborhood (Simpson 0.70)
- Race & ethnicity
- White 46% Black 21% Hispanic / Latino 20% Two or more races 16% Asian 4%
- Hispanic origin (detail)
- Mexican 2% Puerto Rican 8% Cuban 5%
- Common ancestry
- Hispanic 3% Slovak 2% Lithuanian 2%
- Foreign-born
- 17% · Canada, China, Jamaica
- Languages at home
- 84% English-only · Spanish 9% French/Haitian/Cajun 4% Chinese 1%
Political lean MEDSL · Brevard
- 2024 margin
- Strong R (+20.8) · D 39.1% · R 59.9% · Other 1.0%
- 2008→2024 swing
- -10.4pp toward R · 2008: -10.4pp · 2024: -20.8pp
- All cycles
- 2024: R+20.8 2020: R+16.4 2016: R+19.8 2012: R+12.7 2008: R+10.4
Not yet ingested
- Civics
- —
Market trends
- HPI YoY
- ▲ 18.81%
- Current HPI
- 330.8595
- Rent YoY
- ▲ 3.67%
- Metro
- Palm Bay-Melbourne-Titusville, FL
- State GDP YoY
- ▲ 3.28%
- F500 in state
- 36
Industry mix (Fortune 500 HQ in FL)
| Industry | F500 HQs | Revenue |
|---|---|---|
| Industrial Technology | 2 | $29B |
|
||
| Insurance | 2 | $17B |
|
||
| Retail | 1 | $60B |
|
||
| Technology Distribution | 1 | $58B |
|
||
| Homebuilding | 1 | $35B |
|
||
| Technology Manufacturing | 1 | $35B |
|
||
Price history
-85.4% since first listed26 events — show timeline
- 2026-05-22 Rental Removed $2,195 STELLARMLS
- 2026-05-01 Price Changed $394,999 Stellar MLS as Distributed by MLS Grid
- 2026-02-05 Price Changed $399,999 Stellar MLS as Distributed by MLS Grid
- 2026-01-31 Listed for Rent $2,195 STELLARMLS
- 2026-01-07 Listed $429,999 Stellar MLS as Distributed by MLS Grid
- 2024-02-07 Sold (MLS) $35,500 Stellar MLS as Distributed by MLS Grid
- 2024-01-29 Sold (MLS) $35,500 SCMLS
- 2024-01-03 Pending — Stellar MLS as Distributed by MLS Grid
- 2024-01-03 Pending — SCMLS
- 2023-12-08 Price Changed $38,500 SCMLS
- 2023-12-08 Price Changed $39,500 SCMLS
- 2023-11-20 Listed $38,500 SCMLS
- 2023-11-18 Listed $38,500 Stellar MLS as Distributed by MLS Grid
- 2022-01-10 Sold (MLS) $31,500 SCMLS
- 2021-12-08 Contingent — SCMLS
- 2021-12-01 Price Changed $33,000 SCMLS
- 2021-11-08 Listed $35,000 SCMLS
- 2020-09-18 Sold (MLS) $11,000 SCMLS
- 2020-08-28 Contingent — SCMLS
- 2019-10-28 Listed $11,000 SCMLS
- 2011-01-02 Listing Removed — MARMLS
- 2010-01-11 Listed $11,000 MARMLS
- 2004-09-28 Sold (Public Records) $23,500 Public Records
- 2004-09-10 Sold (MLS) $23,500 SCMLS
- 2004-08-02 Listed $25,000 SCMLS
- 2004-07-23 Sold (Public Records) $15,000 Public Records
Property tax history
+17.9%/yrLatest (2025): $585 · +10.5% YoY. Source: county tax records.
Cash-flow waterfall
monthlySold comps — $/sqft
last 12 mo · ≤1 miLoading sold comps…