 🏷️ Likely Rental
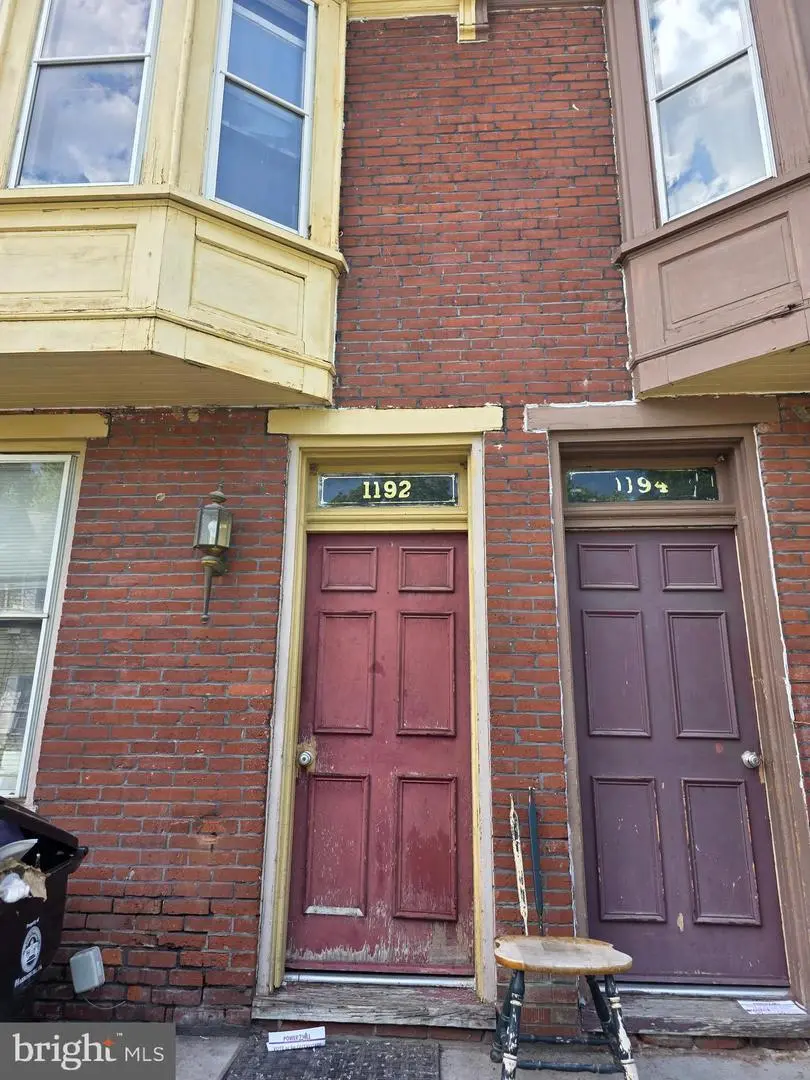
1192 Bailey St · Harrisburg, PA
Flood risk 1/10 · Minimal
- FEMA flood zone
- X (unshaded)
- Chance of flooding over 30 yrs
- 0.0%
- Est. flood insurance / yr
- $473 – $860
Fire risk 1/10 · Minimal
- Est. fire insurance / yr
- $511 – $949
Heat risk 5/10 · Moderate
- Hot days now (above 100°F)
- 7 days/yr
- Hot days in 30 yrs
- 15 days/yr
Wind risk 2/10 · Minimal
- Chance of severe wind over 30 yrs
- 5.0%
Air-quality risk 2/10 · Minimal
- Unhealthy air days now
- 1 days/yr
- Unhealthy air days in 30 yrs
- 3 days/yr
Risk factors via First Street. Map © Google.
Why this score? — see what drove the B- grade
The composite is a weighted blend of 9 inputs, each scored 0–100. Each bar is that input's sub-score; the figure is the points it added to the 100-point composite (weight × sub-score).
- Cash flow +26.2/30.0
- ARV discount +15.0/15.0
- DSCR +8.9/10.0
- 1% rule +7.2/10.0
- Rent growth +4.8/5.0
- Livability +4.2/5.0
- Condition / age +2.5/5.0
- Schools +0.8/10.0
- Appreciation +0.0/10.0
$120,000
🖨 Deal sheet 📄 Offer letter ✓ Due diligence
Listing remarks
Fully leased duplex located in Harrisburg City. 1st floor is a one bedroom one bath with access to the backyard. The 2nd floor has two bedrooms and one bath with washer and dryer. Both units are on a month to month lease. This duplex can be purchased as a package deal with 1190 Bailey St. Expand your portfolio and schedule a showing today.
Key facts
- Washer and dryer
- Fully leased duplex
- Built 1910
Tags
Property features AI
Finance
- Other: Improvement and land assessed separately
- Financial info: Two-unit property with both units leased month-to-month; All units currently leased
Exterior
- Parking: On-street parking
- Utilities: Public water; Public sewer; Electric hot water
- Home design: Interior townhouse/rowhouse; Fee simple ownership
- Construction: Brick construction; Brick/mortar foundation; Above-grade and below-grade structures; Estimated year built
- Exterior features: Ground rent paid annually; No tidal water
Interior
- Bedrooms: One 1-bedroom unit and one 2-bedroom unit (units total: 2)
- Heating & cooling: Baseboard electric heating; Multi-unit cooling
- Interior features: Basement present (other type)
- Laundry & utility: Laundry located on the upper floor
Neighborhood map
What this means for you Summary
Snapshot
- This is a 2-bed/1.0-bath single-family listed at $120k.
Deal economics
- At list price, monthly cash flow is $305 ($4k/yr) — positive.
- The deal already cash-flows at list — no discount required.
- Meets the 1% rule at list price ($1k rent vs $120k).
- Cap rate 9.3% vs local median 6.6% in Harrisburg — top-decile yield for the area; either an underpriced asset or a hidden risk that comps aren't pricing in. Stress-test before assuming the spread holds.
Location & tenants
- Location reads 84/100 on livability (#107 in PA, #826 nationally) — a professional / high-income tenant draw. Strengths: amenities A+, commute A+, cost of living A+; Watch: employment D, crime F.
- Harrisburg City SD (urban): math 6% / reading 13% proficiency, ranked #535 of 539 in PA (top 99%) — low school quality limits family demand, transient renter base, plan for 1-2y turnover; 82% free/reduced lunch — lower-income household profile, screen leases tightly.
- Zoned schools: Harrisburg Hs (math 24% / reading 10%, grade F, #399 of 437 statewide, top 92%, 1,230 students, 100% FRL) — zoned schools average 100% FRL vs 82% district-wide (18 pts higher); higher-poverty schools than district average — tighter screening recommended.
- Market conditions: Rents rising fast (+9.1%/yr); 66 active listings in the ZIP; 23 comparable units currently listed for rent nearby; rentals at typical pace (median 24d on market — plan ~3-4 weeks tenant-placement turnaround); 48% of comp listings sitting > 30 days — soft ceiling on asking rent; lower-income renter base — watch delinquency; 540 units permitted in Dauphin County in 2024 (194 in 5+ unit buildings).
- This rent runs 44% of the median local income ($40k/yr) — at the standard rent-burdened threshold; future hikes will face affordability resistance.
Forward outlook
- Local home prices are declining (-3.0%/yr); year-one equity from $830 of loan paydown is wiped out by about $4k of value loss. Plan a longer hold.
- At projected returns (-3.0% appreciation + 8.0% rent growth), your $34k cash investment doubles in ~7 years — after that, you're playing with house money.
Negotiation context
- Only 5 days on market — expect competitive offers; lowballing is unlikely to land.
- Current owner paid $36k; list at $120k implies a 233% gain — meaningful room to come down on a strong offer.
Risks & watch-outs
- Watch-outs: built in 1910 — expect roof / HVAC / electrical / plumbing capex.
- Climate carrying-cost: extreme-heat days projected 7→15/yr by 2055 (HVAC capex compounding) — expect insurance premiums to compound above CPI over the hold.
Questions for the listing agent
- Built in 1910 — when were the roof, HVAC, electrical panel, plumbing, and water heater last replaced?
- Is there a deadline driving the sale (1031 exchange, divorce, estate, relocation)? That informs how much negotiation room exists.
- Crime grade is F in this area — have there been break-ins, vandalism, or insurance claims at this property in the last 3 years? What carrier currently insures it and at what premium?
- What's the average days-on-market for RENTAL listings here right now (not sales)? A rising rental-DOM trend means longer vacancies and softer asking-rent achievability than the comps imply.
- What's the recent tenant-quality profile in this submarket — average credit score on applications, eviction rate, late-payment / NSF rate, and stable-employment percentage? A property-management company in the area should have these aggregated.
- How much new for-sale + rental construction is in the pipeline within 1–3 miles? Heavy new supply typically softens prices + rents 12–24 months out; constrained supply supports both.
Investment metrics
- 1% rule
- 1.22% ✓
- Cap rate
- 9.35%
- Cash-on-cash
- 10.90%
- DSCR
- 1.49
- GRM
- 6.8
CMA / ARV
- ARV (on-the-fly)
- $164,160
- Comps found
- 3
Show comp detail 3 sales within ~0.75 mi
| Address | Dist | Beds/Ba | Sqft | Sold | Price | $/sf | Match |
|---|---|---|---|---|---|---|---|
| 1521 Swatara St | 0.57mi | 2/1.5 | 1,590 (-13%) | 10mo | $99,900 | $63 | 42 |
| 901 Capital St | 0.67mi | 3/2.5 (+1) | 1,680 (-8%) | 7mo | $207,500 | $124 | 39 |
| 1900 Walnut St | 0.70mi | 3/2.5 (+1) | 2,059 (+13%) | 17mo | $185,000 | $90 | 21 |
Match score weights: distance 35% · size 25% · config 20% · recency 20%. Top-matched comps best support the ARV.
Projected returns pro-forma
-3.0% appreciation · 8.0% rent growth · sell at horizon
- IRR
- 5.6%
- Equity multiple
- 1.23×
- Total profit
- $7,768
- Equity at exit
- $17,892
- IRR
- 19.2%
- Equity multiple
- 3.00×
- Total profit
- $67,139
- Equity at exit
- $10,375
Cash invested: $33,600 (down + closing). Projections, not guarantees.
Landlord ↔ Tenant lean methodology
- Overall (STATE)
- 62 Landlord-Friendly
- State Pennsylvania
- 62 Landlord-Friendly · EVEN
- County
- — inherits STATE
- City
- — inherits STATE
ZIP-level market 17103
- Rents YoY
- 9.1%
- Active inventory
- 66
- Price-to-rent
- 6.8×
Monthly cashflow live
- Estimated rent
- $1,463 high interval (Pro) →
- Mortgage (P&I)
- −$629
- Tax from tax record
- −$171 /mo · $2,056/yr
- Insurance
- −$50
- HOA
- −$0
- Vacancy / Maint / Mgmt
- −$307
- Net cashflow
- $305
Break-even live
UW: 25.0% down · 7.5% · 30yr · 1.5% tax · 5.0% vac · 8.0% maint · 8.0% mgmt
Financing live
Cash to close
- Down payment
- $30,000
- Closing costs
- $3,600
- Reserves months
- —
- Total cash needed
- —
Loan-product check · same deal, 3 products live
Conventional
25% down · 7.5% · 30yr
- Down + closing
- —
- Monthly P&I
- —
- Monthly cashflow
- —
- DSCR
- —
- Eligible?
- —
Personal DTI + credit; lowest rate.
DSCR
20% down · 8.5% · 30yr
- Down + closing
- —
- Monthly P&I
- —
- Monthly cashflow
- —
- DSCR
- —
- Eligible?
- —
No personal income docs; deal must DSCR.
Hard money
10% down · 12.0% · 12mo
- Down + closing
- —
- Monthly P&I
- —
- Monthly cashflow
- —
- DSCR
- —
- Eligible?
- —
Short-term bridge; refi at stabilization.
Rent comps 23 comps
| Address | Beds | Baths | Sqft | Rent | $/sqft | DOM | Units | Dist |
|---|---|---|---|---|---|---|---|---|
| 52 Balm St Harrisburg, PA | 3.0 | 1.0 | 1950 | $1,495 | $0.77 | 21d | 1 | 0.08mi |
| 331 Hummel St Unit A Harrisburg, PA | 2.0 | 1.0 | 1590 | $1,400 | $0.88 | 43d | 1 | 0.43mi |
| 331 Hummel St Unit B Harrisburg, PA | 3.0 | 1.0 | 1590 | $1,800 | $1.13 | 43d | 1 | 0.43mi |
| 349 S 14th St Harrisburg, PA | 3.0 | 1.0 | 1544 | $1,450 | $0.94 | 23d | 1 | 0.49mi |
| 301 Chestnut St Harrisburg, PA | 4.0 | 1.0–2.5 | 1437 | $2,050 | $1.43 | 14d | 10 | 0.52mi |
| 301 Chestnut St Harrisburg, PA | 1.0–4.0 | 1.0–2.5 | 1437 | $1,593 | $1.11 | 43d | 1 | 0.52mi |
| 337 S 15th St Harrisburg, PA | 3.0 | 1.0 | 1440 | $1,195 | $0.83 | 21d | 1 | 0.52mi |
| 1429 Naudain St Harrisburg, PA | 3.0 | 1.0 | 1254 | $1,400 | $1.12 | 23d | 1 | 0.67mi |
| 513 N 2nd St Unit 1 Harrisburg, PA | 1.0 | 1.0 | 1300 | $1,900 | $1.46 | 43d | 1 | 0.77mi |
| 122 State St Apt 2 Harrisburg, PA | 2.0 | 1.0 | 1250 | $1,725 | $1.38 | 14d | 1 | 0.80mi |
| 711 N 2nd St Apt 2 Harrisburg, PA | 2.0 | 1.0 | 1400 | $1,595 | $1.14 | 43d | 1 | 0.81mi |
| 321 N Front St Unit 102 Harrisburg, PA | 2.0 | 2.5 | 1562 | $2,395 | $1.53 | 43d | 1 | 0.81mi |
| 919 Penn St Harrisburg, PA | 3.0 | 2.0 | 1458 | $1,795 | $1.23 | 23d | 1 | 0.83mi |
| 2016 Swatara St Harrisburg, PA | 3.0 | 1.0 | 1380 | $1,175 | $0.85 | 43d | 1 | 0.91mi |
| 1008 N 2nd St Unit 2 Harrisburg, PA | 2.0 | 1.0 | 1410 | $1,295 | $0.92 | 43d | 1 | 0.92mi |
| 1728 Paxton St Harrisburg, PA | 3.0 | 1.5 | 1320 | $1,295 | $0.98 | 14d | 1 | 1.09mi |
| 644 Kelker St Harrisburg, PA | 3.0 | 1.0 | 1294 | $1,295 | $1.00 | 43d | 1 | 1.10mi |
| 640 Kelker St Harrisburg, PA | 3.0 | 1.0 | 1294 | $1,650 | $1.28 | 43d | 1 | 1.10mi |
| 1841 N 4th St Harrisburg, PA | 3.0 | 1.0 | 1376 | $1,399 | $1.02 | 23d | 1 | 1.26mi |
| 1841 N 3rd St Harrisburg, PA | 3.0 | 1.0 | 1376 | $1,399 | $1.02 | 14d | 1 | 1.30mi |
| 649 S 23rd St Unit 1 Harrisburg, PA | 3.0 | 1.0 | 1450 | $1,465 | $1.01 | 43d | 1 | 1.38mi |
| 649 S 23rd St Harrisburg, PA | 3.0 | 1.0 | 1450 | $1,465 | $1.01 | 21d | 1 | 1.38mi |
| 320 Maclay St Harrisburg, PA | 3.0 | 2.5 | 2237 | $1,750 | $0.78 | 14d | 1 | 1.48mi |
Listing history 7 events
-
2026-06-19status $120,000 Pending 5 DOM
-
2026-06-18days on market $120,000 Active 5 DOM
-
2026-06-17days on market $120,000 Active 4 DOM
-
2026-06-16days on market $120,000 Active 3 DOM
-
2026-06-15days on market $120,000 Active 2 DOM
-
2026-06-14remarks 341-char remark
-
2026-06-14$120,000 Active 1 DOM
ⓘ Source: listings_history table (triggers on properties + properties_extension) + one-shot
backfill from property_details.listing_events for pre-trigger history.
Tax reassessment forecast PA · Partial reset (capped growth)
- Current annual tax
- $2,056 · $171/mo
- Projected year-2 tax
- $2,056 · $171/mo
- Expected delta
- $0/yr ($0/mo · 0.0%)
ⓘ Screening estimate from a state-policy table — verify with the county assessor before closing.
Climate risk First Street
- Flood 1/10 Low FEMA zone X (unshaded) · 0% chance over 30 yrs
- Wildfire 1/10 Low
- Heat 5/10 Major 7 d/yr ≥100°F today · 15 d/yr by 30 yrs out
- Wind 2/10 Low 5% chance of damaging wind over 30 yrs
- Air quality 2/10 Low 1 unhealthy d/yr today · 3 by 30 yrs out
Nearby sold comps map
Loading sold comps map…
Walkable amenities ~0.75 mi
Loading nearby amenities…
Taxation est. · year 1
- Rental income
- $17,558
- − Mortgage interest
- −$6,722
- − Property taxes
- −$2,056
- − Insurance
- −$600
- − Repairs & maintenance
- −$1,405
- − Management
- −$1,405
- − Depreciation
- −$3,491
- Taxable income
- $1,880
- Est. tax owed @ 24.0%
- −$451
- After-tax cash flow
- $3,212/yr
For passive investors: Depreciation is non-cash, so a rental often shows a tax loss while cash-flowing — sheltering income. Rental losses are passive: they offset passive income freely, and up to $25,000/yr can offset ordinary (W-2) income if you actively participate and your MAGI is under $100k (phasing out to $0 by $150k); unused losses carry forward. On sale, claimed depreciation is recaptured at up to 25%, and gains may owe capital-gains tax (a 1031 exchange can defer both). Figures are a year-1 estimate at your 24.0% rate — not tax advice; consult a CPA.
Schools (NCES district)
- District
- Harrisburg City SD
- NCES district ID
- 4211580
- Math proficiency
- 6% ▼ -6.00%
- Reading proficiency
- 13% ▼ -10.00%
- Median HH income
- $33,432
- Composite
- 7.6/100
- National rank
- #9945
- State rank
- #535 of 539 in PA
Livability — Harrisburg
- Score
- 84/100
- State rank
- #107
- US rank
- #826
Category grades
Schools grade is shown separately in the Schools card above.
Census & demographics
- Census place
- Harrisburg, PA
- County
- Dauphin County · 247,857 people
- City population
- 184,296
- Metro
- Harrisburg-Carlisle, PA
- Population (ZIP)
- 13,115
- Household income
- $39,825
- Rent vs Own
- Severe rent burden
- 1014.0
Population outlook (Dauphin County) Hauer SSP2
- Today (2025)
- 281,628 people
- By 2030
- 283,549 · +0.7%
- By 2040
- 285,385 · +1.3%
- By 2050
- 286,188 · +1.6%
- By 2075
- 291,053 · +3.3%
- By 2100
- 282,374 · +0.3%
Race, ethnicity, and origin ACS 2023
- Neighborhood character
- Diverse neighborhood (Simpson 0.66)
- Race & ethnicity
- Black 47% Hispanic / Latino 31% White 18% Two or more races 10%
- Hispanic origin (detail)
- Mexican 4% Puerto Rican 18% Dominican 5%
- Common ancestry
- Hispanic 1% Romanian 1% Italian 1%
- Foreign-born
- 9% · Canada
- Languages at home
- 83% English-only · Spanish 11% French/Haitian/Cajun 2% Tagalog/Filipino 1%
Political lean MEDSL · Dauphin
- 2024 margin
- Lean D (+5.9) · D 52.4% · R 46.5% · Other 1.1%
- 2008→2024 swing
- -3.1pp toward R · 2008: 9.1pp · 2024: 5.9pp
- All cycles
- 2024: D+5.9 2020: D+8.5 2016: D+2.8 2012: D+6.0 2008: D+9.1
Not yet ingested
- Civics
- —
Market trends
- HPI YoY
- ▼ -119.52%
- Current HPI
- 211.455
- Rent YoY
- ▲ 9.09%
- Metro
- Harrisburg-Carlisle, PA
- State GDP YoY
- ▲ 1.68%
- F500 in state
- 34
Industry mix (Fortune 500 HQ in PA)
| Industry | F500 HQs | Revenue |
|---|---|---|
| Healthcare | 2 | $309B |
|
||
| Insurance | 2 | $27B |
|
||
| Telecommunications / Media | 1 | $124B |
|
||
| Industrial Distribution | 1 | $22B |
|
||
| Financial Services | 1 | $20B |
|
||
| Chemicals / Materials | 1 | $18B |
|
||
Price history
+233.3% since first listed2 events — show timeline
- 2026-06-13 Listed $120,000 BRIGHT MLS
- 1998-06-04 Sold (Public Records) $36,000 Public Records
Property tax history
+0.9%/yrLatest (2026): $2,056 · +1.6% YoY. Source: county tax records.
Cash-flow waterfall
monthlySold comps — $/sqft
last 12 mo · ≤1 miLoading sold comps…