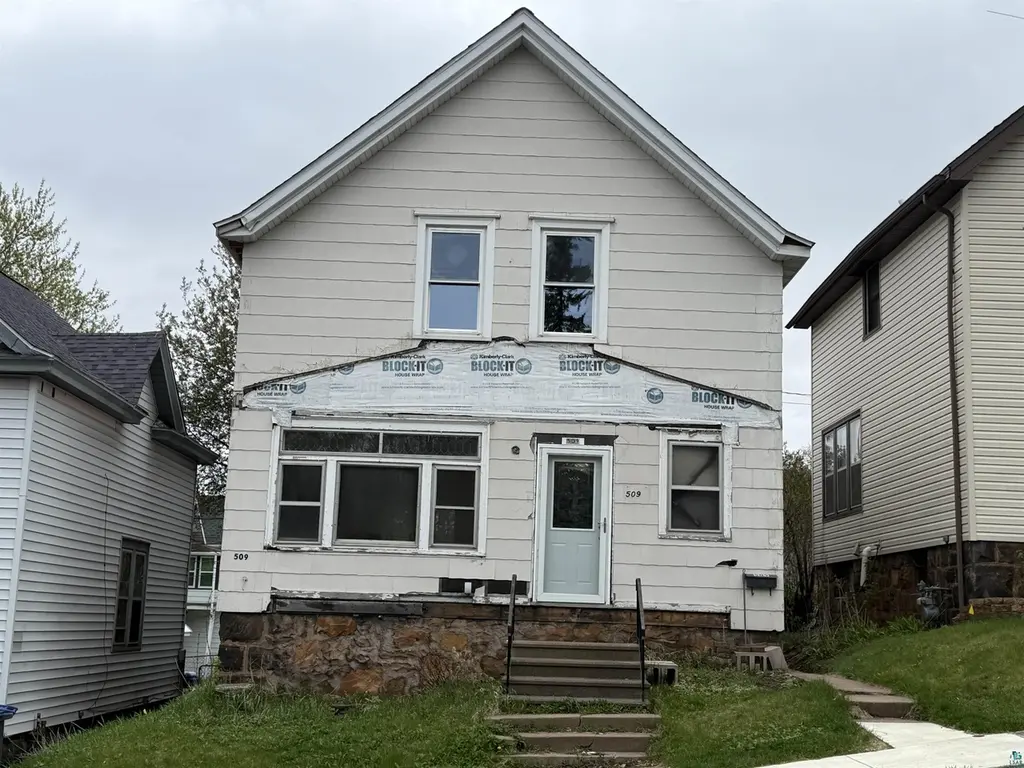
509 N 21st Ave Ave W · Duluth, MN
Flood risk 1/10 · Minimal
- FEMA flood zone
- X
- Chance of flooding over 30 yrs
- 0.0%
- Est. flood insurance / yr
- $473 – $860
Fire risk 2/10 · Minimal
- Est. fire insurance / yr
- $888 – $1,650
Heat risk 2/10 · Minimal
- Hot days now (above 92°F)
- 7 days/yr
- Hot days in 30 yrs
- 13 days/yr
Wind risk 1/10 · Minimal
- Chance of severe wind over 30 yrs
- —
Air-quality risk 2/10 · Minimal
- Unhealthy air days now
- 0 days/yr
- Unhealthy air days in 30 yrs
- 1 days/yr
Risk factors via First Street. Map © Google.
Why this score? — see what drove the B+ grade
The composite is a weighted blend of 9 inputs, each scored 0–100. Each bar is that input's sub-score; the figure is the points it added to the 100-point composite (weight × sub-score).
- Cash flow +30.0/30.0
- ARV discount +15.0/15.0
- 1% rule +10.0/10.0
- DSCR +10.0/10.0
- Schools +4.2/10.0
- Livability +4.1/5.0
- Rent growth +2.5/5.0
- Condition / age +2.5/5.0
- Appreciation +0.0/10.0
$120,000
🖨 Deal sheet 📄 Offer letter ✓ Due diligence
Listing remarks MLS
A spacious & well maintained home up on the hill w/ a bay & panoramic view from the second story deck. The kitchen has been updated- cabinets, sink, breakfast bar and a Jenn-Aire grill/rotisserie. All of the bedrooms are nice size w/ good size closets. Th
Key facts
- New plumbing
- Newer roof
- Central a/c
Tags
Property features AI
Exterior
- Parking: On-street parking
- Utilities: Public water; Public sewer
- Home design: Single-family detached residence; Single-story
- Construction: Stone foundation; Built as a residential single-family home
- Exterior features: Asphalt shingle roof; City street frontage; Lot dimensions approximately 33 x 75
Interior
- Kitchen: Range; Refrigerator
- Bathrooms: 1 full bathroom; 1 quarter bathroom
- Heating & cooling: Forced air heating (natural gas); Central air conditioning
- Interior features: Wood window frames; Full basement
- Laundry & utility: Washer; Dryer
Neighborhood map
What this means for you Summary
Snapshot
- This is a 3-bed/1.0-bath single-family listed at $120k.
Deal economics
- At list price, monthly cash flow is $740 ($9k/yr) — positive.
- The deal already cash-flows at list — no discount required.
- Meets the 1% rule at list price ($2k rent vs $120k).
- Cap rate 13.7% vs local median 4.9% in Duluth — top-decile yield for the area; either an underpriced asset or a hidden risk that comps aren't pricing in. Stress-test before assuming the spread holds.
Location & tenants
- Location reads 82/100 on livability (#36 in MN, #1,060 nationally) — a professional / high-income tenant draw. Strengths: commute A+, cost of living A+, housing A+; Watch: amenities F.
- Duluth Public School District (urban): math 44% / reading 55% proficiency, ranked #132 of 301 in MN (top 44%) — families likely to look elsewhere, expect single-tenant / working-renter base with shorter leases.
- Market conditions: 44 active listings in the ZIP; 9 comparable units currently listed for rent nearby; rentals lingering (median 44d on market — plan ~5-8 weeks vacancy on turnover, expect pricing pressure); 56% of comp listings sitting > 30 days — soft ceiling on asking rent; lower-income renter base — watch delinquency; 639 units permitted in St. Louis County in 2024 (338 in 5+ unit buildings).
- At $1,943/mo this rent would consume 54% of the median local household income ($43k/yr) (locally 506% of renters already pay >50% of income on rent) — very limited rent-growth headroom before tenants either downsize or default.
Forward outlook
- Local home prices are declining (-3.0%/yr); year-one equity from $830 of loan paydown is wiped out by about $4k of value loss. Plan a longer hold.
- At projected returns (-3.0% appreciation + 3.0% rent growth), your $34k cash investment doubles in ~5 years — after that, you're playing with house money.
Negotiation context
- Only 12 days on market — expect competitive offers; lowballing is unlikely to land.
- 5 sale attempts since 19y ago with the ask held roughly flat each time — persistent listings suggest the price (not the market) is what's stuck; bring a comps-based counter.
- Current owner paid $75k; list at $120k implies a 60% gain — meaningful room to come down on a strong offer.
Risks & watch-outs
- Watch-outs: built in 1909 — expect roof / HVAC / electrical / plumbing capex.
Questions for the listing agent
- Built in 1909 — when were the roof, HVAC, electrical panel, plumbing, and water heater last replaced?
- Is there a deadline driving the sale (1031 exchange, divorce, estate, relocation)? That informs how much negotiation room exists.
- Schools are B-rated — typically a magnet for longer-tenancy family renters. What's the average tenant stay here, and is there a school-zone premium baked into asking?
- What's the average days-on-market for RENTAL listings here right now (not sales)? A rising rental-DOM trend means longer vacancies and softer asking-rent achievability than the comps imply.
- What's the recent tenant-quality profile in this submarket — average credit score on applications, eviction rate, late-payment / NSF rate, and stable-employment percentage? A property-management company in the area should have these aggregated.
- How much new for-sale + rental construction is in the pipeline within 1–3 miles? Heavy new supply typically softens prices + rents 12–24 months out; constrained supply supports both.
Investment metrics
- 1% rule
- 1.62% ✓
- Cap rate
- 13.69%
- Cash-on-cash
- 26.41%
- DSCR
- 2.18
- GRM
- 5.1
CMA / ARV
- ARV (on-the-fly)
- $178,752
- Comps found
- 12
Show comp detail 12 sales within ~0.75 mi
| Address | Dist | Beds/Ba | Sqft | Sold | Price | $/sf | Match |
|---|---|---|---|---|---|---|---|
| 2229 W 7th St | 0.20mi | 3/1.0 | 1,209 (+3%) | 3mo | $177,500 | $147 | 83 |
| 517 N 22nd Ave Ave W | 0.09mi | 3/2.0 | 1,248 (+6%) | 1mo | $131,000 | $105 | 81 |
| 314 N 19th Ave W | 0.24mi | 3/1.0 | 1,208 (+3%) | 9mo | $182,000 | $151 | 77 |
| 1721 W 2nd St | 0.38mi | 2/1.5 (-1) | 1,164 (-1%) | 12mo | $230,000 | $198 | 64 |
| 2203 W 2nd St | 0.24mi | 3/1.0 | 1,326 (+13%) | 6mo | $150,000 | $113 | 63 |
| 2326 W 2nd St | 0.34mi | 3/1.0 | 1,352 (+15%) | 0mo | $180,000 | $133 | 59 |
| 520 Winnipeg Ave | 0.56mi | 3/1.5 | 1,121 (-5%) | 6mo | $190,000 | $169 | 59 |
| 2208 W 8th St | 0.20mi | 2/2.0 (-1) | 1,348 (+15%) | 0mo | $205,000 | $152 | 57 |
| 2629 W 2nd St | 0.55mi | 3/1.5 | 1,292 (+10%) | 0mo | $110,000 | $85 | 56 |
| 2723 W 4th St | 0.58mi | 3/2.0 | 1,248 (+6%) | 12mo | $230,000 | $184 | 48 |
| 2626 W 5th St | 0.50mi | 3/1.5 | 1,336 (+14%) | 11mo | $209,000 | $156 | 43 |
| 518 Winnipeg Ave | 0.57mi | 2/1.0 (-1) | 1,047 (-11%) | 11mo | $175,000 | $167 | 41 |
Match score weights: distance 35% · size 25% · config 20% · recency 20%. Top-matched comps best support the ARV.
Projected returns pro-forma
-3.0% appreciation · 3.0% rent growth · sell at horizon
- IRR
- 20.2%
- Equity multiple
- 1.82×
- Total profit
- $27,664
- Equity at exit
- $17,892
- IRR
- 28.4%
- Equity multiple
- 3.52×
- Total profit
- $84,774
- Equity at exit
- $10,375
Cash invested: $33,600 (down + closing). Projections, not guarantees.
Landlord ↔ Tenant lean methodology
- Overall (STATE)
- 46 Balanced
- State Minnesota
- 46 Balanced · D+2
- County
- — inherits STATE
- City
- — inherits STATE
ZIP-level market 55806
- Active inventory
- 44
- Price-to-rent
- 5.1×
Monthly cashflow live
- Estimated rent
- $1,943 high interval (Pro) →
- Mortgage (P&I)
- −$629
- Tax from tax record
- −$116 /mo · $1,398/yr
- Insurance
- −$50
- HOA
- −$0
- Vacancy / Maint / Mgmt
- −$408
- Net cashflow
- $740
Break-even live
UW: 25.0% down · 7.5% · 30yr · 1.5% tax · 5.0% vac · 8.0% maint · 8.0% mgmt
Financing live
Cash to close
- Down payment
- $30,000
- Closing costs
- $3,600
- Reserves months
- —
- Total cash needed
- —
Loan-product check · same deal, 3 products live
Conventional
25% down · 7.5% · 30yr
- Down + closing
- —
- Monthly P&I
- —
- Monthly cashflow
- —
- DSCR
- —
- Eligible?
- —
Personal DTI + credit; lowest rate.
DSCR
20% down · 8.5% · 30yr
- Down + closing
- —
- Monthly P&I
- —
- Monthly cashflow
- —
- DSCR
- —
- Eligible?
- —
No personal income docs; deal must DSCR.
Hard money
10% down · 12.0% · 12mo
- Down + closing
- —
- Monthly P&I
- —
- Monthly cashflow
- —
- DSCR
- —
- Eligible?
- —
Short-term bridge; refi at stabilization.
Rent comps 9 comps
| Address | Beds | Baths | Sqft | Rent | $/sqft | DOM | Units | Dist |
|---|---|---|---|---|---|---|---|---|
| 2011 W Superior St Duluth, MN | 2.0 | 1.0–2.0 | 670 | $1,844 | $2.75 | 13d | 12 | 0.34mi |
| 1302 W 1st St Apt 1 Duluth, MN | 2.0 | 1.0 | 942 | $1,275 | $1.35 | 43d | 1 | 0.76mi |
| 1302 W 1st St Apt 2 Duluth, MN | 2.0 | 1.0 | 942 | $1,300 | $1.38 | 43d | 1 | 0.76mi |
| 1125 Glen Place Dr Unit A05 Duluth, MN | 2.0 | 1.0 | 788 | $1,395 | $1.77 | 43d | 1 | 0.90mi |
| 1115 W Michigan St Duluth, MN | 2.0 | 1.0 | 600 | $1,395 | $2.33 | 43d | 3 | 0.93mi |
| 2302 Hillcrest Dr Duluth, MN | 3.0 | 1.5 | 1072 | $3,500 | $3.26 | 43d | 1 | 1.11mi |
| 521 W 2nd St Duluth, MN | 2.0 | 1.0 | 592 | $1,600 | $2.70 | 13d | 2 | 1.40mi |
| 100 N 5th Ave W Duluth, MN | 3.0 | 1.0–2.0 | 1209 | $3,299 | $2.73 | 21d | 7 | 1.45mi |
| 100 N 5th Ave W Duluth, MN | 3.0 | 1.0–2.0 | 1207 | $3,999 | $3.31 | 13d | 1 | 1.45mi |
Listing history 10 events
-
2026-06-01days on market $120,000 Active 12 DOM
-
2026-05-31days on market $120,000 Active 11 DOM
-
2026-05-30days on market $120,000 Active 10 DOM
-
2026-05-20$120,000 Active
-
2009-06-10soldstatus $75,000
-
2009-06-01soldstatus $75,000 267-char remark
Show marketing remark (267 chars)
A spacious & well maintained home up on the hill w/ a bay & panoramic view from the second story deck. The kitchen has been updated- cabinets, sink, breakfast bar and a Jenn-Aire grill/rotisserie. All of the bedrooms are nice size w/ good size closets. Th
-
2008-09-24$79,900 267-char remark
Show marketing remark (267 chars)
A spacious & well maintained home up on the hill w/ a bay & panoramic view from the second story deck. The kitchen has been updated- cabinets, sink, breakfast bar and a Jenn-Aire grill/rotisserie. All of the bedrooms are nice size w/ good size closets. Th
-
2008-01-21$79,900
-
2008-01-04$86,900
-
2007-08-07$89,900
ⓘ Source: listings_history table (triggers on properties + properties_extension) + one-shot
backfill from property_details.listing_events for pre-trigger history.
Tax reassessment forecast MN · Partial reset (capped growth)
- Current annual tax
- $1,398 · $116/mo
- Projected year-2 tax
- $1,398 · $116/mo
- Expected delta
- $0/yr ($0/mo · 0.0%)
ⓘ Screening estimate from a state-policy table — verify with the county assessor before closing.
Climate risk First Street
- Flood 1/10 Low FEMA zone X · 0% chance over 30 yrs
- Wildfire 2/10 Low
- Heat 2/10 Low 7 d/yr ≥92°F today · 13 d/yr by 30 yrs out
- Wind 1/10 Low
- Air quality 2/10 Low 0 unhealthy d/yr today · 1 by 30 yrs out
Nearby sold comps map
Loading sold comps map…
Walkable amenities ~0.75 mi
Loading nearby amenities…
Taxation est. · year 1
- Rental income
- $23,321
- − Mortgage interest
- −$6,722
- − Property taxes
- −$1,398
- − Insurance
- −$600
- − Repairs & maintenance
- −$1,866
- − Management
- −$1,866
- − Depreciation
- −$3,491
- Taxable income
- $7,379
- Est. tax owed @ 24.0%
- −$1,771
- After-tax cash flow
- $7,103/yr
For passive investors: Depreciation is non-cash, so a rental often shows a tax loss while cash-flowing — sheltering income. Rental losses are passive: they offset passive income freely, and up to $25,000/yr can offset ordinary (W-2) income if you actively participate and your MAGI is under $100k (phasing out to $0 by $150k); unused losses carry forward. On sale, claimed depreciation is recaptured at up to 25%, and gains may owe capital-gains tax (a 1031 exchange can defer both). Figures are a year-1 estimate at your 24.0% rate — not tax advice; consult a CPA.
Schools (NCES district)
- District
- Duluth Public School District
- NCES district ID
- 2711040
- Math proficiency
- 44% ▼ -10.00%
- Reading proficiency
- 55% ▼ -6.00%
- Median HH income
- $45,692
- Composite
- 41.92/100
- National rank
- #3360
- State rank
- #132 of 301 in MN
Livability — Duluth
- Score
- 82/100
- State rank
- #36
- US rank
- #1060
Category grades
Schools grade is shown separately in the Schools card above.
Census & demographics
- Census place
- Duluth, MN
- County
- Saint Louis County · 115,152 people
- City population
- 71,097
- Metro
- Duluth, MN-WI
- Population (ZIP)
- 9,356
- Household income
- $42,833
- Rent vs Own
- Severe rent burden
- 506.0
Population outlook (St. Louis County) Hauer SSP2
- Today (2025)
- 202,411 people
- By 2030
- 203,234 · +0.4%
- By 2040
- 202,520 · +0.1%
- By 2050
- 200,853 · -0.8%
- By 2075
- 200,943 · -0.7%
- By 2100
- 192,058 · -5.1%
Race, ethnicity, and origin ACS 2023
- Neighborhood character
- Predominantly White (79%)
- Race & ethnicity
- White 79% Two or more races 7% Black 7% Native American 5% Hispanic / Latino 3% Asian 1%
- Common ancestry
- Portuguese 10% Romanian 5% Scottish 2%
- Foreign-born
- 4% · Canada, China
- Languages at home
- 93% English-only · Other Indo-European 2% Spanish 2% Chinese 1%
Political lean MEDSL · St. Louis
- 2024 margin
- D (+13.7) · D 55.9% · R 42.2% · Other 1.8%
- 2008→2024 swing
- -18.8pp toward R · 2008: 32.5pp · 2024: 13.7pp
- All cycles
- 2024: D+13.7 2020: D+15.6 2016: D+11.8 2012: D+29.6 2008: D+32.5
Not yet ingested
- Civics
- —
Market trends
- HPI YoY
- ▼ -122.85%
- Current HPI
- 195.9805
- Rent YoY
- —
- Metro
- Duluth, MN-WI
- State GDP YoY
- ▲ 2.41%
- F500 in state
- 34
Industry mix (Fortune 500 HQ in MN)
| Industry | F500 HQs | Revenue |
|---|---|---|
| Healthcare | 2 | $407B |
|
||
| Retail | 2 | $150B |
|
||
| Consumer Goods | 2 | $32B |
|
||
| Industrial Machinery | 2 | $6B |
|
||
| Agriculture | 1 | $40B |
|
||
| Healthcare / Medical Devices | 1 | $32B |
|
||
Price history
+33.5% since first listed7 events — show timeline
- 2026-05-20 Listed $120,000 LSAR
- 2009-06-10 Sold (Public Records) $75,000 Public Records
- 2009-06-01 Sold (MLS) $75,000 NORTHSTARMLS as Distributed by MLS Grid
- 2008-09-24 Listed $79,900 NORTHSTARMLS as Distributed by MLS Grid
- 2008-01-21 Listed $79,900 NORTHSTARMLS as Distributed by MLS Grid
- 2008-01-04 Listed $86,900 NORTHSTARMLS as Distributed by MLS Grid
- 2007-08-07 Listed $89,900 NORTHSTARMLS as Distributed by MLS Grid
Property tax history
+6.8%/yrLatest (2025): $1,398 · +1.9% YoY. Source: county tax records.
Cash-flow waterfall
monthlySold comps — $/sqft
last 12 mo · ≤1 miLoading sold comps…