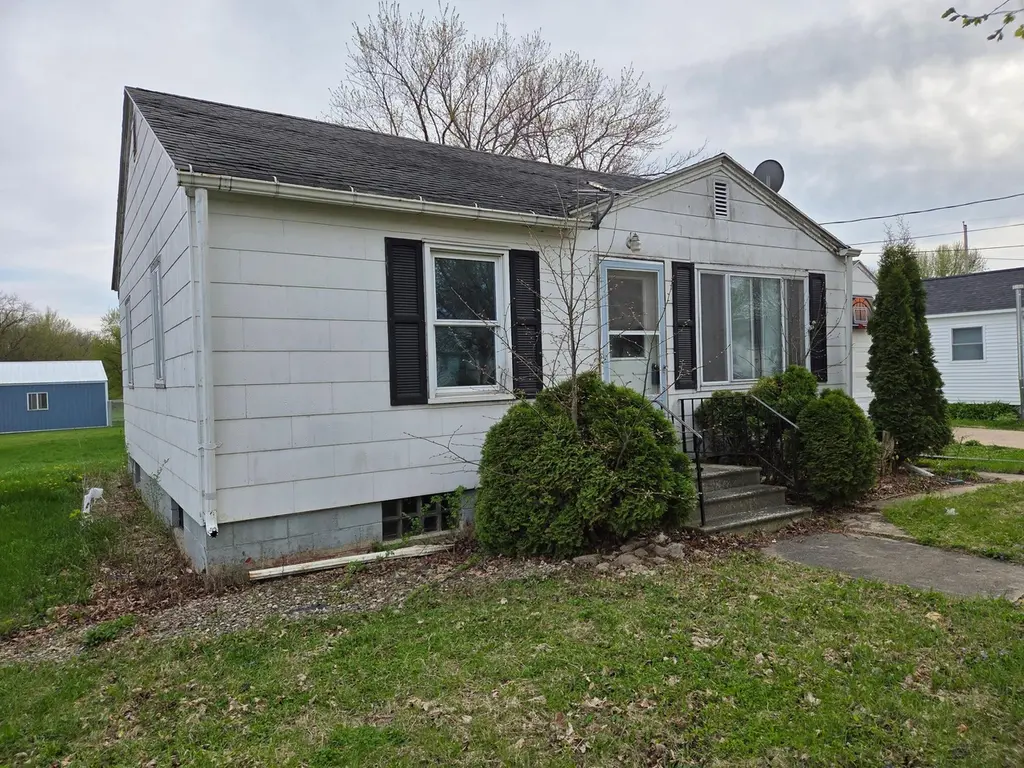
404 SE Pleasant St · Brownsdale, MN
Flood risk 1/10 · Minimal
- FEMA flood zone
- X (unshaded)
- Chance of flooding over 30 yrs
- 0.0%
- Est. flood insurance / yr
- $473 – $860
Fire risk 1/10 · Minimal
- Est. fire insurance / yr
- $888 – $1,650
Heat risk 1/10 · Minimal
- Hot days now (above 98°F)
- 7 days/yr
- Hot days in 30 yrs
- 16 days/yr
Wind risk 2/10 · Minimal
- Chance of severe wind over 30 yrs
- —
Air-quality risk 1/10 · Minimal
- Unhealthy air days now
- 0 days/yr
- Unhealthy air days in 30 yrs
- 0 days/yr
Risk factors via First Street. Map © Google.
Why this score? — see what drove the B+ grade
The composite is a weighted blend of 9 inputs, each scored 0–100. Each bar is that input's sub-score; the figure is the points it added to the 100-point composite (weight × sub-score).
- Cash flow +30.0/30.0
- 1% rule +10.0/10.0
- DSCR +10.0/10.0
- Appreciation +9.1/10.0
- ARV discount +7.5/15.0
- Livability +3.2/5.0
- Schools +3.0/10.0
- Rent growth +2.5/5.0
- Condition / age +2.5/5.0
$45,000
🖨 Deal sheet (PDF) 📄 Offer letter ✓ Due diligence
Listing remarks
This two-bedroom bungalow presents a promising investment opportunity for the right buyer. While the home requires renovation and updates, it offers substantial potential for improvement and value addition. Includes an attached garage, providing convenient parking and storage options. Located on an attractive lot, enhancing its appeal and future possibilities. The property is being sold as-is.
Key facts
- Attached garage
- Requires renovation
- Attractive lot
Tags
Property features AI
Exterior
- Parking: Attached garage (1-car, approximately 20x14)
- Utilities: City water connected; City sewer connected; Natural gas
- Home design: Residential property; One story; Main entry on main level
- Construction: Frame construction; Asphalt pitched roof
- Exterior features: Storage shed; City street frontage; Publicly maintained road access
Interior
- Kitchen: Kitchen integrated with dining area
- Bedrooms: 2 bedrooms on the main level
- Bathrooms: 1 full bathroom on the main level
- Heating & cooling: Forced air heating; Central air conditioning
- Interior features: Full unfinished basement with block foundation; Kitchen/dining room combo; Breezeway
Neighborhood map
What this means for you Summary
Snapshot
- This is a 2-bed/1.0-bath other listed at $45k.
Deal economics
- At list price, monthly cash flow is $299 ($4k/yr) — positive.
- The deal already cash-flows at list — no discount required.
- Meets the 1% rule at list price ($818 rent vs $45k).
- Recommended offer: $44k (3.0% below list) — sets the bar for market timing.
Location & tenants
- Location reads 65/100 on livability (#558 in MN) — a middle-class / working-renter tenant base. Strengths: cost of living A+, housing A+; Watch: schools D+, crime D+, amenities F.
- Hayfield Public School District (rural): math 29% / reading 38% proficiency, ranked #254 of 301 in MN (top 84%) — families likely to look elsewhere, expect single-tenant / working-renter base with shorter leases.
- Market conditions: 5 active listings in the ZIP; 53 units permitted in Mower County in 2024 (0 in 5+ unit buildings).
Forward outlook
- In year one you build about $4k of equity ($311 loan paydown + $4k appreciation (8.3% local appreciation)).
- At projected returns (8.3% appreciation + 3.0% rent growth), your $13k cash investment doubles in ~2 years — after that, you're playing with house money.
- By year 8, paydown + projected appreciation supports a ~$33k cash-out refi (75% LTV) — recoverable capital for the next deal without selling this one.
Negotiation context
- It's been on market 37 days — a 3% lower offer ($44k) is reasonable based on typical stale-listing flexibility.
Risks & watch-outs
- Watch-outs: built in 1946 — expect roof / HVAC / electrical / plumbing capex.
Questions for the listing agent
- It's been on market 37 days. Have you received any prior offers? Is the seller open to a 3% concession, seller financing, or rate buy-down credit?
- Built in 1946 — when were the roof, HVAC, electrical panel, plumbing, and water heater last replaced?
- Is there a deadline driving the sale (1031 exchange, divorce, estate, relocation)? That informs how much negotiation room exists.
- Schools are D-rated, which usually means shorter tenancies and higher turnover. Who's the typical renter profile here, and what's been the actual vacancy rate?
- Crime grade is D in this area — have there been break-ins, vandalism, or insurance claims at this property in the last 3 years? What carrier currently insures it and at what premium?
- What's the average days-on-market for RENTAL listings here right now (not sales)? A rising rental-DOM trend means longer vacancies and softer asking-rent achievability than the comps imply.
- What's the recent tenant-quality profile in this submarket — average credit score on applications, eviction rate, late-payment / NSF rate, and stable-employment percentage? A property-management company in the area should have these aggregated.
- How much new for-sale + rental construction is in the pipeline within 1–3 miles? Heavy new supply typically softens prices + rents 12–24 months out; constrained supply supports both.
Investment metrics
- 1% rule
- 1.82% ✓
- Cap rate
- 14.27%
- Cash-on-cash
- 28.47%
- DSCR
- 2.27
- GRM
- 4.6
CMA / ARV
No comps found within radius.
Projected returns pro-forma
8.26% appreciation · 3.0% rent growth · sell at horizon
- IRR
- 43.2%
- Equity multiple
- 4.04×
- Total profit
- $38,353
- Equity at exit
- $34,973
- IRR
- 38.5%
- Equity multiple
- 8.72×
- Total profit
- $97,239
- Equity at exit
- $70,185
Cash invested: $12,600 (down + closing). Projections, not guarantees.
Landlord ↔ Tenant lean methodology
- Overall (STATE)
- 46 Balanced
- State Minnesota
- 46 Balanced · D+2
- County
- — inherits STATE
- City
- — inherits STATE
ZIP-level market 55918
- Home prices YoY
- 3.3%
- Active inventory
- 5
- Price-to-rent
- 4.6×
Monthly cashflow live
- Estimated rent
- $818 medium interval (Pro) →
- Mortgage (P&I)
- −$236
- Tax from tax record
- −$92 /mo · $1,106/yr
- Insurance
- −$19
- HOA
- −$0
- Vacancy / Maint / Mgmt
- −$172
- Net cashflow
- $299
Break-even live
Sensitivity live
| Price | -10% $324 | -5% $312 | +0% $299 | +5% $286 | +10% $274 |
|---|---|---|---|---|---|
| Rent | -10% $234 | -5% $267 | +0% $299 | +5% $331 | +10% $364 |
| Rate | -1.0pp $322 | -0.5pp $310 | base $299 | +0.5pp $287 | +1.0pp $275 |
UW: 25.0% down · 7.5% · 30yr · 1.5% tax · 5.0% vac · 8.0% maint · 8.0% mgmt
Financing live
Cash to close
- Down payment
- $11,250
- Closing costs
- $1,350
- Reserves months
- —
- Total cash needed
- —
Loan-product check · same deal, 3 products live
Conventional
25% down · 7.5% · 30yr
- Down + closing
- —
- Monthly P&I
- —
- Monthly cashflow
- —
- DSCR
- —
- Eligible?
- —
Personal DTI + credit; lowest rate.
DSCR
20% down · 8.5% · 30yr
- Down + closing
- —
- Monthly P&I
- —
- Monthly cashflow
- —
- DSCR
- —
- Eligible?
- —
No personal income docs; deal must DSCR.
Hard money
10% down · 12.0% · 12mo
- Down + closing
- —
- Monthly P&I
- —
- Monthly cashflow
- —
- DSCR
- —
- Eligible?
- —
Short-term bridge; refi at stabilization.
Listing history 7 events
-
2026-06-03status $45,000 Pending 37 DOM
-
2026-06-02days on market $45,000 Active 37 DOM
-
2026-06-01days on market $45,000 Active 36 DOM
-
2026-05-31days on market $45,000 Active 35 DOM
-
2026-05-30days on market $45,000 Active 34 DOM
-
2026-04-25$49,900 Active 396-char remark
-
2019-08-19soldstatus $39,000
ⓘ Source: listings_history table (triggers on properties + properties_extension) + one-shot
backfill from property_details.listing_events for pre-trigger history.
Tax reassessment forecast MN · Partial reset (capped growth)
- Current annual tax
- $1,106 · $92/mo
- Projected year-2 tax
- $1,106 · $92/mo
- Expected delta
- $0/yr ($0/mo · 0.0%)
ⓘ Screening estimate from a state-policy table — verify with the county assessor before closing.
Climate risk First Street
- Flood 1/10 Low FEMA zone X (unshaded) · 0% chance over 30 yrs
- Wildfire 1/10 Low
- Heat 1/10 Low 7 d/yr ≥98°F today · 16 d/yr by 30 yrs out
- Wind 2/10 Low
- Air quality 1/10 Low 0 unhealthy d/yr today · 0 by 30 yrs out
Nearby sold comps map
Loading sold comps map…
Walkable amenities ~0.75 mi
Loading nearby amenities…
Taxation est. · year 1
- Rental income
- $9,811
- − Mortgage interest
- −$2,521
- − Property taxes
- −$1,106
- − Insurance
- −$225
- − Repairs & maintenance
- −$785
- − Management
- −$785
- − Depreciation
- −$1,309
- Taxable income
- $3,080
- Est. tax owed @ 24.0%
- −$739
- After-tax cash flow
- $2,849/yr
For passive investors: Depreciation is non-cash, so a rental often shows a tax loss while cash-flowing — sheltering income. Rental losses are passive: they offset passive income freely, and up to $25,000/yr can offset ordinary (W-2) income if you actively participate and your MAGI is under $100k (phasing out to $0 by $150k); unused losses carry forward. On sale, claimed depreciation is recaptured at up to 25%, and gains may owe capital-gains tax (a 1031 exchange can defer both). Figures are a year-1 estimate at your 24.0% rate — not tax advice; consult a CPA.
Schools (NCES district)
- District
- Hayfield Public School District
- NCES district ID
- 2713590
- Math proficiency
- 29% ▼ -13.00%
- Reading proficiency
- 38% ▼ -11.00%
- Median HH income
- $60,819
- Composite
- 30.11/100
- National rank
- #6336
- State rank
- #254 of 301 in MN
Livability — Brownsdale
- Score
- 65/100
- State rank
- #558
- US rank
- #13495
Category grades
Schools grade is shown separately in the Schools card above.
Census & demographics
- Census place
- Brownsdale, MN
- Population (ZIP)
- 1,119
Population outlook (Mower County) Hauer SSP2
- Today (2025)
- 39,967 people
- By 2030
- 40,204 · +0.6%
- By 2040
- 40,509 · +1.4%
- By 2050
- 40,841 · +2.2%
- By 2075
- 42,029 · +5.2%
- By 2100
- 42,272 · +5.8%
Race, ethnicity, and origin ACS 2023
- Neighborhood character
- Predominantly White (92%)
- Race & ethnicity
- White 92% Hispanic / Latino 6% Two or more races 3%
- Hispanic origin (detail)
- Mexican 6%
- Common ancestry
- Portuguese 21% Lithuanian 5% Italian 3%
- Foreign-born
- 4% · Canada
- Languages at home
- 95% English-only · Spanish 4%
Political lean MEDSL · Mower
- 2024 margin
- R (+10.5) · D 43.9% · R 54.4% · Other 1.7%
- 2008→2024 swing
- -34.1pp toward R · 2008: 23.6pp · 2024: -10.5pp
- All cycles
- 2024: R+10.5 2020: R+5.8 2016: R+7.8 2012: D+22.7 2008: D+23.6
Not yet ingested
- Civics
- —
Market trends
- HPI YoY
- ▲ 8.26%
- Current HPI
- 258.6008
- Rent YoY
- —
- Metro
- —
- State GDP YoY
- ▲ 2.41%
- F500 in state
- 34
Industry mix (Fortune 500 HQ in MN)
| Industry | F500 HQs | Revenue |
|---|---|---|
| Healthcare | 2 | $407B |
|
||
| Retail | 2 | $150B |
|
||
| Consumer Goods | 2 | $32B |
|
||
| Industrial Machinery | 2 | $6B |
|
||
| Agriculture | 1 | $40B |
|
||
| Healthcare / Medical Devices | 1 | $32B |
|
||
Price history
+2.6% since first listed5 events — show timeline
- 2026-06-11 Sold (MLS) $40,000 NORTHSTARMLS as Distributed by MLS Grid
- 2026-06-03 Pending — NORTHSTARMLS as Distributed by MLS Grid
- 2026-05-22 Price Changed $45,000 NORTHSTARMLS as Distributed by MLS Grid
- 2026-04-25 Listed $49,900 NORTHSTARMLS as Distributed by MLS Grid
- 2019-08-19 Sold (Public Records) $39,000 Public Records
Property tax history
+9.2%/yrLatest (2025): $1,106 · +14.5% YoY. Source: county tax records.
Cash-flow waterfall
monthlySold comps — $/sqft
last 12 mo · ≤1 miLoading sold comps…