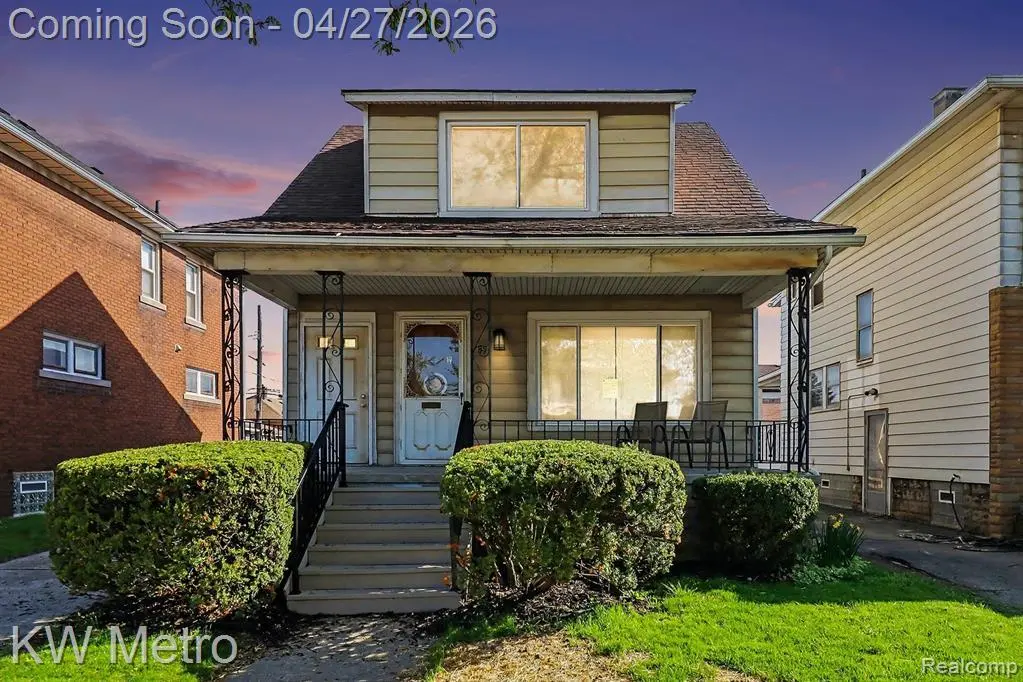
85 Walnut St · River Rouge, MI
Flood risk 5/10 · Moderate
- FEMA flood zone
- X (unshaded)
- Chance of flooding over 30 yrs
- 0.47%
- Est. flood insurance / yr
- $507 – $1,088
Fire risk 1/10 · Minimal
- Est. fire insurance / yr
- $784 – $1,456
Heat risk 3/10 · Minor
- Hot days now (above 95°F)
- 7 days/yr
- Hot days in 30 yrs
- 16 days/yr
Wind risk 2/10 · Minimal
- Chance of severe wind over 30 yrs
- —
Air-quality risk 4/10 · Minor
- Unhealthy air days now
- 6 days/yr
- Unhealthy air days in 30 yrs
- 8 days/yr
Risk factors via First Street. Map © Google.
Why this score? — see what drove the C grade
The composite is a weighted blend of 9 inputs, each scored 0–100. Each bar is that input's sub-score; the figure is the points it added to the 100-point composite (weight × sub-score).
- Cash flow +23.7/30.0
- Appreciation +10.0/10.0
- DSCR +7.6/10.0
- 1% rule +5.6/10.0
- Livability +3.2/5.0
- Rent growth +2.5/5.0
- Condition / age +2.5/5.0
- Schools +0.5/10.0
- ARV discount +0.0/15.0
$95,000
🖨 Deal sheet 📄 Offer letter ✓ Due diligence
Listing remarks MLS
Welcome to 85 Walnut located in River Rouge. Property has newer roof, newer furnace, large 2.5 car garage great for extra storage or work projects, two full baths, and more. Great property. Located near schools, shopping, public transportation and major freeways.
Key facts
- 3,485 sq ft lot
- 2 garage spots
- Built 1922
Property features AI
Exterior
- Parking: Detached garage (2.5 spaces)
- Utilities: Public sewer; Water: Other
- Home design: Single-family residence; Two levels; Ground-level entry
- Construction: Aluminum siding; Brick/mortar foundation
- Exterior features: Paved road; Lot approximately 35 x 100 (0.08 acres)
Interior
- Bathrooms: 2 full bathrooms
- Heating & cooling: Forced air heating (natural gas); Window cooling units
- Interior features: Gas water heater; Full, partially finished basement; 7 total rooms
Neighborhood map
What this means for you Summary
Snapshot
- This is a 3-bed/2.0-bath single-family listed at $95k.
Deal economics
- At list price, monthly cash flow is $181 ($2k/yr) — positive.
- The deal already cash-flows at list — no discount required.
- Meets the 1% rule at list price ($1k rent vs $95k).
- Recommended offer: $92k (3.0% below list) — sets the bar for market timing.
Location & tenants
- Location reads 65/100 on livability (#454 in MI) — a middle-class / working-renter tenant base. Strengths: commute A+, cost of living A+, housing B+; Watch: health & safety D, schools F, crime F.
- River Rouge School District (suburban): math 3% / reading 12% proficiency, ranked #535 of 540 in MI (top 99%) — low school quality limits family demand, transient renter base, plan for 1-2y turnover; 89% free/reduced lunch — lower-income household profile, screen leases tightly.
- Market conditions: 58 active listings in the ZIP; 6 comparable units currently listed for rent nearby; rentals at typical pace (median 24d on market — plan ~3-4 weeks tenant-placement turnaround); 2,639 units permitted in Wayne County in 2024 (1,216 in 5+ unit buildings).
Forward outlook
- In year one you build about $10k of equity ($657 loan paydown + $10k appreciation (10.0% local appreciation)).
- Wayne County population projected at -17% by 2050 — secular population decline; favor cash flow + early exit over multi-decade hold.
- At projected returns (10.0% appreciation + 3.0% rent growth), your $27k cash investment doubles in ~3 years — after that, you're playing with house money.
- By year 4, paydown + projected appreciation supports a ~$36k cash-out refi (75% LTV) — recoverable capital for the next deal without selling this one.
Negotiation context
- It's been on market 44 days — a 3% lower offer ($92k) is reasonable based on typical stale-listing flexibility.
- 8 sale attempts; this cycle's ask has dropped $10k (10%) from the opening price — seller is motivated, your offer sets the floor, not the list.
- Current owner paid $35k; list at $95k implies a 171% gain — meaningful room to come down on a strong offer.
Risks & watch-outs
- Watch-outs: built in 1922 — expect roof / HVAC / electrical / plumbing capex.
- Climate carrying-cost: moderate flood risk — expect insurance premiums to compound above CPI over the hold.
Questions for the listing agent
- It's been on market 44 days. Have you received any prior offers? Is the seller open to a 3% concession, seller financing, or rate buy-down credit?
- Built in 1922 — when were the roof, HVAC, electrical panel, plumbing, and water heater last replaced?
- Is there a deadline driving the sale (1031 exchange, divorce, estate, relocation)? That informs how much negotiation room exists.
- Schools are F-rated, which usually means shorter tenancies and higher turnover. Who's the typical renter profile here, and what's been the actual vacancy rate?
- Crime grade is F in this area — have there been break-ins, vandalism, or insurance claims at this property in the last 3 years? What carrier currently insures it and at what premium?
- What's the average days-on-market for RENTAL listings here right now (not sales)? A rising rental-DOM trend means longer vacancies and softer asking-rent achievability than the comps imply.
- What's the recent tenant-quality profile in this submarket — average credit score on applications, eviction rate, late-payment / NSF rate, and stable-employment percentage? A property-management company in the area should have these aggregated.
- How much new for-sale + rental construction is in the pipeline within 1–3 miles? Heavy new supply typically softens prices + rents 12–24 months out; constrained supply supports both.
Investment metrics
- 1% rule
- 1.06% ✓
- Cap rate
- 8.57%
- Cash-on-cash
- 8.15%
- DSCR
- 1.36
- GRM
- 7.9
CMA / ARV
- ARV (on-the-fly)
- $76,230
- Comps found
- 12
Show comp detail 12 sales within ~0.75 mi
| Address | Dist | Beds/Ba | Sqft | Sold | Price | $/sf | Match |
|---|---|---|---|---|---|---|---|
| 235 Richter St | 0.28mi | 3/1.0 | 1,152 (-0%) | 1mo | $45,625 | $40 | 81 |
| 16 Alexander St | 0.22mi | 3/1.5 | 1,200 (+4%) | 4mo | $135,000 | $113 | 78 |
| 235 Goodell St | 0.32mi | 3/1.5 | 1,092 (-6%) | 4mo | $147,000 | $135 | 71 |
| 41 Le Blanc St | 0.50mi | 3/1.0 | 1,133 (-2%) | 2mo | $112,500 | $99 | 68 |
| 26 Perrin St | 0.22mi | 2/2.0 (-1) | 1,276 (+10%) | 0mo | $68,900 | $54 | 67 |
| 251 Beechwood St | 0.59mi | 3/1.0 | 1,150 (-0%) | 4mo | $30,000 | $26 | 65 |
| 60 Forest St | 0.47mi | 3/1.0 | 1,005 (-13%) | 1mo | $45,625 | $45 | 51 |
| 349 Frazier St | 0.65mi | 3/2.0 | 1,036 (-10%) | 2mo | $120,000 | $116 | 51 |
| 57 E Glenwood St | 0.67mi | 4/1.5 (+1) | 1,214 (+5%) | 4mo | $79,900 | $66 | 50 |
| 123 Burke St | 0.55mi | 4/1.0 (+1) | 1,032 (-11%) | 1mo | $45,625 | $44 | 46 |
| 70 E Rockwood St | 0.64mi | 4/2.0 (+1) | 1,296 (+12%) | 2mo | $85,000 | $66 | 43 |
| 111 Burke St | 0.59mi | 2/1.0 (-1) | 1,000 (-13%) | 5mo | $24,000 | $24 | 37 |
Match score weights: distance 35% · size 25% · config 20% · recency 20%. Top-matched comps best support the ARV.
Projected returns pro-forma
10.0% appreciation · 3.0% rent growth · sell at horizon
- IRR
- 30.2%
- Equity multiple
- 3.38×
- Total profit
- $63,233
- Equity at exit
- $85,584
- IRR
- 26.2%
- Equity multiple
- 7.66×
- Total profit
- $177,137
- Equity at exit
- $184,564
Cash invested: $26,600 (down + closing). Projections, not guarantees.
Landlord ↔ Tenant lean methodology
- Overall (STATE)
- 62 Landlord-Friendly
- State Michigan
- 62 Landlord-Friendly · EVEN
- County
- — inherits STATE
- City
- — inherits STATE
ZIP-level market 48218
- Home prices YoY
- 28.4%
- Active inventory
- 58
- Price-to-rent
- 7.9×
Monthly cashflow live
- Estimated rent
- $1,003 high interval (Pro) →
- Mortgage (P&I)
- −$498
- Tax from tax record
- −$74 /mo · $886/yr
- Insurance
- −$40
- HOA
- −$0
- Vacancy / Maint / Mgmt
- −$211
- Net cashflow
- $181
Break-even live
UW: 25.0% down · 7.5% · 30yr · 1.5% tax · 5.0% vac · 8.0% maint · 8.0% mgmt
Financing live
Cash to close
- Down payment
- $23,750
- Closing costs
- $2,850
- Reserves months
- —
- Total cash needed
- —
Loan-product check · same deal, 3 products live
Conventional
25% down · 7.5% · 30yr
- Down + closing
- —
- Monthly P&I
- —
- Monthly cashflow
- —
- DSCR
- —
- Eligible?
- —
Personal DTI + credit; lowest rate.
DSCR
20% down · 8.5% · 30yr
- Down + closing
- —
- Monthly P&I
- —
- Monthly cashflow
- —
- DSCR
- —
- Eligible?
- —
No personal income docs; deal must DSCR.
Hard money
10% down · 12.0% · 12mo
- Down + closing
- —
- Monthly P&I
- —
- Monthly cashflow
- —
- DSCR
- —
- Eligible?
- —
Short-term bridge; refi at stabilization.
Rent comps 6 comps
| Address | Beds | Baths | Sqft | Rent | $/sqft | DOM | Units | Dist |
|---|---|---|---|---|---|---|---|---|
| 97 Batavia St Unit 1 River Rouge, MI | 2.0 | 1.0 | 900 | $825 | $0.92 | 24d | 1 | 0.32mi |
| 17 W James St Unit 17 W James Lower River Rouge, MI | 2.0 | 1.0 | 900 | $950 | $1.06 | 14d | 1 | 0.61mi |
| 1139 S Bassett St Detroit, MI | 3.0 | 1.0 | 927 | $1,120 | $1.21 | 43d | 1 | 0.83mi |
| 1139 S Bassett St Detroit, MI | 3.0 | 1.0 | 927 | $1,050 | $1.13 | 24d | 1 | 0.83mi |
| 3801 18th St Ecorse, MI | 3.0 | 1.0 | 1196 | $1,150 | $0.96 | 17d | 1 | 1.10mi |
| 4015 16th St Ecorse, MI | 3.0 | 1.5 | 1170 | $1,300 | $1.11 | 24d | 1 | 1.41mi |
Listing history 26 events
-
2026-06-10status $95,000 Pending 44 DOM
-
2026-06-09days on market $95,000 Active Under Contract 44 DOM
-
2026-06-08days on market $95,000 Active Under Contract 43 DOM
-
2026-06-07days on market $95,000 Active Under Contract 42 DOM
-
2026-06-04days on market $95,000 Active Under Contract 39 DOM
-
2026-06-03statusdays on market $95,000 Active Under Contract 38 DOM
-
2026-06-02days on market $95,000 Active 37 DOM
-
2026-06-01days on market $95,000 Active 36 DOM
-
2026-05-31days on market $95,000 Active 35 DOM
-
2026-05-23price $95,000 263-char remark
Show marketing remark (263 chars)
Welcome to 85 Walnut located in River Rouge. Property has newer roof, newer furnace, large 2.5 car garage great for extra storage or work projects, two full baths, and more. Great property. Located near schools, shopping, public transportation and major freeways.
-
2026-05-22price $95,000
-
2026-04-27$105,000 Active 263-char remark
Show marketing remark (263 chars)
Welcome to 85 Walnut located in River Rouge. Property has newer roof, newer furnace, large 2.5 car garage great for extra storage or work projects, two full baths, and more. Great property. Located near schools, shopping, public transportation and major freeways.
-
2026-04-27$105,000 Active
Show marketing remark (263 chars)
Welcome to 85 Walnut located in River Rouge. Property has newer roof, newer furnace, large 2.5 car garage great for extra storage or work projects, two full baths, and more. Great property. Located near schools, shopping, public transportation and major freeways.
-
2026-04-24historical $105,000 263-char remark
Show marketing remark (263 chars)
Welcome to 85 Walnut located in River Rouge. Property has newer roof, newer furnace, large 2.5 car garage great for extra storage or work projects, two full baths, and more. Great property. Located near schools, shopping, public transportation and major freeways.
-
2025-12-09historical
-
2025-10-17status Active
-
2025-10-17status Active
-
2025-10-10historical Accepting Backup Offers
-
2025-10-10historical Active Under Contract
-
2025-10-07$79,500 Active
-
2025-10-07$79,500 Active
-
2025-10-07historical
-
2025-10-07historical
-
2025-10-06$79,500 Active
-
2025-10-06$79,500 Active
-
1993-09-15soldstatus $35,000
ⓘ Source: listings_history table (triggers on properties + properties_extension) + one-shot
backfill from property_details.listing_events for pre-trigger history.
Tax reassessment forecast MI · Partial reset (capped growth)
- Current annual tax
- $886 · $74/mo
- Projected year-2 tax
- $1,175 · $98/mo
- Expected delta
- +$288/yr (+$24/mo · 32.5%)
ⓘ Screening estimate from a state-policy table — verify with the county assessor before closing.
Climate risk First Street
- Flood 5/10 Major FEMA zone X (unshaded) · 47% chance over 30 yrs
- Wildfire 1/10 Low
- Heat 3/10 Moderate 7 d/yr ≥95°F today · 16 d/yr by 30 yrs out
- Wind 2/10 Low
- Air quality 4/10 Moderate 6 unhealthy d/yr today · 8 by 30 yrs out
Nearby sold comps map
Loading sold comps map…
Walkable amenities ~0.75 mi
Loading nearby amenities…
Taxation est. · year 1
- Rental income
- $12,035
- − Mortgage interest
- −$5,321
- − Property taxes
- −$886
- − Insurance
- −$475
- − Repairs & maintenance
- −$963
- − Management
- −$963
- − Depreciation
- −$2,764
- Taxable income
- $663
- Est. tax owed @ 24.0%
- −$159
- After-tax cash flow
- $2,009/yr
For passive investors: Depreciation is non-cash, so a rental often shows a tax loss while cash-flowing — sheltering income. Rental losses are passive: they offset passive income freely, and up to $25,000/yr can offset ordinary (W-2) income if you actively participate and your MAGI is under $100k (phasing out to $0 by $150k); unused losses carry forward. On sale, claimed depreciation is recaptured at up to 25%, and gains may owe capital-gains tax (a 1031 exchange can defer both). Figures are a year-1 estimate at your 24.0% rate — not tax advice; consult a CPA.
Schools (NCES district)
- District
- River Rouge School District
- NCES district ID
- 2629760
- Math proficiency
- 3% ▼ -7.00%
- Reading proficiency
- 12% ▼ -4.00%
- Median HH income
- $26,664
- Composite
- 5.29/100
- National rank
- #10033
- State rank
- #535 of 540 in MI
Livability — River Rouge
- Score
- 65/100
- State rank
- #454
- US rank
- #12700
Category grades
Schools grade is shown separately in the Schools card above.
Census & demographics
- Census place
- River Rouge, MI
- City population
- 7,096
- Population (ZIP)
- 7,096
Population outlook (Wayne County) Hauer SSP2
- Today (2025)
- 1,675,273 people
- By 2030
- 1,620,300 · -3.3%
- By 2040
- 1,502,341 · -10.3%
- By 2050
- 1,384,039 · -17.4%
- By 2075
- 1,124,592 · -32.9%
- By 2100
- 881,193 · -47.4%
Race, ethnicity, and origin ACS 2023
- Neighborhood character
- Diverse neighborhood (Simpson 0.66)
- Race & ethnicity
- Black 45% White 34% Two or more races 16% Hispanic / Latino 16%
- Hispanic origin (detail)
- Mexican 9% Puerto Rican 5%
- Common ancestry
- Romanian 4% Lithuanian 2% Italian 1%
- Foreign-born
- 6% · Canada
- Languages at home
- 86% English-only · Spanish 11% Arabic 2% Other Indo-European 1%
Political lean MEDSL · Wayne
- 2024 margin
- Strong D (+29.0) · D 62.7% · R 33.7% · Other 3.6%
- 2008→2024 swing
- -20.5pp toward R · 2008: 49.5pp · 2024: 29.0pp
- All cycles
- 2024: D+29.0 2020: D+38.1 2016: D+37.3 2012: D+46.9 2008: D+49.5
Not yet ingested
- Civics
- —
Market trends
- HPI YoY
- ▲ 77.93%
- Current HPI
- 352.3551
- Rent YoY
- —
- Metro
- —
- State GDP YoY
- ▲ 1.37%
- F500 in state
- 28
Industry mix (Fortune 500 HQ in MI)
| Industry | F500 HQs | Revenue |
|---|---|---|
| Automotive Parts | 3 | $48B |
|
||
| Automotive | 2 | $372B |
|
||
| Chemicals | 1 | $45B |
|
||
| Automotive Retail | 1 | $29B |
|
||
| Healthcare / Medical Devices | 1 | $23B |
|
||
| Automotive Technology | 1 | $20B |
|
||
Price history
+171.4% since first listed17 events — show timeline
- 2026-05-23 Price Changed $95,000 MiRealSource-MiMLS
- 2026-05-22 Price Changed $95,000 REALCOMP
- 2026-04-27 Listed $105,000 MiRealSource-MiMLS
- 2026-04-27 Listed $105,000 REALCOMP
- 2026-04-24 Coming Soon $105,000 MiRealSource-MiMLS
- 2025-12-09 Listing Removed — MiRealSource-MiMLS
- 2025-10-17 Relisted — MiRealSource-MiMLS
- 2025-10-17 Relisted — REALCOMP
- 2025-10-10 Contingent — MiRealSource-MiMLS
- 2025-10-10 Contingent — REALCOMP
- 2025-10-07 Listing Removed — REALCOMP
- 2025-10-07 Listing Removed — MiRealSource-MiMLS
- 2025-10-07 Listed $79,500 REALCOMP
- 2025-10-07 Listed $79,500 MiRealSource-MiMLS
- 2025-10-06 Listed $79,500 REALCOMP
- 2025-10-06 Listed $79,500 MiRealSource-MiMLS
- 1993-09-15 Sold (Public Records) $35,000 Public Records
Property tax history
-5.8%/yrLatest (2025): $886 · -33.2% YoY. Source: county tax records.
Cash-flow waterfall
monthlySold comps — $/sqft
last 12 mo · ≤1 miLoading sold comps…