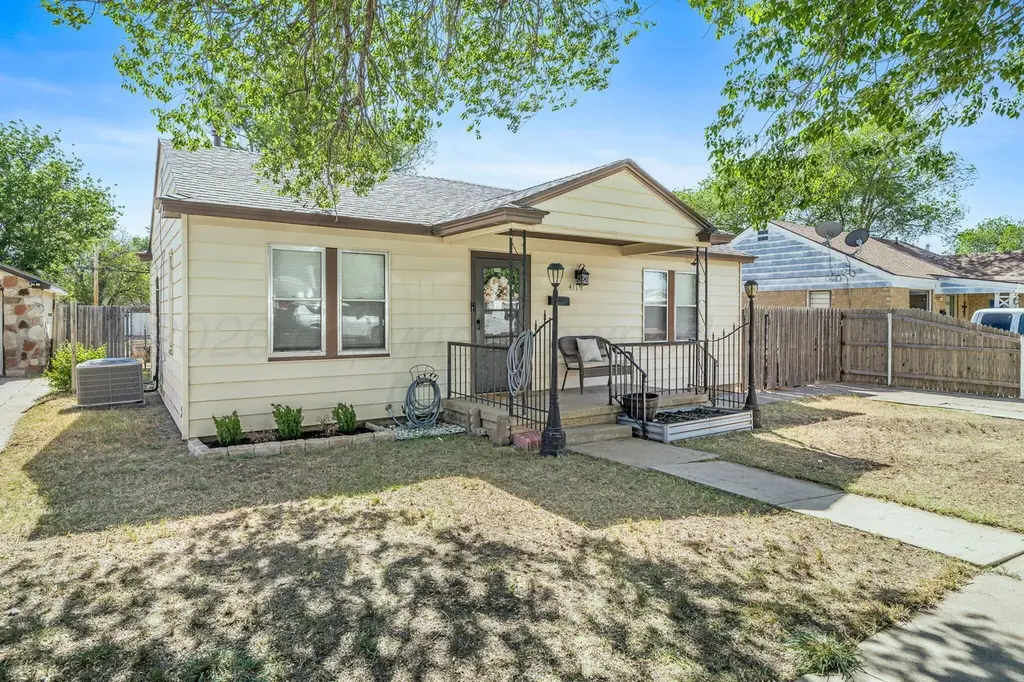
4119 S Harrison St · Amarillo, TX
Flood risk 1/10 · Minimal
- FEMA flood zone
- X (unshaded)
- Chance of flooding over 30 yrs
- 0.0%
- Est. flood insurance / yr
- $507 – $1,088
Fire risk 9/10 · Severe
- Est. fire insurance / yr
- $1,222 – $2,270
Heat risk 4/10 · Minor
- Hot days now (above 97°F)
- 7 days/yr
- Hot days in 30 yrs
- 20 days/yr
Wind risk 2/10 · Minimal
- Chance of severe wind over 30 yrs
- —
Air-quality risk 2/10 · Minimal
- Unhealthy air days now
- 1 days/yr
- Unhealthy air days in 30 yrs
- 1 days/yr
Risk factors via First Street. Map © Google.
Why this score? — see what drove the C+ grade
The composite is a weighted blend of 9 inputs, each scored 0–100. Each bar is that input's sub-score; the figure is the points it added to the 100-point composite (weight × sub-score).
- Cash flow +21.8/30.0
- ARV discount +15.0/15.0
- DSCR +7.0/10.0
- 1% rule +6.5/10.0
- Rent growth +4.0/5.0
- Schools +3.6/10.0
- Livability +3.3/5.0
- Condition / age +2.5/5.0
- Appreciation +0.0/10.0
$140,000
🖨 Deal sheet 📄 Offer letter ✓ Due diligence
Listing remarks MLS
Awesome Shop. .. house on property also!! Shop has heater and alley garage overhead door. One car garage. TWO LIVING AREAS, Gas Line and Sewer Line replaced to alley per Seller. Great covered back porch and large back yard. House has central heat. 4 Cars could fit in Garage and Shop.
Key facts
- Raised beds
- Dining area
- Large kitchen
Tags
Neighborhood map
What this means for you Summary
Snapshot
- This is a 3-bed/2.0-bath single-family listed at $140k.
Deal economics
- At list price, monthly cash flow is $218 ($3k/yr) — positive.
- The deal already cash-flows at list — no discount required.
- Meets the 1% rule at list price ($2k rent vs $140k).
Location & tenants
- Location reads 66/100 on livability (#624 in TX) — a middle-class / working-renter tenant base. Strengths: cost of living A+, housing A+; Watch: amenities C-, schools D, crime F.
- Amarillo ISD (urban): math 44% / reading 41% proficiency, ranked #336 of 826 in TX (top 41%) — families likely to look elsewhere, expect single-tenant / working-renter base with shorter leases.
- Market conditions: Rents rising fast (+6.0%/yr); 65 active listings in the ZIP; 14 comparable units currently listed for rent nearby; rentals at typical pace (median 21d on market — plan ~3-4 weeks tenant-placement turnaround); 45 units permitted in Randall County in 2024 (0 in 5+ unit buildings).
Forward outlook
- Local home prices are declining (-3.0%/yr); year-one equity from $968 of loan paydown is wiped out by about $4k of value loss. Plan a longer hold.
- Randall County population projected at +36% by 2050 — long-run rental-demand tailwind backs the buy-and-hold thesis.
- At projected returns (-3.0% appreciation + 6.0% rent growth), your $39k cash investment doubles in ~10 years — after that, you're playing with house money.
Negotiation context
- Only 3 days on market — expect competitive offers; lowballing is unlikely to land.
- 3 sale attempts since 10y ago with the ask held roughly flat each time — persistent listings suggest the price (not the market) is what's stuck; bring a comps-based counter.
Risks & watch-outs
- Watch-outs: built in 1950 — expect roof / HVAC / electrical / plumbing capex.
- Climate carrying-cost: severe wildfire risk — expect insurance premiums to compound above CPI over the hold.
Questions for the listing agent
- Built in 1950 — when were the roof, HVAC, electrical panel, plumbing, and water heater last replaced?
- Is there a deadline driving the sale (1031 exchange, divorce, estate, relocation)? That informs how much negotiation room exists.
- Schools are D-rated, which usually means shorter tenancies and higher turnover. Who's the typical renter profile here, and what's been the actual vacancy rate?
- Crime grade is F in this area — have there been break-ins, vandalism, or insurance claims at this property in the last 3 years? What carrier currently insures it and at what premium?
- What's the average days-on-market for RENTAL listings here right now (not sales)? A rising rental-DOM trend means longer vacancies and softer asking-rent achievability than the comps imply.
- What's the recent tenant-quality profile in this submarket — average credit score on applications, eviction rate, late-payment / NSF rate, and stable-employment percentage? A property-management company in the area should have these aggregated.
- How much new for-sale + rental construction is in the pipeline within 1–3 miles? Heavy new supply typically softens prices + rents 12–24 months out; constrained supply supports both.
Investment metrics
- 1% rule
- 1.15% ✓
- Cap rate
- 8.16%
- Cash-on-cash
- 6.68%
- DSCR
- 1.30
- GRM
- 7.3
CMA / ARV
- ARV (on-the-fly)
- $200,400
- Comps found
- 1
Show comp detail 1 sale within ~0.75 mi
| Address | Dist | Beds/Ba | Sqft | Sold | Price | $/sf | Match |
|---|---|---|---|---|---|---|---|
| 4610 Longbird St | 0.56mi | 3/2.0 | 1,464 (+10%) | 9mo | $220,000 | $150 | 50 |
Match score weights: distance 35% · size 25% · config 20% · recency 20%. Top-matched comps best support the ARV.
Projected returns pro-forma
-3.0% appreciation · 6.04% rent growth · sell at horizon
- IRR
- -2.4%
- Equity multiple
- 0.91×
- Total profit
- $-3,652
- Equity at exit
- $20,874
- IRR
- 10.6%
- Equity multiple
- 1.95×
- Total profit
- $37,145
- Equity at exit
- $12,105
Cash invested: $39,200 (down + closing). Projections, not guarantees.
Landlord ↔ Tenant lean methodology
- Overall (STATE)
- 87 Strongly Landlord-Friendly
- State Texas
- 87 Strongly Landlord-Friendly · R+5
- County
- — inherits STATE
- City
- — inherits STATE
ZIP-level market 79110
- Rents YoY
- 6.0%
- Active inventory
- 65
- Price-to-rent
- 7.3×
Monthly cashflow live
- Estimated rent
- $1,607 high interval (Pro) →
- Mortgage (P&I)
- −$734
- Tax from tax record
- −$259 /mo · $3,110/yr
- Insurance
- −$58
- HOA
- −$0
- Vacancy / Maint / Mgmt
- −$338
- Net cashflow
- $218
Break-even live
UW: 25.0% down · 7.5% · 30yr · 1.5% tax · 5.0% vac · 8.0% maint · 8.0% mgmt
Financing live
Cash to close
- Down payment
- $35,000
- Closing costs
- $4,200
- Reserves months
- —
- Total cash needed
- —
Loan-product check · same deal, 3 products live
Conventional
25% down · 7.5% · 30yr
- Down + closing
- —
- Monthly P&I
- —
- Monthly cashflow
- —
- DSCR
- —
- Eligible?
- —
Personal DTI + credit; lowest rate.
DSCR
20% down · 8.5% · 30yr
- Down + closing
- —
- Monthly P&I
- —
- Monthly cashflow
- —
- DSCR
- —
- Eligible?
- —
No personal income docs; deal must DSCR.
Hard money
10% down · 12.0% · 12mo
- Down + closing
- —
- Monthly P&I
- —
- Monthly cashflow
- —
- DSCR
- —
- Eligible?
- —
Short-term bridge; refi at stabilization.
Rent comps 14 comps
| Address | Beds | Baths | Sqft | Rent | $/sqft | DOM | Units | Dist |
|---|---|---|---|---|---|---|---|---|
| 4308 S Jackson St Amarillo, TX | 3.0 | 1.0 | 1302 | $1,490 | $1.14 | 21d | 1 | 0.30mi |
| 3813 S Washington St Unit B Amarillo, TX | 2.0 | 2.0 | 954 | $1,050 | $1.10 | 43d | 1 | 0.38mi |
| 4316 S Hayden St Amarillo, TX | 3.0 | 1.5 | 1356 | $1,650 | $1.22 | 43d | 1 | 0.55mi |
| 3205 S Tyler St Amarillo, TX | 3.0 | 1.0 | 1381 | $1,475 | $1.07 | 13d | 1 | 0.68mi |
| 4620 S Hayden St Amarillo, TX | 3.0 | 1.0 | 1036 | $1,475 | $1.42 | 21d | 1 | 0.73mi |
| 4615 S Lipscomb St Amarillo, TX | 3.0 | 2.0 | 1168 | $1,000 | $0.86 | 13d | 1 | 0.79mi |
| 608 Lochridge Amarillo, TX | 3.0 | 2.0 | 1455 | $1,900 | $1.31 | 43d | 1 | 0.80mi |
| 4611 Cline Rd Amarillo, TX | 4.0 | 1.5 | 1500 | $1,500 | $1.00 | 21d | 1 | 0.86mi |
| 4108 Crockett St Amarillo, TX | 3.0 | 1.0 | 1373 | $1,525 | $1.11 | 43d | 1 | 0.89mi |
| 2709 S Van Buren St Unit 1 Amarillo, TX | 3.0 | 2.0 | 1787 | $2,100 | $1.18 | 13d | 1 | 0.97mi |
| 307 Mikeska St Amarillo, TX | 3.0 | 2.0 | 1250 | $1,800 | $1.44 | 21d | 1 | 1.00mi |
| 3610 S Austin St Amarillo, TX | 3.0 | 2.5 | 1810 | $2,100 | $1.16 | 43d | 1 | 1.11mi |
| 1128 Pikes Peak Dr Amarillo, TX | 4.0 | 2.0 | 1867 | $1,995 | $1.07 | 21d | 1 | 1.11mi |
| 4418 Ross St Amarillo, TX | 3.0 | 2.0 | 1388 | $1,750 | $1.26 | 21d | 1 | 1.49mi |
Listing history 6 events
-
2026-04-27status Pending
-
2026-04-24$140,000 Active
-
2026-04-24$140,000 Active
-
2016-07-18soldstatus
-
2016-07-15soldstatus 285-char remark
Show marketing remark (285 chars)
Awesome Shop. .. house on property also!! Shop has heater and alley garage overhead door. One car garage. TWO LIVING AREAS, Gas Line and Sewer Line replaced to alley per Seller. Great covered back porch and large back yard. House has central heat. 4 Cars could fit in Garage and Shop.
-
2016-05-03$95,000 285-char remark
Show marketing remark (285 chars)
Awesome Shop. .. house on property also!! Shop has heater and alley garage overhead door. One car garage. TWO LIVING AREAS, Gas Line and Sewer Line replaced to alley per Seller. Great covered back porch and large back yard. House has central heat. 4 Cars could fit in Garage and Shop.
ⓘ Source: listings_history table (triggers on properties + properties_extension) + one-shot
backfill from property_details.listing_events for pre-trigger history.
Tax reassessment forecast TX · Resets to sale price
- Current annual tax
- $3,110 · $259/mo
- Projected year-2 tax
- $3,110 · $259/mo
- Expected delta
- $0/yr ($0/mo · 0.0%)
ⓘ Screening estimate from a state-policy table — verify with the county assessor before closing.
Climate risk First Street
- Flood 1/10 Low FEMA zone X (unshaded) · 0% chance over 30 yrs
- Wildfire 9/10 Extreme
- Heat 4/10 Moderate 7 d/yr ≥97°F today · 20 d/yr by 30 yrs out
- Wind 2/10 Low
- Air quality 2/10 Low 1 unhealthy d/yr today · 1 by 30 yrs out
Nearby sold comps map
Loading sold comps map…
Walkable amenities ~0.75 mi
Loading nearby amenities…
Taxation est. · year 1
- Rental income
- $19,289
- − Mortgage interest
- −$7,842
- − Property taxes
- −$3,110
- − Insurance
- −$700
- − Repairs & maintenance
- −$1,543
- − Management
- −$1,543
- − Depreciation
- −$4,073
- Taxable income
- $477
- Est. tax owed @ 24.0%
- −$114
- After-tax cash flow
- $2,503/yr
For passive investors: Depreciation is non-cash, so a rental often shows a tax loss while cash-flowing — sheltering income. Rental losses are passive: they offset passive income freely, and up to $25,000/yr can offset ordinary (W-2) income if you actively participate and your MAGI is under $100k (phasing out to $0 by $150k); unused losses carry forward. On sale, claimed depreciation is recaptured at up to 25%, and gains may owe capital-gains tax (a 1031 exchange can defer both). Figures are a year-1 estimate at your 24.0% rate — not tax advice; consult a CPA.
Schools (NCES district)
- District
- Amarillo ISD
- NCES district ID
- 4808130
- Math proficiency
- 44% ▼ -9.00%
- Reading proficiency
- 41% ▼ -3.00%
- Median HH income
- $43,478
- Composite
- 35.96/100
- National rank
- #4798
- State rank
- #336 of 826 in TX
Livability — Amarillo
- Score
- 66/100
- State rank
- #624
- US rank
- #11876
Category grades
Schools grade is shown separately in the Schools card above.
Census & demographics
- Census place
- Amarillo, TX
- County
- Randall County · 137,351 people
- City population
- 185,802
- Metro
- Amarillo, TX
- Population (ZIP)
- 16,994
- Household income
- $66,683
- Rent vs Own
- Severe rent burden
- 208.0
Population outlook (Randall County) Hauer SSP2
- Today (2025)
- 152,140 people
- By 2030
- 163,107 · +7.2%
- By 2040
- 184,999 · +21.6%
- By 2050
- 206,948 · +36.0%
- By 2075
- 260,204 · +71.0%
- By 2100
- 294,980 · +93.9%
Race, ethnicity, and origin ACS 2023
- Neighborhood character
- Majority White (61%)
- Race & ethnicity
- White 61% Hispanic / Latino 32% Two or more races 13% Black 4% Asian 1%
- Hispanic origin (detail)
- Mexican 29%
- Common ancestry
- Italian 2% Slovak 1% Lithuanian 1%
- Foreign-born
- 5% · Canada, Vietnam
- Languages at home
- 83% English-only · Spanish 13% Other Indo-European 2% Other Asian/Pacific 1%
Political lean MEDSL · Randall
- 2024 margin
- Solid R (+60.4) · D 19.4% · R 79.8%
- 2008→2024 swing
- +2.3pp toward D · 2008: -62.7pp · 2024: -60.4pp
- All cycles
- 2024: R+60.4 2020: R+58.8 2016: R+65.1 2012: R+68.2 2008: R+62.7
Not yet ingested
- Civics
- —
Market trends
- HPI YoY
- ▼ -226.16%
- Current HPI
- 180.2164
- Rent YoY
- ▲ 6.04%
- Metro
- Amarillo, TX
- State GDP YoY
- ▲ 3.95%
- F500 in state
- 110
Industry mix (Fortune 500 HQ in TX)
| Industry | F500 HQs | Revenue |
|---|---|---|
| Energy | 16 | $1,198B |
|
||
| Technology | 5 | $198B |
|
||
| Engineering / Construction | 4 | $72B |
|
||
| Energy Services | 3 | $60B |
|
||
| Utilities | 3 | $41B |
|
||
| Healthcare | 2 | $330B |
|
||
Price history
+47.4% since first listed6 events — show timeline
- 2026-04-27 Pending — AARMLS
- 2026-04-24 Listed $140,000 AARMLS
- 2026-04-24 Listed $140,000 PBOR
- 2016-07-18 Sold (Public Records) — Public Records
- 2016-07-15 Sold (MLS) — AARMLS
- 2016-05-03 Listed $95,000 AARMLS
Property tax history
+4.7%/yrLatest (2025): $3,110 · +12.1% YoY. Source: county tax records.
Cash-flow waterfall
monthlySold comps — $/sqft
last 12 mo · ≤1 miLoading sold comps…