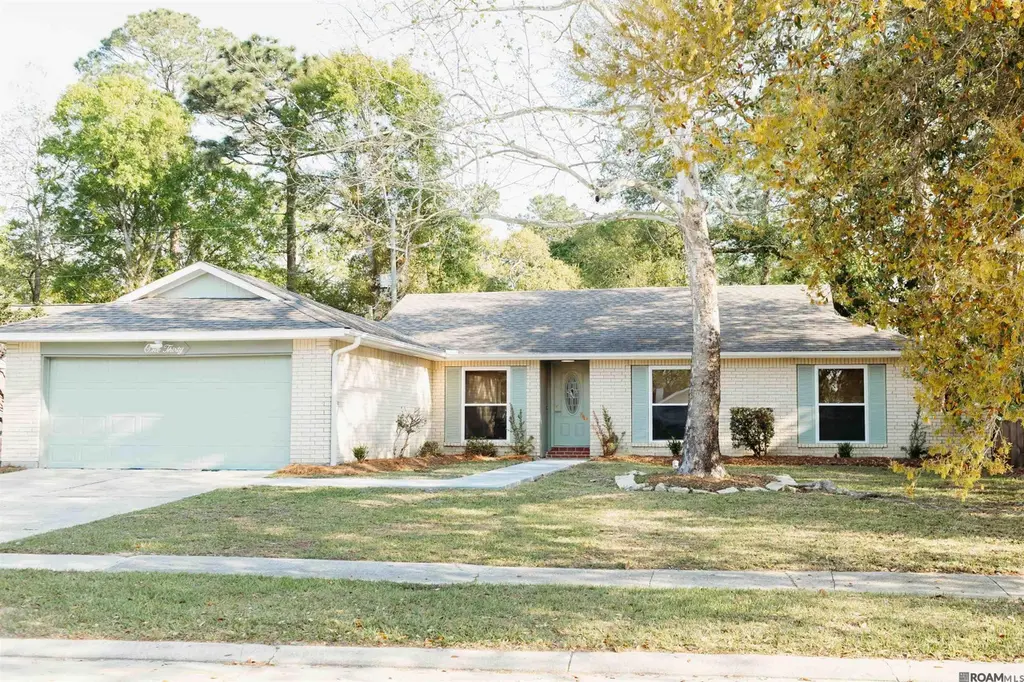
130 North Blvd · Slidell, LA
Flood risk No data
- FEMA flood zone
- —
- Chance of flooding over 30 yrs
- —
- Est. flood insurance / yr
- —
Fire risk No data
- Est. fire insurance / yr
- —
Heat risk No data
- Hot days now (above threshold)
- —
- Hot days in 30 yrs
- —
Wind risk No data
- Chance of severe wind over 30 yrs
- —
Air-quality risk No data
- Unhealthy air days now
- —
- Unhealthy air days in 30 yrs
- —
Risk factors via First Street. Map © Google.
Why this score? — see what drove the F grade
The composite is a weighted blend of 9 inputs, each scored 0–100. Each bar is that input's sub-score; the figure is the points it added to the 100-point composite (weight × sub-score).
- Cash flow +12.7/30.0
- Schools +4.3/10.0
- DSCR +3.8/10.0
- Livability +3.5/5.0
- 1% rule +3.1/10.0
- Rent growth +2.9/5.0
- Condition / age +2.5/5.0
- ARV discount +0.0/15.0
- Appreciation +0.0/10.0
$239,900
🖨 Deal sheet 📄 Offer letter ✓ Due diligence
Listing remarks MLS
Fully renovated 4/2 in the heart of Slidell. This home is located near Hwy 11 and I-12. Renovations include new kitchen cabinets, quartz countertops, bathroom vanities, windows, flooring, and fixtures throughout. A must see.
Key facts
- Fully renovated
- Quartz countertops
- New flooring
Tags
Neighborhood map
What this means for you Summary
Snapshot
- This is a 4-bed/2.0-bath single-family listed at $240k.
Deal economics
- At list price, monthly cash flow is $-27 ($-324/yr) — negative.
- To cash-flow at today's rent, offer at most $235k (2.0% below list).
- To meet the 1% rule (rent ≥ 1% of price), the offer needs to be $194k (19.1% below list).
- Recommended offer: $194k (19.1% below list) — sets the bar for 1% rule.
Location & tenants
- Location reads 70/100 on livability (#57 in LA) — a middle-class / working-renter tenant base. Strengths: cost of living A+, housing A+, health & safety A+; Watch: amenities F, commute F.
- St. Tammany Parish (suburban): math 43% / reading 55% proficiency, ranked #11 of 98 in LA (top 11%) — families likely to look elsewhere, expect single-tenant / working-renter base with shorter leases.
- Market conditions: Rents rising (+1.5%/yr); 489 active listings in the ZIP; 19 comparable units currently listed for rent nearby; rentals at typical pace (median 24d on market — plan ~3-4 weeks tenant-placement turnaround); 42% of comp listings sitting > 30 days — soft ceiling on asking rent; 1,064 units permitted in St. Tammany Parish in 2024 (0 in 5+ unit buildings).
- This rent runs 32% of the median local income ($73k/yr) — at the standard rent-burdened threshold; future hikes will face affordability resistance.
Forward outlook
- Local home prices are declining (-3.0%/yr); year-one equity from $2k of loan paydown is wiped out by about $7k of value loss. Plan a longer hold.
- St. Tammany County population projected at +27% by 2050 — long-run rental-demand tailwind backs the buy-and-hold thesis.
Negotiation context
- Only 7 days on market — expect competitive offers; lowballing is unlikely to land.
- 14 sale attempts since 19y ago with the ask held roughly flat each time — persistent listings suggest the price (not the market) is what's stuck; bring a comps-based counter.
- Current owner paid $167k; 44% above their basis — modest negotiation headroom, anchor on the comps not their cost.
Questions for the listing agent
- What do current leases actually rent for vs. the listed asking? Can we see a recent rent roll and the last 12 months of T-12 income?
- Is there a deadline driving the sale (1031 exchange, divorce, estate, relocation)? That informs how much negotiation room exists.
- Schools are B-rated — typically a magnet for longer-tenancy family renters. What's the average tenant stay here, and is there a school-zone premium baked into asking?
- The area grade is low — what's the realistic commute time and amenity access for the typical tenant pool here? Any planned neighborhood developments (good or bad) we should know about?
- What's the average days-on-market for RENTAL listings here right now (not sales)? A rising rental-DOM trend means longer vacancies and softer asking-rent achievability than the comps imply.
- What's the recent tenant-quality profile in this submarket — average credit score on applications, eviction rate, late-payment / NSF rate, and stable-employment percentage? A property-management company in the area should have these aggregated.
- How much new for-sale + rental construction is in the pipeline within 1–3 miles? Heavy new supply typically softens prices + rents 12–24 months out; constrained supply supports both.
Investment metrics
- 1% rule
- 0.81% ✗
- Cap rate
- 6.16%
- Cash-on-cash
- -0.48%
- DSCR
- 0.98
- GRM
- 10.3
CMA / ARV
- ARV (on-the-fly)
- $204,978
- Comps found
- 12
Show comp detail 12 sales within ~0.75 mi
| Address | Dist | Beds/Ba | Sqft | Sold | Price | $/sf | Match |
|---|---|---|---|---|---|---|---|
| 130 North Blvd | 0.00mi | 4/2.0 | 1,614 (0%) | 1mo | $239,900 | $149 | 99 |
| 206 Brian Dr | 0.19mi | 3/2.0 (-1) | 1,561 (-3%) | 2mo | $170,000 | $109 | 79 |
| 128 Dijon Dr | 0.38mi | 4/2.0 | 1,675 (+4%) | 1mo | $205,000 | $122 | 75 |
| 210 Anthony Dr | 0.13mi | 4/2.0 | 1,448 (-10%) | 2mo | $204,000 | $141 | 75 |
| 106 Matthews Dr | 0.38mi | 4/2.0 | 1,626 (+1%) | 7mo | $210,000 | $129 | 75 |
| 507 Driftwood Cir | 0.28mi | 3/2.0 (-1) | 1,540 (-5%) | 3mo | $95,000 | $62 | 72 |
| 220 Brian Dr | 0.31mi | 3/2.0 (-1) | 1,550 (-4%) | 6mo | $189,000 | $122 | 69 |
| 206 Canberra Ct | 0.34mi | 3/2.0 (-1) | 1,500 (-7%) | 1mo | $130,000 | $87 | 66 |
| 302 Crescentwood Loop | 0.28mi | 3/2.0 (-1) | 1,781 (+10%) | 5mo | $208,000 | $117 | 61 |
| 331 Thames Dr | 0.66mi | 3/2.0 (-1) | 1,594 (-1%) | 2mo | $202,000 | $127 | 61 |
| 209 Driftwood Cir | 0.38mi | 3/2.0 (-1) | 1,822 (+13%) | 3mo | $244,900 | $134 | 53 |
| 338 Country Club Blvd | 0.63mi | 3/2.0 (-1) | 1,851 (+15%) | 3mo | $244,000 | $132 | 39 |
Match score weights: distance 35% · size 25% · config 20% · recency 20%. Top-matched comps best support the ARV.
Projected returns pro-forma
-3.0% appreciation · 1.47% rent growth · sell at horizon
- IRR
- -18.7%
- Equity multiple
- 0.35×
- Total profit
- $-43,569
- Equity at exit
- $35,770
- IRR
- -14.4%
- Equity multiple
- 0.23×
- Total profit
- $-51,987
- Equity at exit
- $20,742
Cash invested: $67,172 (down + closing). Projections, not guarantees.
Landlord ↔ Tenant lean methodology
- Overall (STATE)
- 90 Strongly Landlord-Friendly
- State Louisiana
- 90 Strongly Landlord-Friendly · R+12
- County
- — inherits STATE
- City
- — inherits STATE
ZIP-level market 70458
- Rents YoY
- 1.5%
- Active inventory
- 489
- Price-to-rent
- 10.3×
Monthly cashflow live
- Estimated rent
- $1,940 high interval (Pro) →
- Mortgage (P&I)
- −$1,258
- Tax from tax record
- −$201 /mo · $2,418/yr
- Insurance
- −$100
- HOA
- −$0
- Vacancy / Maint / Mgmt
- −$407
- Net cashflow
- $-27
Break-even live
UW: 25.0% down · 7.5% · 30yr · 1.5% tax · 5.0% vac · 8.0% maint · 8.0% mgmt
Financing live
Cash to close
- Down payment
- $59,975
- Closing costs
- $7,197
- Reserves months
- —
- Total cash needed
- —
Loan-product check · same deal, 3 products live
Conventional
25% down · 7.5% · 30yr
- Down + closing
- —
- Monthly P&I
- —
- Monthly cashflow
- —
- DSCR
- —
- Eligible?
- —
Personal DTI + credit; lowest rate.
DSCR
20% down · 8.5% · 30yr
- Down + closing
- —
- Monthly P&I
- —
- Monthly cashflow
- —
- DSCR
- —
- Eligible?
- —
No personal income docs; deal must DSCR.
Hard money
10% down · 12.0% · 12mo
- Down + closing
- —
- Monthly P&I
- —
- Monthly cashflow
- —
- DSCR
- —
- Eligible?
- —
Short-term bridge; refi at stabilization.
Rent comps 19 comps
| Address | Beds | Baths | Sqft | Rent | $/sqft | DOM | Units | Dist |
|---|---|---|---|---|---|---|---|---|
| 542 Driftwood Cir Slidell, LA | 4.0 | 2.0 | 1960 | $2,100 | $1.07 | 3d | 1 | 0.42mi |
| 106 Kempsey Ct Slidell, LA | 3.0 | 2.0 | 1650 | $1,600 | $0.97 | 21d | 1 | 0.44mi |
| 129 Fountain Dr Slidell, LA | 4.0 | 2.0 | 1879 | $1,850 | $0.98 | 14d | 1 | 0.45mi |
| 117 S Queens Dr Slidell, LA | 4.0 | 2.0 | 1476 | $1,800 | $1.22 | 3d | 1 | 0.78mi |
| 221 Martin Ln Slidell, LA | 3.0 | 1.5 | 1353 | $1,800 | $1.33 | 23d | 1 | 0.80mi |
| 120 Christian Ln Slidell, LA | 3.0 | 2.0 | 1375 | $1,875 | $1.36 | 3d | 1 | 0.83mi |
| 120 Christian Ln Slidell, LA | 3.0 | 2.0 | 1375 | $1,875 | $1.36 | 3d | 1 | 0.83mi |
| 347 Oriole Dr Slidell, LA | 4.0 | 1.5 | 1560 | $1,500 | $0.96 | 43d | 1 | 0.87mi |
| 347 Oriole Dr Slidell, LA | 4.0 | 1.5 | 1560 | $1,500 | $0.96 | 23d | 1 | 0.87mi |
| 1030 Rue Corton Slidell, LA | 4.0 | 2.0 | 1931 | $2,150 | $1.11 | 43d | 1 | 1.01mi |
| 100 Firwood Dr Slidell, LA | 4.0 | 2.0 | 1649 | $1,900 | $1.15 | 43d | 1 | 1.19mi |
| 433 Grafton Dr Slidell, LA | 3.0 | 2.0 | 1625 | $1,900 | $1.17 | 43d | 1 | 1.32mi |
| 36409 Jackson Rd Slidell, LA | 4.0 | 2.0 | 1670 | $2,100 | $1.26 | 43d | 1 | 1.37mi |
| 1466 Florida Ave Slidell, LA | 3.0 | 2.0 | 1456 | $2,200 | $1.51 | 43d | 1 | 1.37mi |
| 557 Claiborne Trails Dr Slidell, LA | 3.0 | 2.0 | 1690 | $2,300 | $1.36 | 43d | 1 | 1.37mi |
| 641 Haaswood Ln Slidell, LA | 3.0 | 2.0 | 1721 | $2,400 | $1.39 | 43d | 1 | 1.41mi |
| 101 Dante Cir Slidell, LA | 4.0 | 2.0 | 1941 | $1,950 | $1.00 | 11d | 1 | 1.43mi |
| 513 Michigan Ave Slidell, LA | 3.0 | 2.0 | 1250 | $1,575 | $1.26 | 23d | 1 | 1.44mi |
| 1540 Queens Dr Slidell, LA | 4.0 | 2.0 | 1900 | $2,300 | $1.21 | 17d | 1 | 1.48mi |
Listing history 25 events
-
2026-04-22status Pending 224-char remark
Show marketing remark (224 chars)
Fully renovated 4/2 in the heart of Slidell. This home is located near Hwy 11 and I-12. Renovations include new kitchen cabinets, quartz countertops, bathroom vanities, windows, flooring, and fixtures throughout. A must see.
-
2026-04-22status Pending
Show marketing remark (224 chars)
Fully renovated 4/2 in the heart of Slidell. This home is located near Hwy 11 and I-12. Renovations include new kitchen cabinets, quartz countertops, bathroom vanities, windows, flooring, and fixtures throughout. A must see.
-
2026-02-06$239,900 Active 224-char remark
Show marketing remark (224 chars)
Fully renovated 4/2 in the heart of Slidell. This home is located near Hwy 11 and I-12. Renovations include new kitchen cabinets, quartz countertops, bathroom vanities, windows, flooring, and fixtures throughout. A must see.
-
2026-02-06$239,900 Active
Show marketing remark (224 chars)
Fully renovated 4/2 in the heart of Slidell. This home is located near Hwy 11 and I-12. Renovations include new kitchen cabinets, quartz countertops, bathroom vanities, windows, flooring, and fixtures throughout. A must see.
-
2025-09-12soldstatus Closed
-
2025-08-14status Pending
-
2025-08-05$147,000 Active
-
2025-08-05$147,000 Active
-
2025-08-05$147,000
-
2020-02-21soldstatus Closed
-
2020-02-21soldstatus $167,000
-
2020-01-21status Pending
-
2020-01-20status Active
-
2020-01-13status Pending
-
2019-12-05$169,900
-
2019-12-05$169,900 Active
-
2016-02-04historical
-
2015-10-23$149,900 Active
-
2015-10-23$149,900
-
2011-05-17$134,900
-
2011-05-17$134,900
-
2007-07-25soldstatus $141,900
-
2007-07-13soldstatus
-
2007-03-08$141,900
-
2007-03-08$141,900
ⓘ Source: listings_history table (triggers on properties + properties_extension) + one-shot
backfill from property_details.listing_events for pre-trigger history.
Tax reassessment forecast LA · Resets to sale price
- Current annual tax
- $2,418 · $201/mo
- Projected year-2 tax
- $2,418 · $201/mo
- Expected delta
- $0/yr ($0/mo · 0.0%)
ⓘ Screening estimate from a state-policy table — verify with the county assessor before closing.
Nearby sold comps map
Loading sold comps map…
Walkable amenities ~0.75 mi
Loading nearby amenities…
Taxation est. · year 1
- Rental income
- $23,278
- − Mortgage interest
- −$13,438
- − Property taxes
- −$2,418
- − Insurance
- −$1,200
- − Repairs & maintenance
- −$1,862
- − Management
- −$1,862
- − Depreciation
- −$6,979
- Taxable loss
- −$4,481
- Est. tax savings @ 24.0%
- +$1,075
- After-tax cash flow
- $751/yr
For passive investors: Depreciation is non-cash, so a rental often shows a tax loss while cash-flowing — sheltering income. Rental losses are passive: they offset passive income freely, and up to $25,000/yr can offset ordinary (W-2) income if you actively participate and your MAGI is under $100k (phasing out to $0 by $150k); unused losses carry forward. On sale, claimed depreciation is recaptured at up to 25%, and gains may owe capital-gains tax (a 1031 exchange can defer both). Figures are a year-1 estimate at your 24.0% rate — not tax advice; consult a CPA.
Schools (NCES district)
- District
- St. Tammany Parish
- NCES district ID
- 2201650
- Math proficiency
- 43% ▼ -32.00%
- Reading proficiency
- 55% ▼ -26.00%
- Median HH income
- $61,752
- Composite
- 43.04/100
- National rank
- #3098
- State rank
- #11 of 98 in LA
Livability — Slidell
- Score
- 70/100
- State rank
- #57
- US rank
- #7673
Category grades
Schools grade is shown separately in the Schools card above.
Census & demographics
- Census place
- Slidell, LA
- County
- Saint Tammany Parish · 228,296 people
- City population
- 95,511
- Metro
- New Orleans-Metairie, LA
- Population (ZIP)
- 39,034
- Household income
- $72,843
- Rent vs Own
- Severe rent burden
- 1331.0
Population outlook (St. Tammany County) Hauer SSP2
- Today (2025)
- 286,725 people
- By 2030
- 304,175 · +6.1%
- By 2040
- 336,203 · +17.3%
- By 2050
- 364,590 · +27.2%
- By 2075
- 433,362 · +51.1%
- By 2100
- 470,333 · +64.0%
Race, ethnicity, and origin ACS 2023
- Neighborhood character
- Predominantly White (66%)
- Race & ethnicity
- White 66% Black 17% Two or more races 10% Hispanic / Latino 9% Native American 2% Asian 1%
- Hispanic origin (detail)
- Mexican 3% Puerto Rican 1%
- Common ancestry
- Lithuanian 15% Slovak 2% Romanian 1%
- Foreign-born
- 3% · Canada, Vietnam
- Languages at home
- 93% English-only · Spanish 5% Vietnamese 1%
Political lean MEDSL · St. Tammany
- 2024 margin
- Solid R (+43.8) · D 27.3% · R 71.1% · Other 1.6%
- 2008→2024 swing
- +9.6pp toward D · 2008: -53.4pp · 2024: -43.8pp
- All cycles
- 2024: R+43.8 2020: R+44.2 2016: R+50.8 2012: R+52.2 2008: R+53.4
Not yet ingested
- Civics
- —
Market trends
- HPI YoY
- ▼ -173.60%
- Current HPI
- 147.4749
- Rent YoY
- ▲ 1.47%
- Metro
- New Orleans-Metairie, LA
- State GDP YoY
- ▲ 3.29%
- F500 in state
- 10
Industry mix (Fortune 500 HQ in LA)
| Industry | F500 HQs | Revenue |
|---|---|---|
| Telecommunications | 2 | $23B |
|
||
| Utilities | 1 | $12B |
|
||
| Wholesale / Distribution | 1 | $5B |
|
||
| Advertising | 1 | $2B |
|
||
Price history
+69.1% since first listed25 events — show timeline
- 2026-04-22 Pending — AcadianaMLS
- 2026-04-22 Pending — GBRMLS
- 2026-02-06 Listed $239,900 GBRMLS
- 2026-02-06 Listed $239,900 AcadianaMLS
- 2025-09-12 Sold (MLS) — GSREIN
- 2025-08-14 Pending — GSREIN
- 2025-08-05 Listed $147,000 AcadianaMLS
- 2025-08-05 Listed $147,000 GSREIN
- 2025-08-05 Listed $147,000 AcadianaMLS
- 2020-02-21 Sold (Public Records) $167,000 Public Records
- 2020-02-21 Sold (MLS) — GSREIN
- 2020-01-21 Pending — GSREIN
- 2020-01-20 Relisted — GSREIN
- 2020-01-13 Pending — GSREIN
- 2019-12-05 Listed $169,900 GSREIN
- 2019-12-05 Listed $169,900 AcadianaMLS
- 2016-02-04 Listing Removed — GSREIN
- 2015-10-23 Listed $149,900 GSREIN
- 2015-10-23 Listed $149,900 AcadianaMLS
- 2011-05-17 Listed $134,900 GSREIN
- 2011-05-17 Listed $134,900 AcadianaMLS
- 2007-07-25 Sold (Public Records) $141,900 Public Records
- 2007-07-13 Sold (MLS) — GSREIN
- 2007-03-08 Listed $141,900 GSREIN
- 2007-03-08 Listed $141,900 AcadianaMLS
Property tax history
+0.7%/yrLatest (2025): $2,418 · -6.2% YoY. Source: county tax records.
Cash-flow waterfall
monthlySold comps — $/sqft
last 12 mo · ≤1 miLoading sold comps…