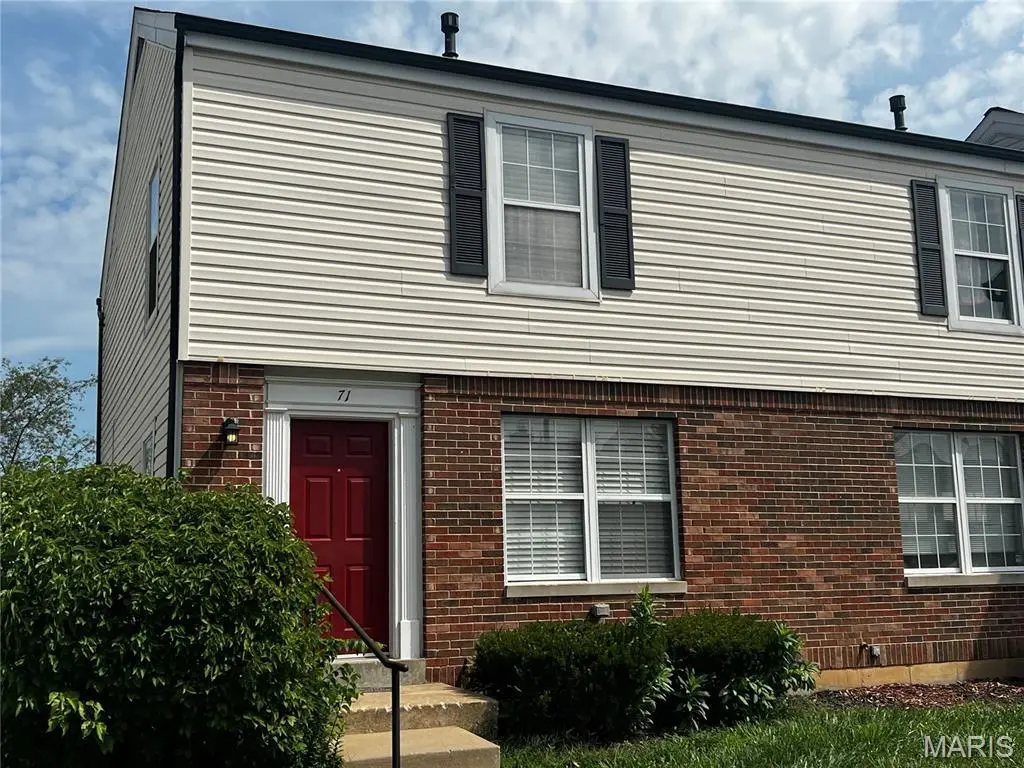
71 Woodlake Unit A · Lake St. Louis, MO
Flood risk 1/10 · Minimal
- FEMA flood zone
- X (unshaded)
- Chance of flooding over 30 yrs
- 0.0%
- Est. flood insurance / yr
- $473 – $860
Fire risk 1/10 · Minimal
- Est. fire insurance / yr
- $1,054 – $1,958
Heat risk 5/10 · Moderate
- Hot days now (above 107°F)
- 7 days/yr
- Hot days in 30 yrs
- 20 days/yr
Wind risk 2/10 · Minimal
- Chance of severe wind over 30 yrs
- 1.0%
Air-quality risk 1/10 · Minimal
- Unhealthy air days now
- 0 days/yr
- Unhealthy air days in 30 yrs
- 0 days/yr
Risk factors via First Street. Map © Google.
Why this score? — see what drove the C+ grade
The composite is a weighted blend of 9 inputs, each scored 0–100. Each bar is that input's sub-score; the figure is the points it added to the 100-point composite (weight × sub-score).
- Cash flow +23.0/30.0
- ARV discount +11.9/15.0
- DSCR +7.4/10.0
- 1% rule +5.6/10.0
- Schools +4.3/10.0
- Rent growth +3.6/5.0
- Livability +2.5/5.0
- Condition / age +2.5/5.0
- Appreciation +0.0/10.0
$179,900
🖨 Deal sheet 📄 Offer letter ✓ Due diligence
Listing remarks
This is a tenant occupied 2-bedroom, 1.5 bedroom townhouse with a possible 3rd bedroom in the finished lower level. This property has full Lake St Louis lake rights. Do not disturb tenant. No showings without an accepted contract.
Key facts
- Built 1984
- Listed 35 days
Tags
Neighborhood map
What this means for you Summary
Snapshot
- This is a 2-bed/1.5-bath townhouse listed at $180k.
Deal economics
- At list price, monthly cash flow is $319 ($4k/yr) — positive.
- The deal already cash-flows at list — no discount required.
- Meets the 1% rule at list price ($2k rent vs $180k).
- Recommended offer: $175k (3.0% below list) — sets the bar for market timing.
- Cap rate 8.4% vs local median 3.1% in Lake St. Louis — top-decile yield for the area; either an underpriced asset or a hidden risk that comps aren't pricing in. Stress-test before assuming the spread holds.
Location & tenants
- Location reads: area grade C — affects rentability + tenant quality, not the cash-flow math above.
- Wentzville R-IV (suburban): math 44% / reading 52% proficiency, ranked #32 of 324 in MO (top 10%) — families likely to look elsewhere, expect single-tenant / working-renter base with shorter leases; only 18% free/reduced lunch — higher-income household profile.
- Zoned schools: Duello Elem. (math 43% / reading 55%, grade D, #331 of 1,115 statewide, top 30%, 644 students, 3% FRL); Timberland High (math 36% / reading 63%, grade D, #124 of 521 statewide, top 28%, 1,676 students, 13% FRL).
- Market conditions: Rents rising fast (+4.2%/yr); 230 active listings in the ZIP; 3 comparable units currently listed for rent nearby; rentals leasing fast (median 2d on market — plan ~1-2 weeks tenant-placement turnaround); high-income renter base; 2,021 units permitted in St. Charles County in 2024 (568 in 5+ unit buildings).
- This rent is only 17% of the median local income ($138k/yr) — well below the 30% rent-burden line; pricing power to push rent on renewal without tenant pushback.
Forward outlook
- Local home prices are declining (-3.0%/yr); year-one equity from $1k of loan paydown is wiped out by about $5k of value loss. Plan a longer hold.
- St. Charles County population projected at +22% by 2050 — long-run rental-demand tailwind backs the buy-and-hold thesis.
Negotiation context
- It's been on market 35 days — a 3% lower offer ($175k) is reasonable based on typical stale-listing flexibility.
- Current owner paid $77k; list at $180k implies a 134% gain — meaningful room to come down on a strong offer.
Risks & watch-outs
- Climate carrying-cost: extreme-heat days projected 7→20/yr by 2055 (HVAC capex compounding) — expect insurance premiums to compound above CPI over the hold.
Questions for the listing agent
- It's been on market 35 days. Have you received any prior offers? Is the seller open to a 3% concession, seller financing, or rate buy-down credit?
- Is there a deadline driving the sale (1031 exchange, divorce, estate, relocation)? That informs how much negotiation room exists.
- What's the average days-on-market for RENTAL listings here right now (not sales)? A rising rental-DOM trend means longer vacancies and softer asking-rent achievability than the comps imply.
- What's the recent tenant-quality profile in this submarket — average credit score on applications, eviction rate, late-payment / NSF rate, and stable-employment percentage? A property-management company in the area should have these aggregated.
- How much new for-sale + rental construction is in the pipeline within 1–3 miles? Heavy new supply typically softens prices + rents 12–24 months out; constrained supply supports both.
Investment metrics
- 1% rule
- 1.06% ✓
- Cap rate
- 8.42%
- Cash-on-cash
- 7.59%
- DSCR
- 1.34
- GRM
- 7.9
CMA / ARV
- ARV (on-the-fly)
- $199,424
- Comps found
- 12
Show comp detail 12 sales within ~0.75 mi
| Address | Dist | Beds/Ba | Sqft | Sold | Price | $/sf | Match |
|---|---|---|---|---|---|---|---|
| 39 Woodlake Ct Unit D | 0.03mi | 2/1.5 | 1,240 (+2%) | 8mo | $139,500 | $113 | 89 |
| 73 Woodlake Ct Unit E | 0.02mi | 2/1.5 | 1,216 (0%) | 18mo | $175,000 | $144 | 84 |
| 65 Woodlake Ct Unit D | 0.01mi | 2/2.5 | 1,216 (0%) | 22mo | $150,000 | $123 | 77 |
| 120 Homeshire Dr #10 | 0.46mi | 2/2.5 | 1,256 (+3%) | 4mo | $213,000 | $170 | 66 |
| 122 Homeshire Dr #11 | 0.45mi | 2/2.5 | 1,256 (+3%) | 5mo | $225,000 | $179 | 65 |
| 118 Homeshire Dr | 0.46mi | 2/2.5 | 1,256 (+3%) | 5mo | $225,000 | $179 | 65 |
| 122 Homeshire Dr | 0.45mi | 2/2.5 | 1,256 (+3%) | 11mo | $212,000 | $169 | 60 |
| 108 Homeshire Dr | 0.46mi | 2/2.5 | 1,256 (+3%) | 14mo | $209,900 | $167 | 58 |
| 2202 Gascony Dr #2202 | 0.61mi | 2/1.5 | 1,162 (-4%) | 11mo | $165,000 | $142 | 55 |
| 78 Lemans Ct #78 | 0.69mi | 3/2.0 (+1) | 1,152 (-5%) | 2mo | $119,900 | $104 | 50 |
| 2206 Gascony Dr | 0.59mi | 2/1.5 | 1,396 (+15%) | 5mo | $149,900 | $107 | 44 |
| 104 Homeshire Dr | 0.46mi | 3/2.5 (+1) | 1,376 (+13%) | 19mo | $225,000 | $164 | 32 |
Match score weights: distance 35% · size 25% · config 20% · recency 20%. Top-matched comps best support the ARV.
Projected returns pro-forma
-3.0% appreciation · 4.21% rent growth · sell at horizon
- IRR
- -3.4%
- Equity multiple
- 0.87×
- Total profit
- $-6,515
- Equity at exit
- $26,824
- IRR
- 7.6%
- Equity multiple
- 1.60×
- Total profit
- $30,295
- Equity at exit
- $15,554
Cash invested: $50,372 (down + closing). Projections, not guarantees.
Landlord ↔ Tenant lean methodology
- Overall (STATE)
- 81 Strongly Landlord-Friendly
- State Missouri
- 81 Strongly Landlord-Friendly · R+10
- County
- — inherits STATE
- City
- — inherits STATE
ZIP-level market 63367
- Rents YoY
- 4.2%
- Active inventory
- 230
- Price-to-rent
- 7.9×
Monthly cashflow live
- Estimated rent
- $1,903 medium interval (Pro) →
- Mortgage (P&I)
- −$943
- Tax from tax record
- −$166 /mo · $1,994/yr
- Insurance
- −$75
- HOA
- −$0
- Vacancy / Maint / Mgmt
- −$400
- Net cashflow
- $319
Break-even live
UW: 25.0% down · 7.5% · 30yr · 1.5% tax · 5.0% vac · 8.0% maint · 8.0% mgmt
Financing live
Cash to close
- Down payment
- $44,975
- Closing costs
- $5,397
- Reserves months
- —
- Total cash needed
- —
Loan-product check · same deal, 3 products live
Conventional
25% down · 7.5% · 30yr
- Down + closing
- —
- Monthly P&I
- —
- Monthly cashflow
- —
- DSCR
- —
- Eligible?
- —
Personal DTI + credit; lowest rate.
DSCR
20% down · 8.5% · 30yr
- Down + closing
- —
- Monthly P&I
- —
- Monthly cashflow
- —
- DSCR
- —
- Eligible?
- —
No personal income docs; deal must DSCR.
Hard money
10% down · 12.0% · 12mo
- Down + closing
- —
- Monthly P&I
- —
- Monthly cashflow
- —
- DSCR
- —
- Eligible?
- —
Short-term bridge; refi at stabilization.
Rent comps 3 comps
| Address | Beds | Baths | Sqft | Rent | $/sqft | DOM | Units | Dist |
|---|---|---|---|---|---|---|---|---|
| 17 Warsen Ave Wentzville, MO | 3.0 | 1.0 | 864 | $1,875 | $2.17 | 14d | 1 | 0.65mi |
| 78 Lemans Ct #78 Lake St Louis, MO | 3.0 | 2.0 | 1152 | $1,695 | $1.47 | 1d | 1 | 0.69mi |
| 1000 Centinnial Club DR O'Fallon, MO | 2.0–3.0 | 2.0–2.5 | 1309 | $2,290 | $1.75 | 1d | 32 | 0.98mi |
Listing history 9 events
-
2026-06-18days on market $179,900 Active 35 DOM
-
2026-06-17status $179,900 Active 34 DOM
-
2026-04-23status Pending
-
2026-03-20$179,900 Active
-
2016-04-06soldstatus $77,000
-
2006-12-26soldstatus $93,000
-
2003-07-18soldstatus $88,000
-
1997-09-01soldstatus $49,000
-
1986-08-01soldstatus
ⓘ Source: listings_history table (triggers on properties + properties_extension) + one-shot
backfill from property_details.listing_events for pre-trigger history.
Tax reassessment forecast MO · Resets to sale price
- Current annual tax
- $1,994 · $166/mo
- Projected year-2 tax
- $1,994 · $166/mo
- Expected delta
- $0/yr ($0/mo · 0.0%)
ⓘ Screening estimate from a state-policy table — verify with the county assessor before closing.
Climate risk First Street
- Flood 1/10 Low FEMA zone X (unshaded) · 0% chance over 30 yrs
- Wildfire 1/10 Low
- Heat 5/10 Major 7 d/yr ≥107°F today · 20 d/yr by 30 yrs out
- Wind 2/10 Low 100% chance of damaging wind over 30 yrs
- Air quality 1/10 Low 0 unhealthy d/yr today · 0 by 30 yrs out
Nearby sold comps map
Loading sold comps map…
Walkable amenities ~0.75 mi
Loading nearby amenities…
Taxation est. · year 1
- Rental income
- $22,834
- − Mortgage interest
- −$10,077
- − Property taxes
- −$1,994
- − Insurance
- −$900
- − Repairs & maintenance
- −$1,827
- − Management
- −$1,827
- − Depreciation
- −$5,233
- Taxable income
- $977
- Est. tax owed @ 24.0%
- −$234
- After-tax cash flow
- $3,590/yr
For passive investors: Depreciation is non-cash, so a rental often shows a tax loss while cash-flowing — sheltering income. Rental losses are passive: they offset passive income freely, and up to $25,000/yr can offset ordinary (W-2) income if you actively participate and your MAGI is under $100k (phasing out to $0 by $150k); unused losses carry forward. On sale, claimed depreciation is recaptured at up to 25%, and gains may owe capital-gains tax (a 1031 exchange can defer both). Figures are a year-1 estimate at your 24.0% rate — not tax advice; consult a CPA.
Schools (NCES district)
- District
- Wentzville R-IV
- NCES district ID
- 2931650
- Math proficiency
- 44% ▼ -9.00%
- Reading proficiency
- 52% ▼ -7.00%
- Median HH income
- $74,961
- Composite
- 43.49/100
- National rank
- #2994
- State rank
- #32 of 324 in MO
Livability — Lake St. Louis
No livability data for this city. (Only ~50 U.S. cities are tracked.)
Census & demographics
- Census place
- Lake St. Louis, MO
- County
- Saint Charles County · 399,703 people
- City population
- 27,893
- Metro
- St. Louis, MO-IL
- Population (ZIP)
- 29,725
- Household income
- $137,648
- Rent vs Own
- Severe rent burden
- 184.0
Population outlook (St. Charles County) Hauer SSP2
- Today (2025)
- 437,857 people
- By 2030
- 461,707 · +5.4%
- By 2040
- 503,222 · +14.9%
- By 2050
- 534,684 · +22.1%
- By 2075
- 597,047 · +36.4%
- By 2100
- 609,682 · +39.2%
Race, ethnicity, and origin ACS 2023
- Neighborhood character
- Predominantly White (86%)
- Race & ethnicity
- White 86% Two or more races 6% Black 5% Hispanic / Latino 3% Asian 2%
- Common ancestry
- Lithuanian 4% Romanian 4% Italian 3%
- Foreign-born
- 4% · Canada
- Languages at home
- 96% English-only · Spanish 2% Other Indo-European 1%
Political lean MEDSL · St. Charles
- 2024 margin
- R (+17.0) · D 40.8% · R 57.8% · Other 1.4%
- 2008→2024 swing
- -7.2pp toward R · 2008: -9.7pp · 2024: -17.0pp
- All cycles
- 2024: R+17.0 2020: R+17.5 2016: R+26.4 2012: R+21.0 2008: R+9.7
Not yet ingested
- Civics
- —
Market trends
- HPI YoY
- ▼ -165.38%
- Current HPI
- 208.2774
- Rent YoY
- ▲ 4.21%
- Metro
- St. Louis, MO-IL
- State GDP YoY
- ▲ 1.84%
- F500 in state
- 20
Industry mix (Fortune 500 HQ in MO)
| Industry | F500 HQs | Revenue |
|---|---|---|
| Healthcare | 1 | $163B |
|
||
| Insurance | 1 | $21B |
|
||
| Industrial Technology | 1 | $17B |
|
||
| Retail | 1 | $16B |
|
||
| Industrial Distribution | 1 | $10B |
|
||
| Utilities | 1 | $9B |
|
||
Price history
+267.1% since first listed7 events — show timeline
- 2026-04-23 Pending — MARIS as Distributed by MLS Grid
- 2026-03-20 Listed $179,900 MARIS as Distributed by MLS Grid
- 2016-04-06 Sold (Public Records) $77,000 Public Records
- 2006-12-26 Sold (Public Records) $93,000 Public Records
- 2003-07-18 Sold (Public Records) $88,000 Public Records
- 1997-09-01 Sold (Public Records) $49,000 Public Records
- 1986-08-01 Sold (Public Records) — Public Records
Property tax history
+8.1%/yrLatest (2025): $1,994 · +5.6% YoY. Source: county tax records.
Cash-flow waterfall
monthlySold comps — $/sqft
last 12 mo · ≤1 miLoading sold comps…