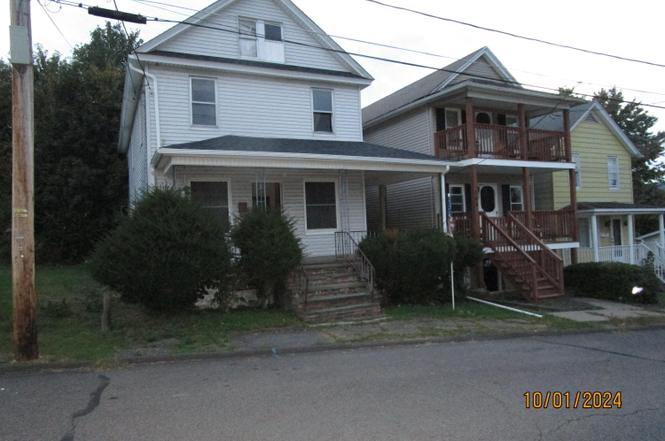
146 Buttonwood St · Jessup, PA
Flood risk 1/10 · Minimal
- FEMA flood zone
- X (unshaded)
- Chance of flooding over 30 yrs
- 0.0%
- Est. flood insurance / yr
- $473 – $860
Fire risk 1/10 · Minimal
- Est. fire insurance / yr
- $511 – $949
Heat risk 4/10 · Minor
- Hot days now (above 92°F)
- 8 days/yr
- Hot days in 30 yrs
- 19 days/yr
Wind risk 3/10 · Minor
- Chance of severe wind over 30 yrs
- 4.0%
Air-quality risk 2/10 · Minimal
- Unhealthy air days now
- 1 days/yr
- Unhealthy air days in 30 yrs
- 1 days/yr
Risk factors via First Street. Map © Google.
Why this score? — see what drove the B- grade
The composite is a weighted blend of 9 inputs, each scored 0–100. Each bar is that input's sub-score; the figure is the points it added to the 100-point composite (weight × sub-score).
- Cash flow +29.7/30.0
- DSCR +10.0/10.0
- 1% rule +8.3/10.0
- ARV discount +7.5/15.0
- Schools +3.9/10.0
- Livability +3.4/5.0
- Rent growth +2.5/5.0
- Condition / age +2.5/5.0
- Appreciation +0.0/10.0
$129,000
🖨 Deal sheet 📄 Offer letter ✓ Due diligence
Listing remarks
New Year time for a NEW HOME * * * * With a little hard work and TLC this could make a beautiful family home. All Hardwood flooring throughout the house along with some original wood work and BRAND NEW ROOF including some doors. Come and make this your own HOME!!!
Key facts
- Hardwood flooring
- Brand new roof
- Original wood work
Tags
Neighborhood map
What this means for you Summary
Snapshot
- This is a 3-bed/1.5-bath single-family listed at $129k.
Deal economics
- At list price, monthly cash flow is $469 ($6k/yr) — positive.
- The deal already cash-flows at list — no discount required.
- Meets the 1% rule at list price ($2k rent vs $129k).
- Recommended offer: $125k (3.0% below list) — sets the bar for market timing.
Location & tenants
- Location reads 67/100 on livability (#988 in PA) — a middle-class / working-renter tenant base. Strengths: crime A+, cost of living A+, housing A+; Watch: schools D-, amenities F, commute F.
- Valley View SD (rural): math 34% / reading 57% proficiency, ranked #269 of 539 in PA (top 50%) — families likely to look elsewhere, expect single-tenant / working-renter base with shorter leases.
- Market conditions: 15 active listings in the ZIP; 2 comparable units currently listed for rent nearby; 251 units permitted in Lackawanna County in 2024 (0 in 5+ unit buildings).
Forward outlook
- Local home prices are declining (-3.0%/yr); year-one equity from $892 of loan paydown is wiped out by about $4k of value loss. Plan a longer hold.
- Lackawanna County population projected to shrink 4% by 2050 — rents likely to lag national; underwrite the cash flow, not the appreciation.
- At projected returns (-3.0% appreciation + 3.0% rent growth), your $36k cash investment doubles in ~8 years — after that, you're playing with house money.
Negotiation context
- It's been on market 47 days — a 3% lower offer ($125k) is reasonable based on typical stale-listing flexibility.
- 8 sale attempts since 2y ago with the ask held roughly flat each time — persistent listings suggest the price (not the market) is what's stuck; bring a comps-based counter.
Risks & watch-outs
- Watch-outs: built in 1900 — expect roof / HVAC / electrical / plumbing capex.
Questions for the listing agent
- It's been on market 47 days. Have you received any prior offers? Is the seller open to a 3% concession, seller financing, or rate buy-down credit?
- Built in 1900 — when were the roof, HVAC, electrical panel, plumbing, and water heater last replaced?
- Is there a deadline driving the sale (1031 exchange, divorce, estate, relocation)? That informs how much negotiation room exists.
- Schools are D-rated, which usually means shorter tenancies and higher turnover. Who's the typical renter profile here, and what's been the actual vacancy rate?
- What's the average days-on-market for RENTAL listings here right now (not sales)? A rising rental-DOM trend means longer vacancies and softer asking-rent achievability than the comps imply.
- What's the recent tenant-quality profile in this submarket — average credit score on applications, eviction rate, late-payment / NSF rate, and stable-employment percentage? A property-management company in the area should have these aggregated.
- How much new for-sale + rental construction is in the pipeline within 1–3 miles? Heavy new supply typically softens prices + rents 12–24 months out; constrained supply supports both.
Investment metrics
- 1% rule
- 1.33% ✓
- Cap rate
- 10.65%
- Cash-on-cash
- 15.58%
- DSCR
- 1.69
- GRM
- 6.2
CMA / ARV
- ARV (on-the-fly)
- $293,968
- Comps found
- 12
Show comp detail 12 sales within ~0.75 mi
| Address | Dist | Beds/Ba | Sqft | Sold | Price | $/sf | Match |
|---|---|---|---|---|---|---|---|
| 110 Morgan St | 0.21mi | 4/1.5 (+1) | 1,818 (-6%) | 4mo | $285,000 | $157 | 72 |
| 174 Constitution Ave | 0.04mi | 4/2.0 (+1) | 2,095 (+8%) | 7mo | $275,000 | $131 | 72 |
| 302 Main St | 0.28mi | 3/2.0 | 1,810 (-6%) | 6mo | $260,000 | $144 | 69 |
| 133 Olga St | 0.39mi | 3/1.5 | 1,865 (-4%) | 9mo | $245,795 | $132 | 68 |
| 114 Olga St | 0.31mi | 3/2.0 | 1,880 (-3%) | 13mo | $265,000 | $141 | 68 |
| 325 Hickory St | 0.30mi | 3/2.0 | 2,066 (+7%) | 10mo | $315,000 | $152 | 64 |
| 226 Cherry St | 0.25mi | 2/1.5 (-1) | 1,788 (-8%) | 10mo | $223,000 | $125 | 62 |
| 125 River St | 0.07mi | 4/2.5 (+1) | 2,108 (+9%) | 15mo | $235,500 | $112 | 60 |
| 625 River St | 0.28mi | 3/1.5 | 1,694 (-12%) | 13mo | $295,000 | $174 | 56 |
| 316 Bridge St | 0.38mi | 4/1.5 (+1) | 1,707 (-12%) | 5mo | $264,894 | $155 | 54 |
| 403 Hill St | 0.44mi | 3/2.0 | 1,730 (-10%) | 8mo | $315,000 | $182 | 53 |
| 405 Keystone Ave | 0.62mi | 3/3.0 | 2,150 (+11%) | 11mo | $385,000 | $179 | 37 |
Match score weights: distance 35% · size 25% · config 20% · recency 20%. Top-matched comps best support the ARV.
Projected returns pro-forma
-3.0% appreciation · 3.0% rent growth · sell at horizon
- IRR
- 6.4%
- Equity multiple
- 1.25×
- Total profit
- $8,981
- Equity at exit
- $19,234
- IRR
- 15.8%
- Equity multiple
- 2.28×
- Total profit
- $46,374
- Equity at exit
- $11,154
Cash invested: $36,120 (down + closing). Projections, not guarantees.
Landlord ↔ Tenant lean methodology
- Overall (STATE)
- 62 Landlord-Friendly
- State Pennsylvania
- 62 Landlord-Friendly · EVEN
- County
- — inherits STATE
- City
- — inherits STATE
ZIP-level market 18434
- Home prices YoY
- -19.9%
- Active inventory
- 15
- Price-to-rent
- 6.2×
Monthly cashflow live
- Estimated rent
- $1,722 medium interval (Pro) →
- Mortgage (P&I)
- −$676
- Tax est. 1.5%
- −$161 /mo · $1,935/yr
- Insurance
- −$54
- HOA
- −$0
- Vacancy / Maint / Mgmt
- −$362
- Net cashflow
- $469
Break-even live
UW: 25.0% down · 7.5% · 30yr · 1.5% tax · 5.0% vac · 8.0% maint · 8.0% mgmt
Financing live
Cash to close
- Down payment
- $32,250
- Closing costs
- $3,870
- Reserves months
- —
- Total cash needed
- —
Loan-product check · same deal, 3 products live
Conventional
25% down · 7.5% · 30yr
- Down + closing
- —
- Monthly P&I
- —
- Monthly cashflow
- —
- DSCR
- —
- Eligible?
- —
Personal DTI + credit; lowest rate.
DSCR
20% down · 8.5% · 30yr
- Down + closing
- —
- Monthly P&I
- —
- Monthly cashflow
- —
- DSCR
- —
- Eligible?
- —
No personal income docs; deal must DSCR.
Hard money
10% down · 12.0% · 12mo
- Down + closing
- —
- Monthly P&I
- —
- Monthly cashflow
- —
- DSCR
- —
- Eligible?
- —
Short-term bridge; refi at stabilization.
Rent comps 2 comps
| Address | Beds | Baths | Sqft | Rent | $/sqft | DOM | Units | Dist |
|---|---|---|---|---|---|---|---|---|
| 319 Union St Peckville, PA | 3.0 | 1.5 | 1400 | $1,695 | $1.21 | 13d | 1 | 0.26mi |
| 421 Academy St Unit 1 Peckville, PA | 3.0 | 1.0 | 2135 | $1,800 | $0.84 | 13d | 1 | 0.93mi |
Listing history 14 events
-
2026-04-02soldstatus $115,000
-
2026-02-17status Pending
-
2025-12-29$129,000 Active
-
2025-08-23status Pending
-
2025-08-22historical
-
2025-06-03status Pending
-
2025-04-27status Active
-
2025-02-14status Active
-
2024-12-30status Active
-
2024-12-14status Active
-
2024-11-15status Active
-
2024-11-01$129,000 Active
-
2024-10-11$129,000 Active
-
2024-08-16soldstatus $65,000
ⓘ Source: listings_history table (triggers on properties + properties_extension) + one-shot
backfill from property_details.listing_events for pre-trigger history.
Climate risk First Street
- Flood 1/10 Low FEMA zone X (unshaded) · 0% chance over 30 yrs
- Wildfire 1/10 Low
- Heat 4/10 Moderate 8 d/yr ≥92°F today · 19 d/yr by 30 yrs out
- Wind 3/10 Moderate 4% chance of damaging wind over 30 yrs
- Air quality 2/10 Low 1 unhealthy d/yr today · 1 by 30 yrs out
Nearby sold comps map
Loading sold comps map…
Walkable amenities ~0.75 mi
Loading nearby amenities…
Taxation est. · year 1
- Rental income
- $20,663
- − Mortgage interest
- −$7,226
- − Property taxes
- −$1,935
- − Insurance
- −$645
- − Repairs & maintenance
- −$1,653
- − Management
- −$1,653
- − Depreciation
- −$3,753
- Taxable income
- $3,798
- Est. tax owed @ 24.0%
- −$912
- After-tax cash flow
- $4,714/yr
For passive investors: Depreciation is non-cash, so a rental often shows a tax loss while cash-flowing — sheltering income. Rental losses are passive: they offset passive income freely, and up to $25,000/yr can offset ordinary (W-2) income if you actively participate and your MAGI is under $100k (phasing out to $0 by $150k); unused losses carry forward. On sale, claimed depreciation is recaptured at up to 25%, and gains may owe capital-gains tax (a 1031 exchange can defer both). Figures are a year-1 estimate at your 24.0% rate — not tax advice; consult a CPA.
Schools (NCES district)
- District
- Valley View SD
- NCES district ID
- 4224650
- Math proficiency
- 34% ▼ -10.00%
- Reading proficiency
- 57% ▼ -12.00%
- Median HH income
- $45,562
- Composite
- 38.54/100
- National rank
- #4174
- State rank
- #269 of 539 in PA
Livability — Jessup
- Score
- 67/100
- State rank
- #988
- US rank
- #10864
Category grades
Schools grade is shown separately in the Schools card above.
Census & demographics
- Census place
- Jessup, PA
- City population
- 4,019
- Population (ZIP)
- 4,019
Population outlook (Lackawanna County) Hauer SSP2
- Today (2025)
- 210,652 people
- By 2030
- 208,623 · -1.0%
- By 2040
- 203,980 · -3.2%
- By 2050
- 201,069 · -4.5%
- By 2075
- 205,026 · -2.7%
- By 2100
- 210,851 · +0.1%
Race, ethnicity, and origin ACS 2023
- Neighborhood character
- Predominantly White (82%)
- Race & ethnicity
- White 82% Two or more races 16% Hispanic / Latino 10%
- Hispanic origin (detail)
- Puerto Rican 9%
- Common ancestry
- Romanian 23% Scotch-Irish 10% Dutch 2%
- Foreign-born
- 2% · Canada
- Languages at home
- 93% English-only · Spanish 5% Other Indo-European 2% Tagalog/Filipino 1%
Political lean MEDSL · Lackawanna
- 2024 margin
- Toss-up / Even · D 51.0% · R 48.3%
- 2008→2024 swing
- -23.2pp toward R · 2008: 26.0pp · 2024: 2.8pp
- All cycles
- 2024: D+2.8 2020: D+8.4 2016: D+3.4 2012: D+27.4 2008: D+26.0
Not yet ingested
- Civics
- —
Market trends
- HPI YoY
- ▼ -46.04%
- Current HPI
- 184.8942
- Rent YoY
- —
- Metro
- —
- State GDP YoY
- ▲ 1.68%
- F500 in state
- 34
Industry mix (Fortune 500 HQ in PA)
| Industry | F500 HQs | Revenue |
|---|---|---|
| Healthcare | 2 | $309B |
|
||
| Insurance | 2 | $27B |
|
||
| Telecommunications / Media | 1 | $124B |
|
||
| Industrial Distribution | 1 | $22B |
|
||
| Financial Services | 1 | $20B |
|
||
| Chemicals / Materials | 1 | $18B |
|
||
Price history
+76.9% since first listed14 events — show timeline
- 2026-04-02 Sold (Public Records) $115,000 Public Records
- 2026-02-17 Pending — PMAR
- 2025-12-29 Listed $129,000 PMAR
- 2025-08-23 Pending — PMAR
- 2025-08-22 Delisted — PMAR
- 2025-06-03 Pending — PMAR
- 2025-04-27 Relisted — PMAR
- 2025-02-14 Relisted — PMAR
- 2024-12-30 Relisted — PMAR
- 2024-12-14 Relisted — PMAR
- 2024-11-15 Relisted — PMAR
- 2024-11-01 Listed $129,000 GSBR as distributed by MLS GRID
- 2024-10-11 Listed $129,000 PMAR
- 2024-08-16 Sold (Public Records) $65,000 Public Records
Property tax history
+38.4%/yrLatest (2026): $45,848 · +2796.1% YoY. Source: county tax records.
Cash-flow waterfall
monthlySold comps — $/sqft
last 12 mo · ≤1 miLoading sold comps…