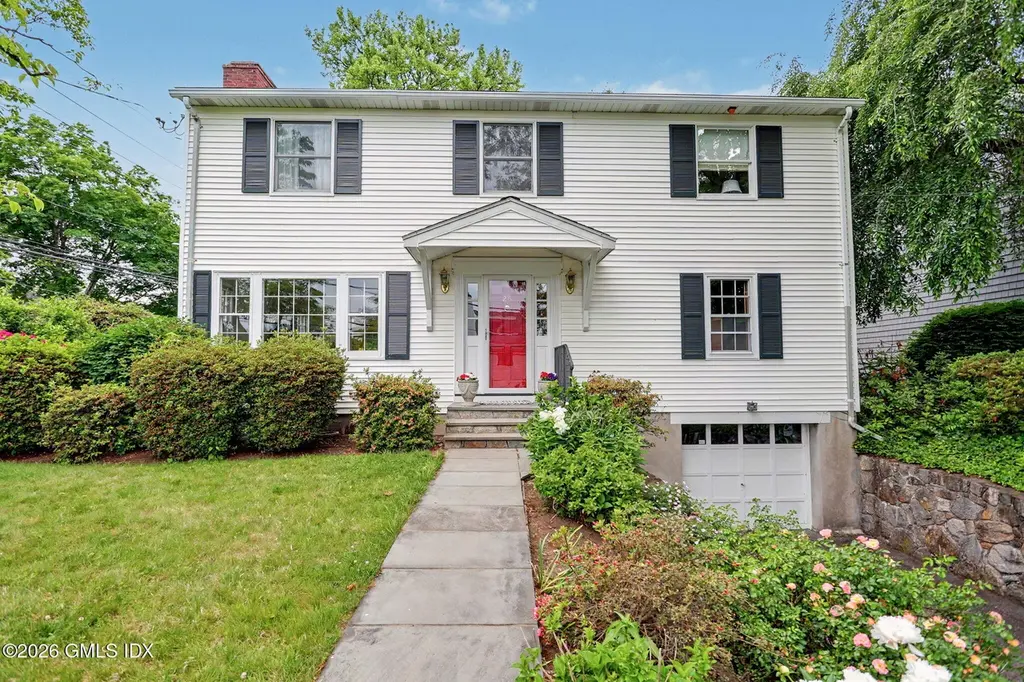
26 Linwood Ave · Riverside, CT
Flood risk 1/10 · Minimal
- FEMA flood zone
- X (unshaded)
- Chance of flooding over 30 yrs
- 0.0%
- Est. flood insurance / yr
- $473 – $860
Fire risk 1/10 · Minimal
- Est. fire insurance / yr
- $829 – $1,539
Heat risk 6/10 · Moderate
- Hot days now (above 98°F)
- 7 days/yr
- Hot days in 30 yrs
- 15 days/yr
Wind risk 6/10 · Moderate
- Chance of severe wind over 30 yrs
- 73.0%
Air-quality risk 6/10 · Moderate
- Unhealthy air days now
- 9 days/yr
- Unhealthy air days in 30 yrs
- 13 days/yr
Risk factors via First Street. Map © Google.
Why this score? — see what drove the D grade
The composite is a weighted blend of 9 inputs, each scored 0–100. Each bar is that input's sub-score; the figure is the points it added to the 100-point composite (weight × sub-score).
- ARV discount +11.4/15.0
- Appreciation +8.6/10.0
- Cash flow +6.9/30.0
- Schools +6.6/10.0
- Livability +3.8/5.0
- Rent growth +2.5/5.0
- Condition / age +2.5/5.0
- DSCR +1.1/10.0
- 1% rule +0.8/10.0
$2,425,000
🖨 Deal sheet (PDF) 📄 Offer letter ✓ Due diligence
Listing remarks
Terrific Riverside home in top location just 0.5 miles from Old Greenwich Village, parks & train. This sun-filled 4-5 bedroom Colonial offers a level backyard & inviting living spaces throughout. The main level features a formal dining room, living room with fireplace, bright family room, eat-in kitchen, and a first-floor den that can serve as a 5th bedroom with a nearby full bath. Upstairs, the spacious primary suite includes an ensuite bath and walk-in closet, joined by three additional bedrooms and a full bath. The lower level offers flexible finished space, laundry & storage. Enjoy outdoor dining on the patio overlooking garden & fenced yard. Int'l School @ Dund
Key facts
- 8,276 sq ft lot
- Garage
- Built 1950
Property features AI
Exterior
- Parking: One garage space
- Utilities: Public water
- Home design: Single family residence; Built in 1950
- Construction: Clapboard siding; Asphalt roof
- Exterior features: Terrace; Level lot
Interior
- Bathrooms: Three full bathrooms
- Heating & cooling: Central air conditioning; Natural gas heating with forced air
- Interior features: Kitchen island; Eat-in kitchen; Partial, partially finished basement; One fireplace
Neighborhood map
What this means for you Summary
Snapshot
- This is a 4-bed/3.0-bath single-family listed at $2.42M.
Deal economics
- At list price, monthly cash flow is $-4k ($-44k/yr) — negative.
- To cash-flow at today's rent, offer at most $1.78M (26.4% below list).
- To meet the 1% rule (rent ≥ 1% of price), the offer needs to be $1.41M (41.7% below list).
- Recommended offer: $1.41M (41.7% below list) — sets the bar for 1% rule.
- Cap rate 4.5% vs local median 3.6% in Riverside — meaningfully above typical; check what's discounted (condition, days-on-market, listing class) to confirm the premium yield is real.
Location & tenants
- Location reads 76/100 on livability (#60 in CT, #3,626 nationally) — a middle-class / working-renter tenant base. Strengths: crime A+, commute A+, employment A+; Watch: amenities F, cost of living F.
- Greenwich School District (suburban): math 64% / reading 73% proficiency, ranked #12 of 153 in CT (top 8%) — acceptable for families but not a draw, mixed tenant base, ~2y average lease; only 11% free/reduced lunch — higher-income household profile.
- Zoned schools: International School At Dundee (math 77% / reading 82%, grade A, #22 of 553 statewide, top 4%, 341 students, 8% FRL); Eastern Middle School (math 75% / reading 81%, grade A+, #2 of 175 statewide, top 1%, 784 students, 6% FRL) — zoned schools at 7% FRL track the district average.
- Market conditions: 45 active listings in the ZIP; 40 comparable units currently listed for rent nearby; rentals at typical pace (median 25d on market — plan ~3-4 weeks tenant-placement turnaround); 42% of comp listings sitting > 30 days — soft ceiling on asking rent; 1,151 units permitted in Western Connecticut Planning Region in 2024 (714 in 5+ unit buildings).
Forward outlook
- In year one you build about $193k of equity ($17k loan paydown + $177k appreciation (7.3% local appreciation)).
- By year 2, paydown + projected appreciation supports a ~$309k cash-out refi (75% LTV) — recoverable capital for the next deal without selling this one.
Negotiation context
- Only 8 days on market — expect competitive offers; lowballing is unlikely to land.
- 3 sale attempts since 32y ago; this cycle's ask is 305% above the opening price — seller raised mid-cycle; expect resistance to lowballs.
- Current owner paid $525k; list at $2.42M implies a 362% gain — meaningful room to come down on a strong offer.
Risks & watch-outs
- Watch-outs: built in 1950 — expect roof / HVAC / electrical / plumbing capex.
- Climate carrying-cost: major wind risk, 73% chance of damaging wind over 30y; extreme-heat days projected 7→15/yr by 2055 (HVAC capex compounding) — expect insurance premiums to compound above CPI over the hold.
Questions for the listing agent
- What do current leases actually rent for vs. the listed asking? Can we see a recent rent roll and the last 12 months of T-12 income?
- Built in 1950 — when were the roof, HVAC, electrical panel, plumbing, and water heater last replaced?
- Is there a deadline driving the sale (1031 exchange, divorce, estate, relocation)? That informs how much negotiation room exists.
- Schools are A-rated — typically a magnet for longer-tenancy family renters. What's the average tenant stay here, and is there a school-zone premium baked into asking?
- The area grade is low — what's the realistic commute time and amenity access for the typical tenant pool here? Any planned neighborhood developments (good or bad) we should know about?
- What's the average days-on-market for RENTAL listings here right now (not sales)? A rising rental-DOM trend means longer vacancies and softer asking-rent achievability than the comps imply.
- What's the recent tenant-quality profile in this submarket — average credit score on applications, eviction rate, late-payment / NSF rate, and stable-employment percentage? A property-management company in the area should have these aggregated.
- How much new for-sale + rental construction is in the pipeline within 1–3 miles? Heavy new supply typically softens prices + rents 12–24 months out; constrained supply supports both.
Investment metrics
- 1% rule
- 0.58% ✗
- Cap rate
- 4.50%
- Cash-on-cash
- -6.41%
- DSCR
- 0.71
- GRM
- 14.3
CMA / ARV
- ARV (on-the-fly)
- $2,653,296
- Comps found
- 12
Show comp detail 12 sales within ~0.75 mi
| Address | Dist | Beds/Ba | Sqft | Sold | Price | $/sf | Match |
|---|---|---|---|---|---|---|---|
| 153 Lockwood Rd | 0.04mi | 5/3.5 (+1) | 2,729 (+3%) | 1mo | $2,735,000 | $1,002 | 85 |
| 29 Sound Beach Ave | 0.12mi | 4/3.5 | 2,424 (-8%) | 3mo | $2,200,000 | $908 | 76 |
| 143 Lockwood Rd | 0.05mi | 4/2.5 | 2,367 (-11%) | 6mo | $2,425,000 | $1,025 | 73 |
| 134 Lockwood Rd | 0.13mi | 4/3.5 | 2,879 (+9%) | 10mo | $3,150,000 | $1,094 | 69 |
| 10 Verona Dr | 0.10mi | 4/3.5 | 3,037 (+15%) | 2mo | $4,000,000 | $1,317 | 67 |
| 25 Summit Rd | 0.53mi | 4/3.0 | 2,489 (-6%) | 3mo | $2,510,000 | $1,008 | 62 |
| 2 Midbrook Ln | 0.21mi | 4/3.5 | 3,026 (+14%) | 8mo | $2,575,000 | $851 | 58 |
| 23 Silver Beech Rd | 0.58mi | 4/2.0 | 2,511 (-5%) | 6mo | $1,660,000 | $661 | 55 |
| 63 N Sound Beach Ave | 0.60mi | 4/6.5 | 2,704 (+2%) | 2mo | $2,500,000 | $925 | 53 |
| 10 Maple Dr | 0.41mi | 3/2.0 (-1) | 2,290 (-14%) | 1mo | $1,258,000 | $549 | 49 |
| 22 Summit Rd | 0.55mi | 4/2.5 | 3,022 (+14%) | 5mo | $3,100,000 | $1,026 | 45 |
| 39 Riverside Ave | 0.72mi | 5/4.5 (+1) | 2,775 (+5%) | 8mo | $1,995,000 | $719 | 41 |
Match score weights: distance 35% · size 25% · config 20% · recency 20%. Top-matched comps best support the ARV.
Projected returns pro-forma
7.28% appreciation · 3.0% rent growth · sell at horizon
- IRR
- 13.4%
- Equity multiple
- 1.97×
- Total profit
- $657,314
- Equity at exit
- $1,725,711
- IRR
- 13.6%
- Equity multiple
- 4.06×
- Total profit
- $2,077,872
- Equity at exit
- $3,319,896
Cash invested: $679,000 (down + closing). Projections, not guarantees.
Landlord ↔ Tenant lean methodology
- Overall (STATE)
- 27 Tenant-Leaning
- State Connecticut
- 27 Tenant-Leaning · D+7
- County
- — inherits STATE
- City
- — inherits STATE
ZIP-level market 06878
- Home prices YoY
- 3.8%
- Active inventory
- 45
- Price-to-rent
- 14.3×
Monthly cashflow live
- Estimated rent
- $14,132 high interval (Pro) →
- Mortgage (P&I)
- −$12,717
- Tax from tax record
- −$1,064 /mo · $12,774/yr
- Insurance
- −$1,010
- HOA
- −$0
- Vacancy / Maint / Mgmt
- −$2,968
- Net cashflow
- $-3,627
Break-even live
Sensitivity live
| Price | -10% $-2,255 | -5% $-2,941 | +0% $-3,627 | +5% $-4,314 | +10% $-5,000 |
|---|---|---|---|---|---|
| Rent | -10% $-4,744 | -5% $-4,186 | +0% $-3,627 | +5% $-3,069 | +10% $-2,511 |
| Rate | -1.0pp $-2,406 | -0.5pp $-3,011 | base $-3,627 | +0.5pp $-4,256 | +1.0pp $-4,895 |
UW: 25.0% down · 7.5% · 30yr · 1.5% tax · 5.0% vac · 8.0% maint · 8.0% mgmt
Financing live
Cash to close
- Down payment
- $606,250
- Closing costs
- $72,750
- Reserves months
- —
- Total cash needed
- —
Loan-product check · same deal, 3 products live
Conventional
25% down · 7.5% · 30yr
- Down + closing
- —
- Monthly P&I
- —
- Monthly cashflow
- —
- DSCR
- —
- Eligible?
- —
Personal DTI + credit; lowest rate.
DSCR
20% down · 8.5% · 30yr
- Down + closing
- —
- Monthly P&I
- —
- Monthly cashflow
- —
- DSCR
- —
- Eligible?
- —
No personal income docs; deal must DSCR.
Hard money
10% down · 12.0% · 12mo
- Down + closing
- —
- Monthly P&I
- —
- Monthly cashflow
- —
- DSCR
- —
- Eligible?
- —
Short-term bridge; refi at stabilization.
Rent comps 40 comps
| Address | Beds | Baths | Sqft | Rent | $/sqft | DOM | Units | Dist |
|---|---|---|---|---|---|---|---|---|
| 10 Durkin Pl Riverside, CT | 5.0 | 4.5 | 3245 | $17,500 | $5.39 | 44d | 1 | 0.08mi |
| 36 Center Dr Old Greenwich, CT | 3.0 | 2.5 | 3328 | $11,300 | $3.40 | 44d | 1 | 0.19mi |
| 8 Potter Dr Old Greenwich, CT | 4.0 | 3.0 | 1979 | $10,500 | $5.31 | 45d | 1 | 0.38mi |
| 1 Ernel Dr Riverside, CT | 5.0 | 3.5 | 2517 | $13,000 | $5.16 | 22d | 1 | 0.42mi |
| 143 Sound Beach Ave Old Greenwich, CT | 1.0–3.0 | 1.0–3.0 | 1269 | $12,985 | $10.23 | 0d | 1 | 0.42mi |
| 51 Forest Ave Old Greenwich, CT | 3.0 | 3.0 | 1737 | $8,150 | $4.69 | 4d | 2 | 0.50mi |
| 51 Forest Ave #26 Old Greenwich, CT | 3.0 | 3.0 | 2194 | $9,500 | $4.33 | 3d | 1 | 0.50mi |
| 51 Forest Ave #19 Old Greenwich, CT | 3.0 | 2.5 | 1946 | $8,500 | $4.37 | 44d | 1 | 0.50mi |
| 38 Sheephill Rd Riverside, CT | 3.0 | 2.5 | 2600 | $8,200 | $3.15 | 44d | 1 | 0.62mi |
| 25 Weston Hill Rd Riverside, CT | 3.0 | 3.0 | 2531 | $10,950 | $4.33 | 4d | 1 | 0.62mi |
| 21 Spring St Riverside, CT | 5.0 | 4.0 | 2924 | $18,000 | $6.16 | 44d | 1 | 0.65mi |
| 8 Perry Pl Riverside, CT | 4.0 | 3.0 | 2556 | $11,500 | $4.50 | 22d | 1 | 0.65mi |
| 34 Hassake Rd Old Greenwich, CT | 4.0 | 3.5 | 2943 | $16,000 | $5.44 | 44d | 1 | 0.70mi |
| 14 Shoalpoint Ln Riverside, CT | 4.0 | 2.5 | 2340 | $14,000 | $5.98 | 24d | 1 | 0.76mi |
| 44 Riverside Ln Riverside, CT | 3.0 | 3.5 | 2404 | $19,000 | $7.90 | 4d | 1 | 0.78mi |
| 1 Cary Rd Riverside, CT | 4.0 | 3.5 | 3300 | $13,500 | $4.09 | 44d | 1 | 0.83mi |
| 25 Buxton Ln Riverside, CT | 5.0 | 3.5 | 2780 | $12,995 | $4.67 | 24d | 1 | 0.85mi |
| 314 Sound Beach Ave Old Greenwich, CT | 4.0 | 2.5 | 3007 | $15,500 | $5.15 | 44d | 1 | 0.85mi |
| 6 Halsey Dr Old Greenwich, CT | 4.0 | 3.0 | 2490 | $8,500 | $3.41 | 15d | 1 | 0.86mi |
| 13 Lockwood Ave Old Greenwich, CT | 5.0 | 3.5 | 3275 | $22,000 | $6.72 | 44d | 1 | 0.91mi |
| 15 Shorelands Pl Old Greenwich, CT | 4.0 | 3.5 | 3271 | $19,000 | $5.81 | 22d | 1 | 0.93mi |
| 15 Shorelands Pl Old Greenwich, CT | 4.0 | 3.5 | 3271 | $19,000 | $5.81 | 20d | 1 | 0.93mi |
| 60 Lockwood Ave Old Greenwich, CT | 5.0 | 3.5 | 2987 | $17,500 | $5.86 | 3d | 1 | 0.94mi |
| 510 W Main St Unit 2ND FL Stamford, CT | 3.0 | 1.0 | 2027 | $3,150 | $1.55 | 4d | 1 | 0.95mi |
| 1 Crawford Ter Riverside, CT | 4.0 | 4.0 | 2819 | $18,000 | $6.39 | 22d | 1 | 0.98mi |
| 14 Rainbow Dr Riverside, CT | 5.0 | 3.5 | 3510 | $16,000 | $4.56 | 24d | 1 | 1.01mi |
| 25 Arnold St Old Greenwich, CT | 4.0 | 3.0 | 2490 | $10,500 | $4.22 | 24d | 1 | 1.02mi |
| 71 S Park Ave Old Greenwich, CT | 4.0 | 2.5 | 3723 | $17,500 | $4.70 | 44d | 1 | 1.03mi |
| 15 Lancer Rd Riverside, CT | 4.0 | 2.5 | 3031 | $8,889 | $2.93 | 24d | 1 | 1.03mi |
| 9 Grimes Rd Old Greenwich, CT | 5.0 | 3.5 | 2799 | $22,500 | $8.04 | 44d | 1 | 1.03mi |
| 30 Bayside Ter Riverside, CT | 4.0 | 3.5 | 3730 | $25,000 | $6.70 | 44d | 1 | 1.04mi |
| 78 River Rd #15 Cos Cob, CT | 3.0 | 3.5 | 2381 | $12,000 | $5.04 | 44d | 1 | 1.05mi |
| 78 River Rd #15 Cos Cob, CT | 3.0 | 2.5 | 2381 | $12,000 | $5.04 | 45d | 1 | 1.05mi |
| 24 Juniper Ln Riverside, CT | 4.0 | 3.5 | 2843 | $14,000 | $4.92 | 4d | 1 | 1.11mi |
| 26 Revere Rd Riverside, CT | 4.0 | 2.5 | 2383 | $13,900 | $5.83 | 11d | 1 | 1.13mi |
| 26 Revere Rd Riverside, CT | 4.0 | 2.5 | 2383 | $13,900 | $5.83 | 12d | 1 | 1.13mi |
| 11 Roosevelt Ave Old Greenwich, CT | 5.0 | 2.5 | 3430 | $21,000 | $6.12 | 44d | 1 | 1.15mi |
| 11 Roosevelt Ave Old Greenwich, CT | 5.0 | 2.5 | 3430 | $18,000 | $5.25 | 3d | 1 | 1.15mi |
| 6 Irvine Rd Old Greenwich, CT | 3.0 | 3.0 | 2066 | $12,500 | $6.05 | 4d | 1 | 1.15mi |
| 14 Cos Cob Ave Unit 3 Cos Cob, CT | 3.0 | 2.5 | 1900 | $6,500 | $3.42 | 44d | 1 | 1.19mi |
Listing history 11 events
-
2026-06-18status $2,425,000 Pending 8 DOM
-
2026-06-18days on market $2,425,000 Active 8 DOM
-
2026-06-17days on market $2,425,000 Active 7 DOM
-
2026-06-16days on market $2,425,000 Active 6 DOM
-
2026-06-15days on market $2,425,000 Active 5 DOM
-
2026-06-13statusdays on market $2,425,000 Active 3 DOM
-
2026-06-10days on market $2,425,000 Coming Soon 5 DOM
-
2026-06-09days on market $2,425,000 Coming Soon 4 DOM
-
2026-06-08days on market $2,425,000 Coming Soon 3 DOM
-
2026-06-07remarks 683-char remark
-
2026-06-07$2,425,000 Coming Soon 2 DOM
ⓘ Source: listings_history table (triggers on properties + properties_extension) + one-shot
backfill from property_details.listing_events for pre-trigger history.
Tax reassessment forecast CT · Partial reset (capped growth)
- Current annual tax
- $12,774 · $1,064/mo
- Projected year-2 tax
- $32,334 · $2,695/mo
- Expected delta
- +$19,560/yr (+$1,630/mo · 153.1%)
ⓘ Screening estimate from a state-policy table — verify with the county assessor before closing.
Climate risk First Street
- Flood 1/10 Low FEMA zone X (unshaded) · 0% chance over 30 yrs
- Wildfire 1/10 Low
- Heat 6/10 Major 7 d/yr ≥98°F today · 15 d/yr by 30 yrs out
- Wind 6/10 Major 73% chance of damaging wind over 30 yrs
- Air quality 6/10 Major 9 unhealthy d/yr today · 13 by 30 yrs out
Nearby sold comps map
Loading sold comps map…
Walkable amenities ~0.75 mi
Loading nearby amenities…
Taxation est. · year 1
- Rental income
- $169,589
- − Mortgage interest
- −$135,838
- − Property taxes
- −$12,774
- − Insurance
- −$12,125
- − Repairs & maintenance
- −$13,567
- − Management
- −$13,567
- − Depreciation
- −$70,545
- Taxable loss
- −$88,828
- Est. tax savings @ 24.0%
- +$21,319
- After-tax cash flow
- $-22,209/yr
For passive investors: Depreciation is non-cash, so a rental often shows a tax loss while cash-flowing — sheltering income. Rental losses are passive: they offset passive income freely, and up to $25,000/yr can offset ordinary (W-2) income if you actively participate and your MAGI is under $100k (phasing out to $0 by $150k); unused losses carry forward. On sale, claimed depreciation is recaptured at up to 25%, and gains may owe capital-gains tax (a 1031 exchange can defer both). Figures are a year-1 estimate at your 24.0% rate — not tax advice; consult a CPA.
Schools (NCES district)
- District
- Greenwich School District
- NCES district ID
- 0901710
- Math proficiency
- 64% ▼ -7.00%
- Reading proficiency
- 73% ▼ -5.00%
- Median HH income
- $129,257
- Composite
- 65.67/100
- National rank
- #461
- State rank
- #12 of 153 in CT
Livability — Riverside
- Score
- 76/100
- State rank
- #60
- US rank
- #3626
Category grades
Schools grade is shown separately in the Schools card above.
Census & demographics
- Census place
- Riverside, CT
- City population
- 8,446
- Population (ZIP)
- 8,446
Population outlook (Western Connecticut County) Hauer SSP2
- By 2040
- 685,031
Race, ethnicity, and origin ACS 2023
- Neighborhood character
- Diverse neighborhood (Simpson 0.57)
- Race & ethnicity
- White 62% Hispanic / Latino 16% Asian 13% Two or more races 12% Black 3% Native American 2%
- Hispanic origin (detail)
- Mexican 4% Salvadoran 5%
- Common ancestry
- Slovak 3% Italian 3% Lithuanian 3%
- Foreign-born
- 31% · Canada, Dominican Republic, China
- Languages at home
- 64% English-only · Spanish 16% Russian/Polish/Slavic 5% Other Indo-European 3%
Political lean MEDSL · Western Connecticut
- 2024 margin
- D (+19.1) · D 58.8% · R 39.7% · Other 1.6%
- All cycles
- 2024: D+19.1
Not yet ingested
- Civics
- —
Market trends
- HPI YoY
- ▲ 7.28%
- Current HPI
- 198.3808
- Rent YoY
- —
- Metro
- —
- State GDP YoY
- ▲ 1.06%
- F500 in state
- 38
Industry mix (Fortune 500 HQ in CT)
| Industry | F500 HQs | Revenue |
|---|---|---|
| Industrial Machinery | 4 | $38B |
|
||
| Insurance | 3 | $71B |
|
||
| Financial Services | 2 | $25B |
|
||
| Transportation / Logistics | 2 | $18B |
|
||
| Healthcare | 1 | $247B |
|
||
| Telecommunications | 1 | $55B |
|
||
Price history
+314.5% since first listed9 events — show timeline
- 2026-06-05 Coming Soon $2,425,000 GMLS
- 1996-07-22 Sold (MLS) $525,000 GMLS
- 1996-07-19 Sold (Public Records) $525,000 Public Records
- 1996-05-27 Listing Removed — Smart MLS
- 1995-05-31 Listed $599,000 GMLS
- 1995-05-23 Sold (MLS) — GMLS
- 1994-05-23 Listed $549,000 Smart MLS
- 1994-05-23 Listed $599,000 GMLS
- 1989-10-02 Sold (Public Records) $585,000 Public Records
Property tax history
+3.8%/yrLatest (2023): $12,774 · +0.9% YoY. Source: county tax records.
Cash-flow waterfall
monthlySold comps — $/sqft
last 12 mo · ≤1 miLoading sold comps…