45729 Buck Hewitt Rd · California, MD
Flood risk 1/10 · Minimal
- FEMA flood zone
- X (unshaded)
- Chance of flooding over 30 yrs
- 0.0%
- Est. flood insurance / yr
- $507 – $1,088
Fire risk 3/10 · Minor
- Est. fire insurance / yr
- $755 – $1,403
Heat risk 9/10 · Severe
- Hot days now (above 101°F)
- 7 days/yr
- Hot days in 30 yrs
- 17 days/yr
Wind risk 6/10 · Moderate
- Chance of severe wind over 30 yrs
- 70.0%
Air-quality risk 2/10 · Minimal
- Unhealthy air days now
- 1 days/yr
- Unhealthy air days in 30 yrs
- 2 days/yr
Risk factors via First Street. Map © Google.
Why this score? — see what drove the D grade
The composite is a weighted blend of 9 inputs, each scored 0–100. Each bar is that input's sub-score; the figure is the points it added to the 100-point composite (weight × sub-score).
- Cash flow +14.0/30.0
- ARV discount +10.7/15.0
- DSCR +4.3/10.0
- 1% rule +3.9/10.0
- Livability +3.7/5.0
- Schools +3.0/10.0
- Rent growth +2.5/5.0
- Condition / age +2.5/5.0
- Appreciation +0.0/10.0
$299,900
🖨 Deal sheet 📄 Offer letter ✓ Due diligence
Listing remarks
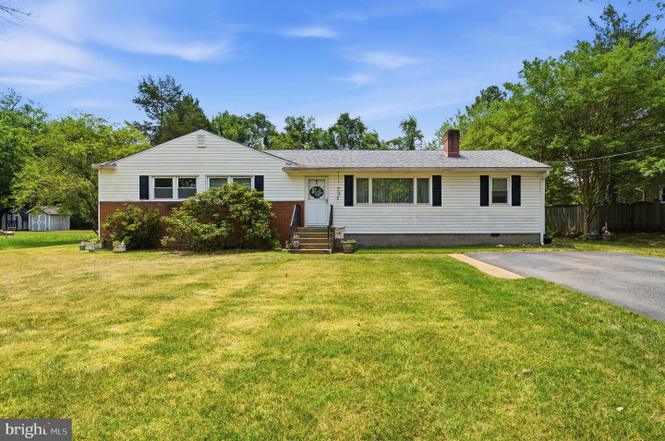
CHARMING!! 4-bedroom, 2-bath rancher offering approximately 1,680 square feet of comfortable single-level living. Inside, you'll find a spacious living room, a cozy family room with a fireplace, an open dining area, and an eat-in kitchen that provides plenty of space for everyday living and entertaining. The primary suite features a private full bath, while two additional bedrooms and a second full bath offer flexibility for family, guests, or a home office. Thoughtfully designed with multiple gathering spaces, this home provides room to spread out while maintaining a warm and inviting atmosphere. Step outside to enjoy the covered deck and patio overlooking the spacious backyard, creating t
Key facts
- Covered deck
- Spacious backyard
- Paved driveway
Tags
Property features AI
Finance
- Other: Not in a federal flood zone; Accessible features listed as 'Other'; Pets allowed with no pet restrictions; Ground rent payment: annually
Exterior
- Parking: Asphalt driveway; Driveway parking; 4 total garage and parking spaces; Driveway holds 4 cars
- Utilities: Public water; Public sewer; Broadband and cable internet available; Electric hot water; Oil heating fuel; Public utilities
- Home design: Detached property; Architectural shingle roof; Fee simple ownership; Property in good condition
- Construction: Vinyl siding and brick exterior; Composition (roof) / Architectural shingle; Crawl space foundation; Year built source: Assessor
- Exterior features: Backs to trees; Roofed outdoor living area; Deck(s); Porch(es); Shed on the property; Above- and below-grade structures noted
Interior
- Kitchen: Microwave; Electric oven/range; Range hood; Stove; Stainless steel appliances; Refrigerator; Kitchen designed for eat-in/table space
- Basement: No basement
- Bedrooms: 4 bedrooms on the main level; Rooms listed include living room, dining room, master bedroom, three additional bedrooms, kitchen, foyer, and two bathrooms
- Flooring: Carpet; Vinyl; Ceramic tile; Luxury vinyl plank
- Bathrooms: 2 full bathrooms (both on the main level); Master bathroom present
- Fireplace: One fireplace with mantel and insert
- Heating & cooling: Forced air heating; Oil-fired heating fuel; Central air conditioning; Ceiling fans; Electric cooling fuel; Electric hot water
- Interior features: Attic; Walk-in shower in a bathroom; Tub/shower; Ceiling fans; Formal dining room; Dining area; Family room off the kitchen; Traditional floor plan; Eat-in kitchen / table space; Master bathroom; Wood stove; Dry wall walls and ceilings; Storm door(s); Elevator
- Laundry & utility: Washer and dryer in unit; Main-floor laundry; Water heater included
Neighborhood map
What this means for you Summary
Snapshot
- This is a 4-bed/1.5-bath single-family listed at $300k.
Deal economics
- At list price, monthly cash flow is $40 ($478/yr) — positive.
- The deal already cash-flows at list — no discount required.
- To meet the 1% rule (rent ≥ 1% of price), the offer needs to be $267k (10.8% below list).
- Recommended offer: $267k (10.8% below list) — sets the bar for 1% rule.
- Cap rate 6.5% vs local median 4.3% in California — top-decile yield for the area; either an underpriced asset or a hidden risk that comps aren't pricing in. Stress-test before assuming the spread holds.
Location & tenants
- Location reads 73/100 on livability (#127 in MD) — a middle-class / working-renter tenant base. Strengths: employment A+, housing A+, health & safety A+; Watch: crime D+, amenities F, commute F.
- St. Mary'S County Public Schools (rural): math 23% / reading 38% proficiency, ranked #8 of 24 in MD (top 33%) — families likely to look elsewhere, expect single-tenant / working-renter base with shorter leases.
- Zoned schools: Greenview Knolls Elementary (math 12% / reading 17%, grade F, #477 of 860 statewide, top 59%, 412 students, 62% FRL); Esperanza Middle (math 18% / reading 41%, grade F, #67 of 225 statewide, top 32%, 875 students, 41% FRL); Great Mills High (math 42% / reading 55%, grade D, #111 of 222 statewide, top 50%, 1,779 students, 55% FRL) — zoned schools average 53% FRL vs 28% district-wide (25 pts higher); higher-poverty schools than district average — tighter screening recommended.
- Market conditions: 30 active listings in the ZIP; high-income renter base; 265 units permitted in St. Mary's County in 2024 (0 in 5+ unit buildings).
Forward outlook
- Local home prices are declining (-3.0%/yr); year-one equity from $2k of loan paydown is wiped out by about $9k of value loss. Plan a longer hold.
- St. Mary's County population projected at +16% by 2050 — long-run rental-demand tailwind backs the buy-and-hold thesis.
Negotiation context
- Only 3 days on market — expect competitive offers; lowballing is unlikely to land.
- Current owner paid $63k; list at $300k implies a 379% gain — meaningful room to come down on a strong offer.
Risks & watch-outs
- Climate carrying-cost: major wind risk, 70% chance of damaging wind over 30y; extreme-heat days projected 7→17/yr by 2055 (HVAC capex compounding) — expect insurance premiums to compound above CPI over the hold.
Questions for the listing agent
- Built in 1967 — when were the roof, HVAC, electrical panel, plumbing, and water heater last replaced?
- Is there a deadline driving the sale (1031 exchange, divorce, estate, relocation)? That informs how much negotiation room exists.
- Crime grade is D in this area — have there been break-ins, vandalism, or insurance claims at this property in the last 3 years? What carrier currently insures it and at what premium?
- The area grade is low — what's the realistic commute time and amenity access for the typical tenant pool here? Any planned neighborhood developments (good or bad) we should know about?
- What's the average days-on-market for RENTAL listings here right now (not sales)? A rising rental-DOM trend means longer vacancies and softer asking-rent achievability than the comps imply.
- What's the recent tenant-quality profile in this submarket — average credit score on applications, eviction rate, late-payment / NSF rate, and stable-employment percentage? A property-management company in the area should have these aggregated.
- How much new for-sale + rental construction is in the pipeline within 1–3 miles? Heavy new supply typically softens prices + rents 12–24 months out; constrained supply supports both.
Investment metrics
- 1% rule
- 0.89% ✗
- Cap rate
- 6.45%
- Cash-on-cash
- 0.57%
- DSCR
- 1.03
- GRM
- 9.3
CMA / ARV
- ARV (on-the-fly)
- $322,560
- Comps found
- 10
Show comp detail 10 sales within ~0.75 mi
| Address | Dist | Beds/Ba | Sqft | Sold | Price | $/sf | Match |
|---|---|---|---|---|---|---|---|
| 22209 Lilac Way | 0.15mi | 4/3.0 | 1,637 (-3%) | 9mo | $315,000 | $192 | 76 |
| 45642 Taras Ct | 0.48mi | 4/2.5 | 1,572 (-6%) | 1mo | $415,000 | $264 | 62 |
| 21982 Brigantine Ct | 0.33mi | 3/2.5 (-1) | 1,526 (-9%) | 3mo | $293,000 | $192 | 58 |
| 21990 Brigantine Ct | 0.31mi | 5/3.0 (+1) | 1,764 (+5%) | 10mo | $350,000 | $198 | 58 |
| 45753 Horsehead Rd | 0.56mi | 4/2.0 | 1,664 (-1%) | 23mo | $320,000 | $192 | 51 |
| 22381 Mellencamp Ct | 0.55mi | 3/2.0 (-1) | 1,837 (+9%) | 15mo | $260,000 | $142 | 39 |
| 45765 Oliver Ct | 0.57mi | 3/3.0 (-1) | 1,922 (+14%) | 1mo | $360,000 | $187 | 38 |
| 45523 Longfields Blvd | 0.66mi | 3/2.5 (-1) | 1,789 (+6%) | 16mo | $410,000 | $229 | 36 |
| 22467 Cornwall Dr | 0.73mi | 3/2.0 (-1) | 1,551 (-8%) | 13mo | $250,000 | $161 | 35 |
| 22425 Greenview Pkwy | 0.58mi | 3/2.5 (-1) | 1,916 (+14%) | 23mo | $425,000 | $222 | 22 |
Match score weights: distance 35% · size 25% · config 20% · recency 20%. Top-matched comps best support the ARV.
Projected returns pro-forma
-3.0% appreciation · 3.0% rent growth · sell at horizon
- IRR
- -15.4%
- Equity multiple
- 0.45×
- Total profit
- $-46,019
- Equity at exit
- $44,716
- IRR
- -6.8%
- Equity multiple
- 0.56×
- Total profit
- $-36,641
- Equity at exit
- $25,930
Cash invested: $83,972 (down + closing). Projections, not guarantees.
Landlord ↔ Tenant lean methodology
- Overall (STATE)
- 27 Tenant-Leaning
- State Maryland
- 27 Tenant-Leaning · D+14
- County
- — inherits STATE
- City
- — inherits STATE
ZIP-level market 20634
- Home prices YoY
- -5.7%
- Active inventory
- 30
- Price-to-rent
- 9.3×
Monthly cashflow live
- Estimated rent
- $2,674 medium interval (Pro) →
- Mortgage (P&I)
- −$1,573
- Tax est. 1.5%
- −$375 /mo · $4,498/yr
- Insurance
- −$125
- HOA
- −$0
- Vacancy / Maint / Mgmt
- −$562
- Net cashflow
- $40
Break-even live
UW: 25.0% down · 7.5% · 30yr · 1.5% tax · 5.0% vac · 8.0% maint · 8.0% mgmt
Financing live
Cash to close
- Down payment
- $74,975
- Closing costs
- $8,997
- Reserves months
- —
- Total cash needed
- —
Loan-product check · same deal, 3 products live
Conventional
25% down · 7.5% · 30yr
- Down + closing
- —
- Monthly P&I
- —
- Monthly cashflow
- —
- DSCR
- —
- Eligible?
- —
Personal DTI + credit; lowest rate.
DSCR
20% down · 8.5% · 30yr
- Down + closing
- —
- Monthly P&I
- —
- Monthly cashflow
- —
- DSCR
- —
- Eligible?
- —
No personal income docs; deal must DSCR.
Hard money
10% down · 12.0% · 12mo
- Down + closing
- —
- Monthly P&I
- —
- Monthly cashflow
- —
- DSCR
- —
- Eligible?
- —
Short-term bridge; refi at stabilization.
Listing history 4 events
-
2026-06-19days on market $299,900 Active 3 DOM
-
2026-06-18days on market $299,900 Active 2 DOM
-
2026-06-17remarks 699-char remark
-
2026-06-17$299,900 Active 1 DOM
ⓘ Source: listings_history table (triggers on properties + properties_extension) + one-shot
backfill from property_details.listing_events for pre-trigger history.
Climate risk First Street
- Flood 1/10 Low FEMA zone X (unshaded) · 0% chance over 30 yrs
- Wildfire 3/10 Moderate
- Heat 9/10 Extreme 7 d/yr ≥101°F today · 17 d/yr by 30 yrs out
- Wind 6/10 Major 70% chance of damaging wind over 30 yrs
- Air quality 2/10 Low 1 unhealthy d/yr today · 2 by 30 yrs out
Nearby sold comps map
Loading sold comps map…
Walkable amenities ~0.75 mi
Loading nearby amenities…
Taxation est. · year 1
- Rental income
- $32,087
- − Mortgage interest
- −$16,799
- − Property taxes
- −$4,498
- − Insurance
- −$1,500
- − Repairs & maintenance
- −$2,567
- − Management
- −$2,567
- − Depreciation
- −$8,724
- Taxable loss
- −$4,569
- Est. tax savings @ 24.0%
- +$1,096
- After-tax cash flow
- $1,575/yr
For passive investors: Depreciation is non-cash, so a rental often shows a tax loss while cash-flowing — sheltering income. Rental losses are passive: they offset passive income freely, and up to $25,000/yr can offset ordinary (W-2) income if you actively participate and your MAGI is under $100k (phasing out to $0 by $150k); unused losses carry forward. On sale, claimed depreciation is recaptured at up to 25%, and gains may owe capital-gains tax (a 1031 exchange can defer both). Figures are a year-1 estimate at your 24.0% rate — not tax advice; consult a CPA.
Schools (NCES district)
- District
- St. Mary'S County Public Schools
- NCES district ID
- 2400600
- Math proficiency
- 23% ▼ -23.00%
- Reading proficiency
- 38% ▼ -12.00%
- Median HH income
- $83,240
- Composite
- 29.74/100
- National rank
- #6444
- State rank
- #8 of 24 in MD
Livability — California
- Score
- 73/100
- State rank
- #127
- US rank
- #5421
Category grades
Schools grade is shown separately in the Schools card above.
Census & demographics
- Census place
- California, MD
- County
- Saint Marys County · 48,152 people
- City population
- 14,212
- Metro
- California-Lexington Park, MD
- Population (ZIP)
- 7,088
- Household income
- $139,375
- Rent vs Own
- Severe rent burden
- 111.0
Population outlook (St. Mary's County) Hauer SSP2
- Today (2025)
- 123,125 people
- By 2030
- 128,374 · +4.3%
- By 2040
- 137,305 · +11.5%
- By 2050
- 143,065 · +16.2%
- By 2075
- 153,408 · +24.6%
- By 2100
- 151,790 · +23.3%
Race, ethnicity, and origin ACS 2023
- Neighborhood character
- Diverse neighborhood (Simpson 0.58)
- Race & ethnicity
- White 57% Black 31% Two or more races 6% Hispanic / Latino 5% Asian 3%
- Common ancestry
- Slovak 3% Romanian 2% Lithuanian 2%
- Foreign-born
- 6% · Canada
- Languages at home
- 95% English-only · Spanish 2% Tagalog/Filipino 1% Other Asian/Pacific 1%
Political lean MEDSL · St. Mary's
- 2024 margin
- R (+17.2) · D 40.2% · R 57.4% · Other 2.4%
- 2008→2024 swing
- -4.4pp toward R · 2008: -12.8pp · 2024: -17.2pp
- All cycles
- 2024: R+17.2 2020: R+13.8 2016: R+24.6 2012: R+16.1 2008: R+12.8
Not yet ingested
- Civics
- —
Market trends
- HPI YoY
- ▼ -14.78%
- Current HPI
- 244.1447
- Rent YoY
- —
- Metro
- California-Lexington Park, MD
- State GDP YoY
- ▲ 2.97%
- F500 in state
- 12
Industry mix (Fortune 500 HQ in MD)
| Industry | F500 HQs | Revenue |
|---|---|---|
| Aerospace / Defense | 1 | $71B |
|
||
| Utilities | 1 | $25B |
|
||
| Hotels | 1 | $24B |
|
||
| Consumer Goods | 1 | $7B |
|
||
| Real Estate | 1 | $6B |
|
||
| Chemicals | 1 | $2B |
|
||
Price history
+465.8% since first listed3 events — show timeline
- 2026-06-16 Listed $299,900 BRIGHT MLS
- 1980-03-31 Sold (Public Records) $62,635 Public Records
- 1978-10-06 Sold (Public Records) $53,000 Public Records
Property tax history
-14.8%/yrLatest (2025): $105 · +2.0% YoY. Source: county tax records.
Cash-flow waterfall
monthlySold comps — $/sqft
last 12 mo · ≤1 miLoading sold comps…