 🔨 Auction
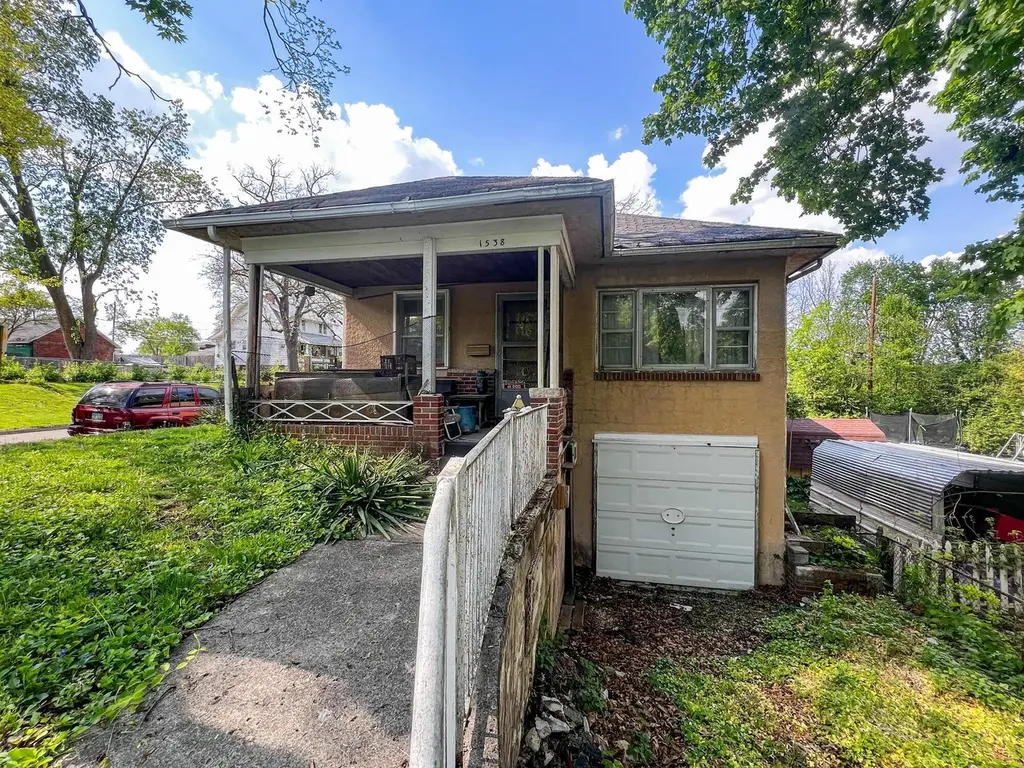
1538 Union Ave · Columbus, OH
Flood risk 6/10 · Moderate
- FEMA flood zone
- X (unshaded)
- Chance of flooding over 30 yrs
- 0.75%
- Est. flood insurance / yr
- $473 – $860
Fire risk 1/10 · Minimal
- Est. fire insurance / yr
- $713 – $1,323
Heat risk 4/10 · Minor
- Hot days now (above 100°F)
- 7 days/yr
- Hot days in 30 yrs
- 18 days/yr
Wind risk 2/10 · Minimal
- Chance of severe wind over 30 yrs
- 1.0%
Air-quality risk 3/10 · Minor
- Unhealthy air days now
- 2 days/yr
- Unhealthy air days in 30 yrs
- 3 days/yr
Risk factors via First Street. Map © Google.
Why this score? — see what drove the D grade
The composite is a weighted blend of 9 inputs, each scored 0–100. Each bar is that input's sub-score; the figure is the points it added to the 100-point composite (weight × sub-score).
- Cash flow +13.5/30.0
- ARV discount +7.5/15.0
- DSCR +4.1/10.0
- Livability +4.0/5.0
- 1% rule +3.8/10.0
- Rent growth +3.7/5.0
- Condition / age +2.5/5.0
- Schools +1.7/10.0
- Appreciation +0.0/10.0
$10,000
🖨 Deal sheet 📄 Offer letter ✓ Due diligence
Listing remarks
ONLINE AUCTION, the RESERVE (Minimum Bid) is $10,000. The auction ends at 7:00 PM, Thursday, May 28th, 2026. BUYERS MUST SIGN ACKNOWLEDGEMENT OF TERMS to bid. Agents, please see 'A2A'.
Key facts
- 5,227 sq ft lot
- Garage
- Built 1959
Property features AI
Finance
- Financial info: $660 annual tax (2024)
Exterior
- Parking: Attached garage with 1 garage space
- Utilities: Public water; Public sewer
- Home design: Single family residence; One-story home; Built in 1959; No shared/common walls
- Construction: Block foundation (1959 construction)
- Exterior features: Block foundation; Lot about 0.12 acre
Interior
- Bedrooms: Three main-level bedrooms
- Bathrooms: One full bathroom
- Interior features: Walk-out basement
Neighborhood map
What this means for you Summary
Snapshot
- This is a 3-bed/1.0-bath single-family listed at $10k.
Deal economics
- At list price, monthly cash flow is $5 ($62/yr) — positive.
- The deal already cash-flows at list — no discount required.
- Meets the 1% rule at list price ($1k rent vs $10k).
- Recommended offer: $10k (3.0% below list) — sets the bar for market timing.
- Cap rate 6.3% vs local median 3.8% in Columbus — top-decile yield for the area; either an underpriced asset or a hidden risk that comps aren't pricing in. Stress-test before assuming the spread holds.
Location & tenants
- Location reads 81/100 on livability (#97 in OH, #1,491 nationally) — a professional / high-income tenant draw. Strengths: commute A+, cost of living A+, housing A+; Watch: employment C-, crime F.
- Columbus City School District (urban): math 15% / reading 26% proficiency, ranked #626 of 656 in OH (top 95%) — low school quality limits family demand, transient renter base, plan for 1-2y turnover; 72% free/reduced lunch — lower-income household profile, screen leases tightly.
- Market conditions: Rents rising fast (+4.6%/yr); 144 active listings in the ZIP; 40 comparable units currently listed for rent nearby; rentals at typical pace (median 21d on market — plan ~3-4 weeks tenant-placement turnaround); 8,139 units permitted in Franklin County in 2024 (5,940 in 5+ unit buildings).
- This rent runs 37% of the median local income ($47k/yr) — at the standard rent-burdened threshold; future hikes will face affordability resistance.
Forward outlook
- Local home prices are declining (-3.0%/yr); year-one equity from $1k of loan paydown is wiped out by about $5k of value loss. Plan a longer hold.
- Franklin County population projected at +34% by 2050 — long-run rental-demand tailwind backs the buy-and-hold thesis.
Negotiation context
- It's been on market 31 days — a 3% lower offer ($10k) is reasonable based on typical stale-listing flexibility.
Risks & watch-outs
- Watch-outs: property tax is 24.4% of price; built in 1959 — expect roof / HVAC / electrical / plumbing capex.
- Climate carrying-cost: major flood risk — expect insurance premiums to compound above CPI over the hold.
Questions for the listing agent
- It's been on market 31 days. Have you received any prior offers? Is the seller open to a 3% concession, seller financing, or rate buy-down credit?
- Built in 1959 — when were the roof, HVAC, electrical panel, plumbing, and water heater last replaced?
- Property tax is high relative to price — has the assessment been appealed recently, and will the sale trigger a re-assessment?
- Is there a deadline driving the sale (1031 exchange, divorce, estate, relocation)? That informs how much negotiation room exists.
- Crime grade is F in this area — have there been break-ins, vandalism, or insurance claims at this property in the last 3 years? What carrier currently insures it and at what premium?
- The area grade is low — what's the realistic commute time and amenity access for the typical tenant pool here? Any planned neighborhood developments (good or bad) we should know about?
- What's the average days-on-market for RENTAL listings here right now (not sales)? A rising rental-DOM trend means longer vacancies and softer asking-rent achievability than the comps imply.
- What's the recent tenant-quality profile in this submarket — average credit score on applications, eviction rate, late-payment / NSF rate, and stable-employment percentage? A property-management company in the area should have these aggregated.
- How much new for-sale + rental construction is in the pipeline within 1–3 miles? Heavy new supply typically softens prices + rents 12–24 months out; constrained supply supports both.
Investment metrics
- 1% rule
- 0.88% ✗
- Cap rate
- 6.33%
- Cash-on-cash
- 0.14%
- DSCR
- 1.01
- GRM
- 9.5
CMA / ARV
- ARV (median comp)
- $162,701
- List price
- $10,000
- Delta
- -93.85%
- Verdict
- UNDERPRICED
- Comps
- 20 within 1.0 mi
Show comp detail 12 sales within ~0.75 mi
| Address | Dist | Beds/Ba | Sqft | Sold | Price | $/sf | Match |
|---|---|---|---|---|---|---|---|
| 1538 Union Ave | 0.00mi | 3/1.0 | 1,064 (0%) | 0mo | $44,000 | $41 | 100 |
| 550 Helen St | 0.26mi | 3/1.0 | 1,110 (+4%) | 3mo | $169,900 | $153 | 78 |
| 1476 Thomas Ave | 0.14mi | 2/1.0 (-1) | 978 (-8%) | 3mo | $150,000 | $153 | 73 |
| 436 Catherine St | 0.14mi | 2/1.0 (-1) | 960 (-10%) | 3mo | $65,000 | $68 | 70 |
| 151 Columbian Ave | 0.64mi | 3/1.0 | 1,012 (-5%) | 2mo | $146,500 | $145 | 60 |
| 258 Wrexham Ave | 0.72mi | 3/2.0 | 1,068 (+0%) | 1mo | $194,000 | $182 | 60 |
| 481 Wrexham Ave | 0.73mi | 2/1.0 (-1) | 1,064 (0%) | 5mo | $139,000 | $131 | 57 |
| 385 S Yale Ave | 0.53mi | 3/1.0 | 947 (-11%) | 3mo | $62,000 | $65 | 54 |
| 635 Clark Ave | 0.58mi | 2/1.0 (-1) | 997 (-6%) | 4mo | $172,500 | $173 | 54 |
| 1046 Bellows Ave | 0.70mi | 2/1.0 (-1) | 1,119 (+5%) | 3mo | $115,000 | $103 | 51 |
| 1082 Thomas Ave | 0.65mi | 3/1.5 | 1,176 (+10%) | 1mo | $212,500 | $181 | 49 |
| 67 N Central Ave | 0.72mi | 3/1.5 | 1,176 (+10%) | 1mo | $78,000 | $66 | 46 |
Match score weights: distance 35% · size 25% · config 20% · recency 20%. Top-matched comps best support the ARV.
Projected returns pro-forma
-3.0% appreciation · 4.61% rent growth · sell at horizon
- IRR
- -14.3%
- Equity multiple
- 0.48×
- Total profit
- $-23,661
- Equity at exit
- $24,259
- IRR
- -3.1%
- Equity multiple
- 0.78×
- Total profit
- $-10,114
- Equity at exit
- $14,067
Cash invested: $45,556 (down + closing). Projections, not guarantees.
Landlord ↔ Tenant lean methodology
- Overall (STATE)
- 73 Landlord-Friendly
- State Ohio
- 73 Landlord-Friendly · R+6
- County
- — inherits STATE
- City
- — inherits STATE
ZIP-level market 43223
- Rents YoY
- 4.6%
- Active inventory
- 144
- Price-to-rent
- 0.6×
Monthly cashflow live
- Estimated rent
- $1,430 high interval (Pro) →
- Mortgage (P&I)
- −$853
- Tax est. 1.5%
- −$203 /mo · $2,441/yr
- Insurance
- −$68
- HOA
- −$0
- Vacancy / Maint / Mgmt
- −$300
- Net cashflow
- $5
Break-even live
UW: 25.0% down · 7.5% · 30yr · 1.5% tax · 5.0% vac · 8.0% maint · 8.0% mgmt
Financing live
Cash to close
- Down payment
- $40,675
- Closing costs
- $4,881
- Reserves months
- —
- Total cash needed
- —
Loan-product check · same deal, 3 products live
Conventional
25% down · 7.5% · 30yr
- Down + closing
- —
- Monthly P&I
- —
- Monthly cashflow
- —
- DSCR
- —
- Eligible?
- —
Personal DTI + credit; lowest rate.
DSCR
20% down · 8.5% · 30yr
- Down + closing
- —
- Monthly P&I
- —
- Monthly cashflow
- —
- DSCR
- —
- Eligible?
- —
No personal income docs; deal must DSCR.
Hard money
10% down · 12.0% · 12mo
- Down + closing
- —
- Monthly P&I
- —
- Monthly cashflow
- —
- DSCR
- —
- Eligible?
- —
Short-term bridge; refi at stabilization.
Rent comps 40 comps
| Address | Beds | Baths | Sqft | Rent | $/sqft | DOM | Units | Dist |
|---|---|---|---|---|---|---|---|---|
| 1485 Walsh Ave Columbus, OH | 2.0 | 1.0 | 720 | $1,450 | $2.01 | 23d | 1 | 0.12mi |
| 432 Catherine St Columbus, OH | 3.0 | 1.0 | 1073 | $1,325 | $1.23 | 12d | 1 | 0.13mi |
| 432 Catherine St Columbus, OH | 3.0 | 1.0 | 1073 | $1,325 | $1.23 | 14d | 1 | 0.13mi |
| 436 Catherine St Columbus, OH | 2.0 | 1.5 | 960 | $1,300 | $1.35 | 7d | 1 | 0.14mi |
| 394 S Guilford Ave Columbus, OH | 3.0 | 1.5 | 1404 | $1,450 | $1.03 | 7d | 1 | 0.14mi |
| 490 Helen St Columbus, OH | 2.0 | 1.0 | 840 | $1,200 | $1.43 | 43d | 1 | 0.22mi |
| 488 Woodbury Ave Columbus, OH | 3.0 | 1.5 | 1222 | $1,250 | $1.02 | 43d | 1 | 0.44mi |
| 120 S Central Ave Columbus, OH | 1.0–3.0 | 1.0–2.0 | 944 | $1,295 | $1.37 | 14d | 12 | 0.46mi |
| 543 Woodbury Ave Unit NA Columbus, OH | 3.0 | 1.0 | 1308 | $1,645 | $1.26 | 14d | 1 | 0.48mi |
| 142 Dana Ave Unit 142 Columbus, OH | 2.0 | 1.0 | 700 | $825 | $1.18 | 43d | 1 | 0.50mi |
| 800 Harrisburg Pike Unit 2 bedroom townhomes Columbus, OH | 2.0 | 1.0 | 1250 | $995 | $0.80 | 43d | 1 | 0.50mi |
| 802 Harrisburg Pike Columbus, OH | 2.0 | 1.0 | 1250 | $995 | $0.80 | 3d | 1 | 0.51mi |
| 189 W Park Ave Unit 189 Columbus, OH | 3.0 | 2.0 | 1276 | $1,395 | $1.09 | 7d | 1 | 0.53mi |
| 411 S Yale Ave Columbus, OH | 2.0 | 1.0 | 784 | $1,425 | $1.82 | 43d | 1 | 0.54mi |
| 87-89 Dana Ave Columbus, OH | 2.0 | 1.0 | 948 | $1,100 | $1.16 | 21d | 1 | 0.54mi |
| 32 Schultz Ave Columbus, OH | 3.0 | 1.0 | 1218 | $1,250 | $1.03 | 21d | 1 | 0.63mi |
| 190 Nashoba Ave Columbus, OH | 2.0 | 1.0 | 1030 | $1,450 | $1.41 | 19d | 1 | 0.63mi |
| 190 Nashoba Ave Columbus, OH | 2.0 | 1.0 | 1030 | $1,450 | $1.41 | 12d | 1 | 0.63mi |
| 108 Columbian Ave Unit B Columbus, OH | 2.0 | 1.0 | 820 | $900 | $1.10 | 7d | 1 | 0.63mi |
| 58 Stevens Ave Columbus, OH | 3.0 | 1.0 | 1176 | $1,250 | $1.06 | 43d | 1 | 0.67mi |
| 1928-1930 Vaughn St Unit 1928 Columbus, OH | 2.0 | 1.0 | 919 | $957 | $1.04 | 43d | 1 | 0.70mi |
| 85 Stevens Ave Columbus, OH | 2.0 | 1.0 | 816 | $995 | $1.22 | 43d | 1 | 0.71mi |
| 185 S Cypress Ave Columbus, OH | 2.0 | 1.0 | 1104 | $1,695 | $1.54 | 43d | 1 | 0.73mi |
| 51 N Princeton Ave Columbus, OH | 3.0 | 1.0 | 1188 | $1,175 | $0.99 | 23d | 1 | 0.73mi |
| 73 Hayden Ave Columbus, OH | 2.0 | 1.0 | 894 | $1,350 | $1.51 | 7d | 1 | 0.73mi |
| 153 S Cypress Ave Columbus, OH | 3.0 | 1.0 | 1472 | $1,650 | $1.12 | 7d | 1 | 0.75mi |
| 100 N Central Ave Columbus, OH | 2.0 | 1.0 | 932 | $1,043 | $1.12 | 43d | 1 | 0.75mi |
| 1137 W Broad St Columbus, OH | 1.0–2.0 | 1.0 | 770 | $1,860 | $2.42 | 43d | 1 | 0.77mi |
| 137 N Guilford Ave Columbus, OH | 4.0 | 2.0 | 1456 | $1,850 | $1.27 | 43d | 1 | 0.78mi |
| 255 Belvidere Ave Columbus, OH | 2.0 | 1.0 | 1144 | $1,195 | $1.04 | 16d | 1 | 0.81mi |
| 163 N Central Ave Columbus, OH | 2.0 | 2.5 | 1100 | $1,650 | $1.50 | 43d | 1 | 0.83mi |
| 121 Chicago Ave Columbus, OH | 2.0 | 2.0 | 1234 | $1,550 | $1.26 | 43d | 1 | 0.85mi |
| 129 Chicago Ave Columbus, OH | 2.0 | 2.5 | 1260 | $1,895 | $1.50 | 23d | 1 | 0.86mi |
| 378 Hawkes Ave Columbus, OH | 3.0 | 2.0 | 1200 | $1,649 | $1.37 | 23d | 1 | 0.86mi |
| 125 Avondale Ave Columbus, OH | 3.0 | 1.5 | 1344 | $1,695 | $1.26 | 43d | 1 | 0.87mi |
| 85 N Yale Ave Columbus, OH | 3.0 | 1.0 | 1215 | $1,100 | $0.91 | 7d | 1 | 0.87mi |
| 85 N Yale Ave Columbus, OH | 3.0 | 1.0 | 1215 | $1,100 | $0.91 | 19d | 1 | 0.87mi |
| 735 Canonby Pl Apt B Columbus, OH | 3.0 | 1.5 | 950 | $1,095 | $1.15 | 19d | 1 | 0.94mi |
| 95-97 Whitethorne Ave Columbus, OH | 3.0 | 1.5 | 1260 | $1,375 | $1.09 | 3d | 1 | 0.96mi |
| 95-97 Whitethorne Ave Columbus, OH | 3.0 | 1.5 | 1260 | $1,475 | $1.17 | 19d | 1 | 0.96mi |
Listing history 3 events
-
2026-04-27$10,000 Active 185-char remark
-
1995-08-28soldstatus $34,000
-
1987-01-31soldstatus $34,000
ⓘ Source: listings_history table (triggers on properties + properties_extension) + one-shot
backfill from property_details.listing_events for pre-trigger history.
Climate risk First Street
- Flood 6/10 Major FEMA zone X (unshaded) · 75% chance over 30 yrs
- Wildfire 1/10 Low
- Heat 4/10 Moderate 7 d/yr ≥100°F today · 18 d/yr by 30 yrs out
- Wind 2/10 Low 100% chance of damaging wind over 30 yrs
- Air quality 3/10 Moderate 2 unhealthy d/yr today · 3 by 30 yrs out
Nearby sold comps map
Loading sold comps map…
Walkable amenities ~0.75 mi
Loading nearby amenities…
Taxation est. · year 1
- Rental income
- $17,158
- − Mortgage interest
- −$9,114
- − Property taxes
- −$2,441
- − Insurance
- −$814
- − Repairs & maintenance
- −$1,373
- − Management
- −$1,373
- − Depreciation
- −$4,733
- Taxable loss
- −$2,688
- Est. tax savings @ 24.0%
- +$645
- After-tax cash flow
- $707/yr
For passive investors: Depreciation is non-cash, so a rental often shows a tax loss while cash-flowing — sheltering income. Rental losses are passive: they offset passive income freely, and up to $25,000/yr can offset ordinary (W-2) income if you actively participate and your MAGI is under $100k (phasing out to $0 by $150k); unused losses carry forward. On sale, claimed depreciation is recaptured at up to 25%, and gains may owe capital-gains tax (a 1031 exchange can defer both). Figures are a year-1 estimate at your 24.0% rate — not tax advice; consult a CPA.
Schools (NCES district)
- District
- Columbus City School District
- NCES district ID
- 3904380
- Math proficiency
- 15% ▼ -17.00%
- Reading proficiency
- 26% ▼ -12.00%
- Median HH income
- $38,483
- Composite
- 17.19/100
- National rank
- #9105
- State rank
- #626 of 656 in OH
Livability — Columbus
- Score
- 81/100
- State rank
- #97
- US rank
- #1491
Category grades
Schools grade is shown separately in the Schools card above.
Census & demographics
- Census place
- Columbus, OH
- County
- Franklin County · 1,351,780 people
- City population
- 612,189
- Metro
- Columbus, OH
- Population (ZIP)
- 28,187
- Household income
- $46,911
- Rent vs Own
- Severe rent burden
- 1689.0
Population outlook (Franklin County) Hauer SSP2
- Today (2025)
- 1,456,139 people
- By 2030
- 1,556,890 · +6.9%
- By 2040
- 1,757,349 · +20.7%
- By 2050
- 1,950,539 · +34.0%
- By 2075
- 2,376,171 · +63.2%
- By 2100
- 2,636,796 · +81.1%
Race, ethnicity, and origin ACS 2023
- Neighborhood character
- Diverse neighborhood (Simpson 0.55)
- Race & ethnicity
- White 63% Black 22% Two or more races 8% Hispanic / Latino 8%
- Hispanic origin (detail)
- Mexican 4% Puerto Rican 3%
- Common ancestry
- Romanian 4% Italian 1% Slovak 1%
- Foreign-born
- 5% · Canada
- Languages at home
- 91% English-only · Spanish 5%
Political lean MEDSL · Franklin
- 2024 margin
- Strong D (+28.4) · D 63.7% · R 35.3% · Other 1.0%
- 2008→2024 swing
- +7.7pp toward D · 2008: 20.7pp · 2024: 28.4pp
- All cycles
- 2024: D+28.4 2020: D+31.4 2016: D+25.9 2012: D+21.7 2008: D+20.7
Not yet ingested
- Civics
- —
Market trends
- HPI YoY
- ▼ -135.33%
- Current HPI
- 211.6742
- Rent YoY
- ▲ 4.61%
- Metro
- Columbus, OH
- State GDP YoY
- ▲ 1.98%
- F500 in state
- 48
Industry mix (Fortune 500 HQ in OH)
| Industry | F500 HQs | Revenue |
|---|---|---|
| Insurance | 3 | $145B |
|
||
| Industrial Machinery | 3 | $49B |
|
||
| Financial Services | 3 | $24B |
|
||
| Consumer Goods | 2 | $93B |
|
||
| Aerospace / Defense | 2 | $47B |
|
||
| Utilities | 2 | $33B |
|
||
Price history
+29.4% since first listed5 events — show timeline
- 2026-06-11 Sold (MLS) $44,000 CBRMLS
- 2026-05-29 Pending — CBRMLS
- 2026-04-27 Listed $10,000 CBRMLS
- 1995-08-28 Sold (Public Records) $34,000 Public Records
- 1987-01-31 Sold (Public Records) $34,000 Public Records
Property tax history
+4.1%/yrLatest (2024): $660 · -41.7% YoY. Source: county tax records.
Cash-flow waterfall
monthlySold comps — $/sqft
last 12 mo · ≤1 miLoading sold comps…