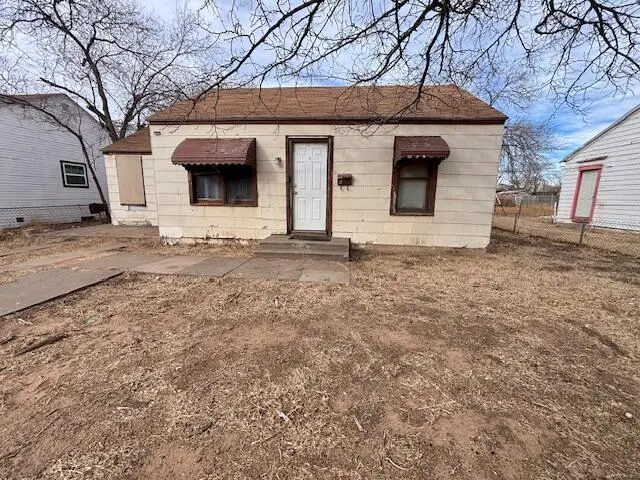
1520 24th Pl · Lubbock, TX
Flood risk 6/10 · Moderate
- FEMA flood zone
- AE
- Chance of flooding over 30 yrs
- 0.72%
- Est. flood insurance / yr
- $1,737 – $8,500
Fire risk 1/10 · Minimal
- Est. fire insurance / yr
- $1,222 – $2,270
Heat risk 5/10 · Moderate
- Hot days now (above 100°F)
- 7 days/yr
- Hot days in 30 yrs
- 21 days/yr
Wind risk 2/10 · Minimal
- Chance of severe wind over 30 yrs
- —
Air-quality risk 2/10 · Minimal
- Unhealthy air days now
- 1 days/yr
- Unhealthy air days in 30 yrs
- 1 days/yr
Risk factors via First Street. Map © Google.
Why this score? — see what drove the B grade
The composite is a weighted blend of 9 inputs, each scored 0–100. Each bar is that input's sub-score; the figure is the points it added to the 100-point composite (weight × sub-score).
- Cash flow +30.0/30.0
- 1% rule +10.0/10.0
- DSCR +10.0/10.0
- ARV discount +7.5/15.0
- Livability +4.0/5.0
- Schools +3.1/10.0
- Rent growth +3.0/5.0
- Condition / age +2.5/5.0
- Appreciation +0.0/10.0
$38,000
🖨 Deal sheet (PDF) 📄 Offer letter ✓ Due diligence
Listing remarks MLS
N E W heat and air unit /less than 6 mo carpet is 1 1/2 year / cook top new about 1 1/2 tr CK 4 flood area
Key facts
- 6,500 sq ft lot
- Built 1947
- Listed 40 days
Property features AI
Exterior
- Parking: Paved parking
- Home design: Single-family residence; Residential property; Fixer condition
- Construction: Masonite and other exterior materials; Composition roof; Pillar/post/pier foundation; Built area approximately 1,560 above grade
- Exterior features: No specific exterior features listed; Asphalt road access
Interior
- Bathrooms: 2 full bathrooms
- Heating & cooling: Central heating (natural gas); Central electric cooling
- Interior features: Fireplace (1); Other interior features
Neighborhood map
What this means for you Summary
Snapshot
- This is a 3-bed/2.0-bath single-family listed at $38k.
Deal economics
- At list price, monthly cash flow is $167 ($2k/yr) — positive.
- The deal already cash-flows at list — no discount required.
- Meets the 1% rule at list price ($1k rent vs $38k).
- Recommended offer: $37k (3.0% below list) — sets the bar for market timing.
Location & tenants
- Location reads 80/100 on livability (#37 in TX, #1,749 nationally) — a professional / high-income tenant draw. Strengths: commute A+, cost of living A+, housing A+; Watch: employment C-, crime F.
- Lubbock ISD (urban): math 36% / reading 39% proficiency, ranked #481 of 826 in TX (top 58%) — families likely to look elsewhere, expect single-tenant / working-renter base with shorter leases; 60% free/reduced lunch — lower-income household profile, screen leases tightly.
- Zoned schools: Bean El Gr 01 To 05 (math 26% / reading 25%, grade F, #2,982 of 4,322 statewide, top 70%, 349 students, 96% FRL); Slaton Middle (math 13% / reading 16%, grade F, #1,583 of 1,662 statewide, top 96%, 355 students, 96% FRL); Monterey H S (math 28% / reading 37%, grade F, #1,029 of 1,632 statewide, top 64%, 2,114 students, 72% FRL) — zoned schools average 88% FRL vs 60% district-wide (28 pts higher); higher-poverty schools than district average — tighter screening recommended.
- Zoned-school proficiency averages 24% at this address vs 38% district-wide (-13 pts) — the specific schools serving this property underperform the Lubbock ISD average; the district grade overstates school quality for this exact location.
- Market conditions: Rents rising (+1.9%/yr); 97 active listings in the ZIP; 40 comparable units currently listed for rent nearby; rentals at typical pace (median 23d on market — plan ~3-4 weeks tenant-placement turnaround); 45% of comp listings sitting > 30 days — soft ceiling on asking rent; 2,219 units permitted in Lubbock County in 2024 (252 in 5+ unit buildings).
- This rent runs 31% of the median local income ($48k/yr) — at the standard rent-burdened threshold; future hikes will face affordability resistance.
Forward outlook
- Local home prices are declining (-3.0%/yr); year-one equity from $263 of loan paydown is wiped out by about $1k of value loss. Plan a longer hold.
- Lubbock County population projected at +39% by 2050 — long-run rental-demand tailwind backs the buy-and-hold thesis.
- At projected returns (-3.0% appreciation + 1.9% rent growth), your $11k cash investment doubles in ~8 years — after that, you're playing with house money.
Negotiation context
- It's been on market 40 days — a 3% lower offer ($37k) is reasonable based on typical stale-listing flexibility.
- 3 sale attempts since 9y ago with the ask held roughly flat each time — persistent listings suggest the price (not the market) is what's stuck; bring a comps-based counter.
Risks & watch-outs
- Watch-outs: property tax is 4.7% of price; flood insurance adds $427/mo; built in 1947 — expect roof / HVAC / electrical / plumbing capex.
- Climate carrying-cost: in FEMA flood zone AE (mandatory federal flood insurance); extreme-heat days projected 7→21/yr by 2055 (HVAC capex compounding) — expect insurance premiums to compound above CPI over the hold.
Questions for the listing agent
- It's been on market 40 days. Have you received any prior offers? Is the seller open to a 3% concession, seller financing, or rate buy-down credit?
- Built in 1947 — when were the roof, HVAC, electrical panel, plumbing, and water heater last replaced?
- Property tax is high relative to price — has the assessment been appealed recently, and will the sale trigger a re-assessment?
- What's the actual annual flood-insurance premium (NFIP or private), and is the property in a SFHA with mandatory coverage?
- Is there a deadline driving the sale (1031 exchange, divorce, estate, relocation)? That informs how much negotiation room exists.
- Schools are D-rated, which usually means shorter tenancies and higher turnover. Who's the typical renter profile here, and what's been the actual vacancy rate?
- Crime grade is F in this area — have there been break-ins, vandalism, or insurance claims at this property in the last 3 years? What carrier currently insures it and at what premium?
- What's the average days-on-market for RENTAL listings here right now (not sales)? A rising rental-DOM trend means longer vacancies and softer asking-rent achievability than the comps imply.
- What's the recent tenant-quality profile in this submarket — average credit score on applications, eviction rate, late-payment / NSF rate, and stable-employment percentage? A property-management company in the area should have these aggregated.
- How much new for-sale + rental construction is in the pipeline within 1–3 miles? Heavy new supply typically softens prices + rents 12–24 months out; constrained supply supports both.
Investment metrics
- 1% rule
- 3.19% ✓
- Cap rate
- 25.04%
- Cash-on-cash
- 66.95%
- DSCR
- 3.98
- GRM
- 2.6
CMA / ARV
- ARV (median comp)
- $117,519
- List price
- $38,000
- Delta
- -67.66%
- Verdict
- UNDERPRICED
- Comps
- 6 within 2.0 mi
Projected returns pro-forma
-3.0% appreciation · 1.87% rent growth · sell at horizon
- IRR
- 8.5%
- Equity multiple
- 1.33×
- Total profit
- $3,464
- Equity at exit
- $5,666
- IRR
- 16.0%
- Equity multiple
- 2.19×
- Total profit
- $12,641
- Equity at exit
- $3,286
Cash invested: $10,640 (down + closing). Projections, not guarantees.
Landlord ↔ Tenant lean methodology
- Overall (STATE)
- 87 Strongly Landlord-Friendly
- State Texas
- 87 Strongly Landlord-Friendly · R+5
- County
- — inherits STATE
- City
- — inherits STATE
ZIP-level market 79411
- Home prices YoY
- -10.5%
- Rents YoY
- 1.9%
- Active inventory
- 97
- Price-to-rent
- 2.6×
Monthly cashflow live
- Estimated rent
- $1,214 high interval (Pro) →
- Mortgage (P&I)
- −$199
- Tax from tax record
- −$150 /mo · $1,803/yr
- Insurance
- −$16
- Flood insurance flood zone
- −$427 /mo · $5,118/yr
- HOA
- −$0
- Vacancy / Maint / Mgmt
- −$255
- Net cashflow
- $167
Break-even live
Sensitivity live
| Price | -10% $296 | -5% $178 | +0% $167 | +5% $156 | +10% $146 |
|---|---|---|---|---|---|
| Rent | -10% $71 | -5% $119 | +0% $167 | +5% $215 | +10% $263 |
| Rate | -1.0pp $186 | -0.5pp $177 | base $167 | +0.5pp $157 | +1.0pp $147 |
UW: 25.0% down · 7.5% · 30yr · 1.5% tax · 5.0% vac · 8.0% maint · 8.0% mgmt
Financing live
Cash to close
- Down payment
- $9,500
- Closing costs
- $1,140
- Reserves months
- —
- Total cash needed
- —
Loan-product check · same deal, 3 products live
Conventional
25% down · 7.5% · 30yr
- Down + closing
- —
- Monthly P&I
- —
- Monthly cashflow
- —
- DSCR
- —
- Eligible?
- —
Personal DTI + credit; lowest rate.
DSCR
20% down · 8.5% · 30yr
- Down + closing
- —
- Monthly P&I
- —
- Monthly cashflow
- —
- DSCR
- —
- Eligible?
- —
No personal income docs; deal must DSCR.
Hard money
10% down · 12.0% · 12mo
- Down + closing
- —
- Monthly P&I
- —
- Monthly cashflow
- —
- DSCR
- —
- Eligible?
- —
Short-term bridge; refi at stabilization.
Rent comps 40 comps
| Address | Beds | Baths | Sqft | Rent | $/sqft | DOM | Units | Dist |
|---|---|---|---|---|---|---|---|---|
| 1517 25th St Lubbock, TX | 3.0 | 2.0 | 1514 | $1,095 | $0.72 | 23d | 1 | 0.12mi |
| 1716 24th St Lubbock, TX | 4.0 | 2.0 | 1742 | $1,850 | $1.06 | 45d | 1 | 0.20mi |
| 1610 28th St Unit A Lubbock, TX | 2.0 | 2.0 | 1060 | $750 | $0.71 | 15d | 1 | 0.26mi |
| 1904 24th St Lubbock, TX | 3.0 | 1.0 | 1172 | $1,100 | $0.94 | 45d | 1 | 0.28mi |
| 1901 26th St Lubbock, TX | 2.0 | 1.0 | 1142 | $950 | $0.83 | 23d | 1 | 0.31mi |
| 1915 26th St Lubbock, TX | 3.0 | 1.0 | 1221 | $1,100 | $0.90 | 45d | 1 | 0.37mi |
| 1912 21st St Lubbock, TX | 3.0 | 2.0 | 1473 | $1,025 | $0.70 | 45d | 1 | 0.39mi |
| 1920 27th St Unit 1 Lubbock, TX | 3.0 | 3.0 | 1366 | $1,500 | $1.10 | 45d | 1 | 0.40mi |
| 1912 20th St Unit A Lubbock, TX | 3.0 | 2.0 | 1590 | $1,000 | $0.63 | 23d | 1 | 0.42mi |
| 2009 23rd St Lubbock, TX | 3.0 | 1.0 | 1615 | $1,249 | $0.77 | 45d | 1 | 0.44mi |
| 2113 22nd St Lubbock, TX | 2.0 | 1.0 | 1404 | $850 | $0.61 | 23d | 1 | 0.53mi |
| 2118 24th St Lubbock, TX | 3.0 | 1.0 | 1435 | $1,000 | $0.70 | 23d | 1 | 0.54mi |
| 2104 20th St Lubbock, TX | 4.0 | 2.0 | 1796 | $1,700 | $0.95 | 23d | 1 | 0.55mi |
| 2119 25th St Lubbock, TX | 3.0 | 1.5 | 1184 | $1,200 | $1.01 | 45d | 1 | 0.55mi |
| 2109 20th St Lubbock, TX | 3.0 | 2.0 | 1391 | $1,200 | $0.86 | 45d | 1 | 0.56mi |
| 1922 18th St Lubbock, TX | 3.0 | 1.0 | 1136 | $1,050 | $0.92 | 23d | 1 | 0.57mi |
| 2115 27th St Unit A Lubbock, TX | 2.0 | 1.0 | 1148 | $875 | $0.76 | 23d | 1 | 0.57mi |
| 1909 16th St Lubbock, TX | 4.0 | 2.0 | 1312 | $1,600 | $1.22 | 23d | 1 | 0.61mi |
| 2124 20th St Lubbock, TX | 3.0 | 2.0 | 1481 | $1,150 | $0.78 | 15d | 1 | 0.63mi |
| 2201 28th St Lubbock, TX | 3.0 | 1.0 | 1246 | $995 | $0.80 | 23d | 1 | 0.65mi |
| 2220 25th St Lubbock, TX | 4.0 | 1.0 | 1077 | $695 | $0.65 | 23d | 1 | 0.67mi |
| 2003 32nd St Unit A Lubbock, TX | 2.0 | 2.0 | 1228 | $1,150 | $0.94 | 45d | 1 | 0.68mi |
| 2106 32nd St Lubbock, TX | 3.0 | 1.0 | 1398 | $925 | $0.66 | 45d | 1 | 0.71mi |
| 2106 32nd St Lubbock, TX | 3.0 | 1.0 | 1398 | $695 | $0.50 | 23d | 1 | 0.71mi |
| 2123 18th St Lubbock, TX | 3.0 | 2.0 | 1328 | $949 | $0.71 | 15d | 1 | 0.74mi |
| 2220 29th St Lubbock, TX | 3.0 | 2.0 | 2032 | $1,300 | $0.64 | 45d | 1 | 0.76mi |
| 2311 25th St Lubbock, TX | 4.0 | 2.0 | 1400 | $1,400 | $1.00 | 23d | 1 | 0.76mi |
| 2119 32nd St Lubbock, TX | 2.0 | 1.0 | 1055 | $950 | $0.90 | 45d | 1 | 0.77mi |
| 2103 33rd St Lubbock, TX | 2.0 | 1.0 | 1075 | $700 | $0.65 | 15d | 1 | 0.78mi |
| 1919 34th St Lubbock, TX | 2.0 | 2.0 | 1463 | $1,100 | $0.75 | 15d | 1 | 0.81mi |
| 2122 16th St Lubbock, TX | 2.0 | 2.0 | 1295 | $1,025 | $0.79 | 45d | 1 | 0.84mi |
| 1220 Broadway St Unit 1704 Lubbock, TX | 2.0 | 2.0 | 1098 | $999 | $0.91 | 45d | 1 | 0.84mi |
| 1220 Broadway St Lubbock, TX | 1.0–2.0 | 1.0–2.0 | 932 | $1,500 | $1.61 | 15d | 7 | 0.84mi |
| 2403 22nd Pl Lubbock, TX | 2.0 | 1.0 | 1066 | $900 | $0.84 | 23d | 1 | 0.84mi |
| 2404 25th St Lubbock, TX | 3.0 | 2.0 | 1292 | $1,395 | $1.08 | 23d | 1 | 0.85mi |
| 2119 15th St Lubbock, TX | 3.0 | 2.0 | 1600 | $1,400 | $0.88 | 45d | 1 | 0.85mi |
| 2402 21st St Lubbock, TX | 3.0 | 1.0 | 1453 | $1,500 | $1.03 | 45d | 1 | 0.86mi |
| 2319 28th St Lubbock, TX | 4.0 | 2.0 | 2146 | $1,650 | $0.77 | 23d | 1 | 0.86mi |
| 2404 27th St Lubbock, TX | 4.0 | 2.0 | 1250 | $1,349 | $1.08 | 45d | 1 | 0.87mi |
| 2211 33rd St Unit A Lubbock, TX | 3.0 | 1.5 | 1293 | $1,200 | $0.93 | 45d | 1 | 0.89mi |
Listing history 24 events
-
2026-06-22statusdays on market $38,000 Pending 40 DOM
-
2026-06-18days on market $38,000 Active 38 DOM
-
2026-06-17days on market $38,000 Active 37 DOM
-
2026-06-16days on market $38,000 Active 36 DOM
-
2026-06-15days on market $38,000 Active 35 DOM
-
2026-06-14days on market $38,000 Active 33 DOM
-
2026-06-13days on market $38,000 Active 32 DOM
-
2026-06-10days on market $38,000 Active 30 DOM
-
2026-06-09days on market $38,000 Active 29 DOM
-
2026-06-08days on market $38,000 Active 28 DOM
-
2026-06-07days on market $38,000 Active 27 DOM
-
2026-06-05days on market $38,000 Active 24 DOM
-
2026-06-03days on market $38,000 Active 23 DOM
-
2026-06-02days on market $38,000 Active 22 DOM
-
2026-06-01days on market $38,000 Active 21 DOM
-
2026-05-31days on market $38,000 Active 20 DOM
-
2026-05-30days on market $38,000 Active 19 DOM
-
2026-05-11$38,000 Active 423-char remark
-
2026-01-05$50,000 Active
-
2025-07-14soldstatus
-
2018-03-26soldstatus
-
2018-03-23soldstatus
Show marketing remark (135 chars)
N E W heat and air unit /less than 6 mo carpet is 1 1/2 year / cook top new about 1 1/2 tr CK 4 flood area
-
2017-08-07$48,000
Show marketing remark (135 chars)
N E W heat and air unit /less than 6 mo carpet is 1 1/2 year / cook top new about 1 1/2 tr CK 4 flood area
-
2002-10-29soldstatus
ⓘ Source: listings_history table (triggers on properties + properties_extension) + one-shot
backfill from property_details.listing_events for pre-trigger history.
Tax reassessment forecast TX · Resets to sale price
- Current annual tax
- $1,803 · $150/mo
- Projected year-2 tax
- $1,803 · $150/mo
- Expected delta
- $0/yr ($0/mo · 0.0%)
ⓘ Screening estimate from a state-policy table — verify with the county assessor before closing.
Climate risk First Street
- Flood 6/10 Major FEMA zone AE · 72% chance over 30 yrs
- Wildfire 1/10 Low
- Heat 5/10 Major 7 d/yr ≥100°F today · 21 d/yr by 30 yrs out
- Wind 2/10 Low
- Air quality 2/10 Low 1 unhealthy d/yr today · 1 by 30 yrs out
Nearby sold comps map
Loading sold comps map…
Walkable amenities ~0.75 mi
Loading nearby amenities…
Taxation est. · year 1
- Rental income
- $14,567
- − Mortgage interest
- −$2,129
- − Property taxes
- −$1,803
- − Insurance
- −$5,308
- − Repairs & maintenance
- −$1,165
- − Management
- −$1,165
- − Depreciation
- −$1,105
- Taxable income
- $1,891
- Est. tax owed @ 24.0%
- −$454
- After-tax cash flow
- $1,551/yr
For passive investors: Depreciation is non-cash, so a rental often shows a tax loss while cash-flowing — sheltering income. Rental losses are passive: they offset passive income freely, and up to $25,000/yr can offset ordinary (W-2) income if you actively participate and your MAGI is under $100k (phasing out to $0 by $150k); unused losses carry forward. On sale, claimed depreciation is recaptured at up to 25%, and gains may owe capital-gains tax (a 1031 exchange can defer both). Figures are a year-1 estimate at your 24.0% rate — not tax advice; consult a CPA.
Schools (NCES district)
- District
- Lubbock ISD
- NCES district ID
- 4828500
- Math proficiency
- 36% ▼ -8.00%
- Reading proficiency
- 39% ▼ -1.00%
- Median HH income
- $39,820
- Composite
- 31.44/100
- National rank
- #5984
- State rank
- #481 of 826 in TX
Livability — Lubbock
- Score
- 80/100
- State rank
- #37
- US rank
- #1749
Category grades
Schools grade is shown separately in the Schools card above.
Census & demographics
- Census place
- Lubbock, TX
- County
- Lubbock County · 293,542 people
- City population
- 283,030
- Metro
- Lubbock, TX
- Population (ZIP)
- 6,865
- Household income
- $47,634
- Rent vs Own
- Severe rent burden
- 777.0
Population outlook (Lubbock County) Hauer SSP2
- Today (2025)
- 345,960 people
- By 2030
- 371,449 · +7.4%
- By 2040
- 424,539 · +22.7%
- By 2050
- 481,150 · +39.1%
- By 2075
- 633,467 · +83.1%
- By 2100
- 746,853 · +115.9%
Race, ethnicity, and origin ACS 2023
- Neighborhood character
- Diverse neighborhood (Simpson 0.59)
- Race & ethnicity
- Hispanic / Latino 50% White 39% Two or more races 10% Black 9% Native American 2%
- Hispanic origin (detail)
- Mexican 37% Cuban 2%
- Common ancestry
- Slovak 3% Italian 2% Portuguese 2%
- Foreign-born
- 8% · Canada
- Languages at home
- 64% English-only · Spanish 35%
Political lean MEDSL · Lubbock
- 2024 margin
- Solid R (+39.5) · D 29.7% · R 69.2% · Other 1.0%
- 2008→2024 swing
- -2.8pp toward R · 2008: -36.7pp · 2024: -39.5pp
- All cycles
- 2024: R+39.5 2020: R+32.2 2016: R+38.4 2012: R+40.9 2008: R+36.7
Not yet ingested
- Civics
- —
Market trends
- HPI YoY
- ▼ -24.58%
- Current HPI
- 210.495
- Rent YoY
- ▲ 1.87%
- Metro
- Lubbock, TX
- State GDP YoY
- ▲ 3.95%
- F500 in state
- 110
Industry mix (Fortune 500 HQ in TX)
| Industry | F500 HQs | Revenue |
|---|---|---|
| Energy | 16 | $1,198B |
|
||
| Technology | 5 | $198B |
|
||
| Engineering / Construction | 4 | $72B |
|
||
| Energy Services | 3 | $60B |
|
||
| Utilities | 3 | $41B |
|
||
| Healthcare | 2 | $330B |
|
||
Price history
-20.8% since first listed8 events — show timeline
- 2026-06-20 Pending — LARMLS
- 2026-05-11 Listed $38,000 LARMLS
- 2026-01-05 Listed $50,000 LARMLS
- 2025-07-14 Sold (Public Records) — Public Records
- 2018-03-26 Sold (Public Records) — Public Records
- 2018-03-23 Sold (MLS) — LARMLS
- 2017-08-07 Listed $48,000 LARMLS
- 2002-10-29 Sold (Public Records) — Public Records
Property tax history
+4.6%/yrLatest (2025): $1,803 · -11.7% YoY. Source: county tax records.
Cash-flow waterfall
monthlySold comps — $/sqft
last 12 mo · ≤1 miLoading sold comps…