10001-Rd Frontage #238 · South Gate, CA
Flood risk 6/10 · Moderate
- FEMA flood zone
- X
- Chance of flooding over 30 yrs
- 0.74%
- Est. flood insurance / yr
- $507 – $1,088
Fire risk 1/10 · Minimal
- Est. fire insurance / yr
- $659 – $1,223
Heat risk 5/10 · Moderate
- Hot days now (above 92°F)
- 6 days/yr
- Hot days in 30 yrs
- 20 days/yr
Wind risk 1/10 · Minimal
- Chance of severe wind over 30 yrs
- —
Air-quality risk 6/10 · Moderate
- Unhealthy air days now
- 10 days/yr
- Unhealthy air days in 30 yrs
- 10 days/yr
Risk factors via First Street. Map © Google.
Why this score? — see what drove the B+ grade
The composite is a weighted blend of 9 inputs, each scored 0–100. Each bar is that input's sub-score; the figure is the points it added to the 100-point composite (weight × sub-score).
- Cash flow +30.0/30.0
- ARV discount +15.0/15.0
- 1% rule +10.0/10.0
- DSCR +10.0/10.0
- Schools +4.4/10.0
- Rent growth +3.7/5.0
- Livability +3.2/5.0
- Condition / age +2.2/5.0
- Appreciation +0.0/10.0
$129,500
🖨 Deal sheet 📄 Offer letter ✓ Due diligence
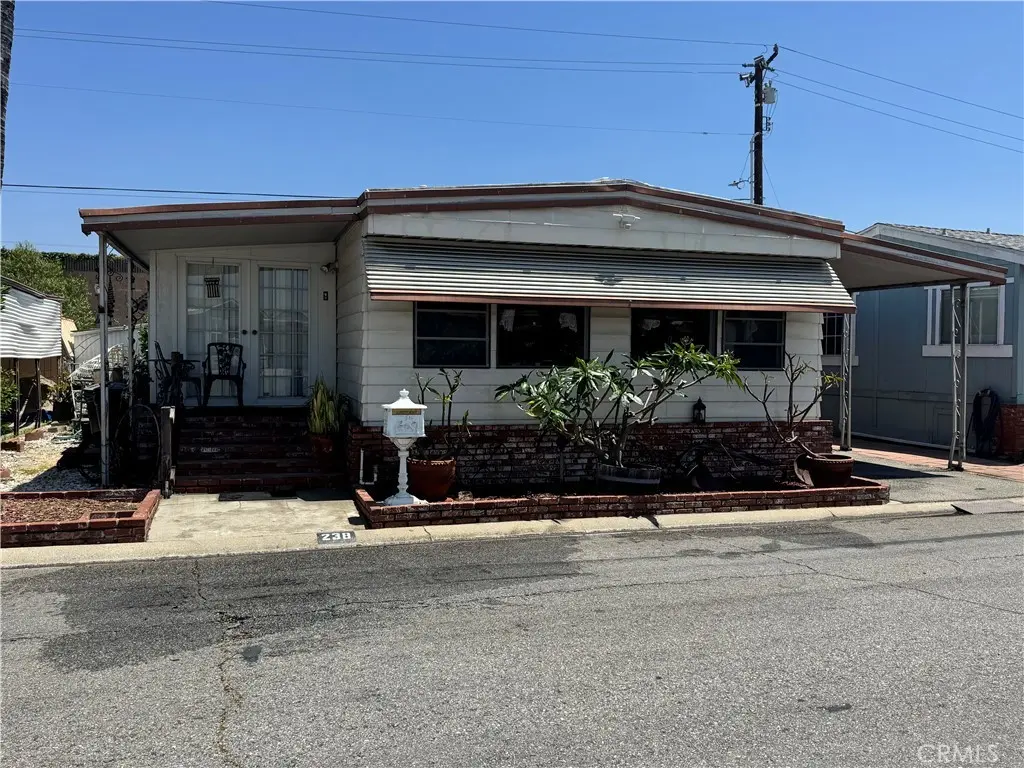
Listing remarks
Double-wide mobile home located in a desirable senior community directly across from the pool and activity center. This spacious home features 2 bedrooms and 2 bathrooms, a large living room with an open floor plan flowing into the dining area and kitchen, creating a bright and inviting atmosphere. Enjoy the large enclosed porch, perfect for additional living space, a hobby room, or entertaining guests. One of the bedrooms includes an extension, making it exceptionally large and versatile. A wonderful opportunity to enjoy comfortable living in a peaceful senior park community with great amenities just steps away. The photos showing the rooms clean have been artificially created to help visu
Key facts
- Great amenities
- Large enclosed porch
- Across from the pool
Tags
Property features AI
Finance
- Other: Living area reported by seller; Located south of Firestone and west of Garfield; Latitude 33.942178, Longitude -118.172347
- Financial info: Land lease of $1,128 per month (seller-provided); Pool included in rent
- HOA & community: Part of an association; Senior community; Manager approval required; Breed restrictions for pets; Community is urban
Exterior
- Parking: Carport with space for 2 vehicles; Total parking for 2 vehicles
- Utilities: Public sewer; District/public water
- Home design: Single-story mobile home (double body); Mobile home remains on site; Mobile dimensions approximately 10 ft by 55 ft; Entry at front
- Construction: Seller-reported year built; Single-story structure
- Exterior features: Community pool; Park located in Thunderbird Villas; Lot within 0–1 unit per acre setting; Elevation measured in feet
Interior
- Bathrooms: 2 full bathrooms
- Interior features: Front entry; One-level home; Community spa
- Laundry & utility: Laundry in a dedicated room
Neighborhood map
What this means for you Summary
Snapshot
- This is a 2-bed/2.0-bath manufactured listed at $130k. Condition is rated fair.
Deal economics
- At list price, monthly cash flow is $1k ($13k/yr) — positive.
- The deal already cash-flows at list — no discount required.
- Meets the 1% rule at list price ($2k rent vs $130k).
- Recommended offer: $126k (3.0% below list) — sets the bar for market timing.
- Cap rate 16.1% vs local median 2.8% in South Gate — top-decile yield for the area; either an underpriced asset or a hidden risk that comps aren't pricing in. Stress-test before assuming the spread holds.
Location & tenants
- Location reads 63/100 on livability (#459 in CA) — a middle-class / working-renter tenant base. Strengths: commute A+; Watch: health & safety C-, schools D-, crime F.
- Downey Unified (suburban): math 41% / reading 53% proficiency, ranked #481 of 1,400 in CA (top 34%) — families likely to look elsewhere, expect single-tenant / working-renter base with shorter leases.
- Market conditions: Rents rising fast (+5.0%/yr); 51 active listings in the ZIP; 20 comparable units currently listed for rent nearby; rentals at typical pace (median 19d on market — plan ~3-4 weeks tenant-placement turnaround); 19,697 units permitted in Los Angeles County in 2024 (9,426 in 5+ unit buildings).
- This rent runs 40% of the median local income ($75k/yr) — at the standard rent-burdened threshold; future hikes will face affordability resistance.
Forward outlook
- Local home prices are declining (-3.0%/yr); year-one equity from $895 of loan paydown is wiped out by about $4k of value loss. Plan a longer hold.
- Los Angeles County population projected at +9% by 2050 — modest demand growth; plan on rents tracking national, not racing it.
- At projected returns (-3.0% appreciation + 5.0% rent growth), your $36k cash investment doubles in ~4 years — after that, you're playing with house money.
Negotiation context
- It's been on market 38 days — a 3% lower offer ($126k) is reasonable based on typical stale-listing flexibility.
Risks & watch-outs
- Climate carrying-cost: major flood risk; extreme-heat days projected 6→20/yr by 2055 (HVAC capex compounding) — expect insurance premiums to compound above CPI over the hold.
Questions for the listing agent
- It's been on market 38 days. Have you received any prior offers? Is the seller open to a 3% concession, seller financing, or rate buy-down credit?
- Have any recent inspections been done? Can we get a copy of the seller's disclosures and any deferred-maintenance estimates?
- Built in 1969 — when were the roof, HVAC, electrical panel, plumbing, and water heater last replaced?
- Is there a deadline driving the sale (1031 exchange, divorce, estate, relocation)? That informs how much negotiation room exists.
- Schools are D-rated, which usually means shorter tenancies and higher turnover. Who's the typical renter profile here, and what's been the actual vacancy rate?
- Crime grade is F in this area — have there been break-ins, vandalism, or insurance claims at this property in the last 3 years? What carrier currently insures it and at what premium?
- What's the average days-on-market for RENTAL listings here right now (not sales)? A rising rental-DOM trend means longer vacancies and softer asking-rent achievability than the comps imply.
- What's the recent tenant-quality profile in this submarket — average credit score on applications, eviction rate, late-payment / NSF rate, and stable-employment percentage? A property-management company in the area should have these aggregated.
- How much new for-sale + rental construction is in the pipeline within 1–3 miles? Heavy new supply typically softens prices + rents 12–24 months out; constrained supply supports both.
Investment metrics
- 1% rule
- 1.91% ✓
- Cap rate
- 16.13%
- Cash-on-cash
- 35.14%
- DSCR
- 2.56
- GRM
- 4.4
CMA / ARV
- ARV (median comp)
- $159,366
- List price
- $129,500
- Delta
- -18.74%
- Verdict
- UNDERPRICED
- Comps
- 10 within 1.0 mi
Show comp detail 3 sales within ~0.75 mi
| Address | Dist | Beds/Ba | Sqft | Sold | Price | $/sf | Match |
|---|---|---|---|---|---|---|---|
| 10001 W Frontage Rd #188 | 0.00mi | 3/2.0 (+1) | 1,040 (-6%) | 4mo | $190,000 | $183 | 83 |
| 10001 Frontage Rd #94 | 0.00mi | 2/2.0 | 1,028 (-6%) | 22mo | $168,500 | $164 | 71 |
| 10001 Frontage #46 Rd W #46 | 0.00mi | 2/2.0 | 960 (-13%) | 24mo | $155,000 | $161 | 59 |
Match score weights: distance 35% · size 25% · config 20% · recency 20%. Top-matched comps best support the ARV.
Projected returns pro-forma
-3.0% appreciation · 4.95% rent growth · sell at horizon
- IRR
- 32.9%
- Equity multiple
- 2.42×
- Total profit
- $51,642
- Equity at exit
- $19,309
- IRR
- 41.0%
- Equity multiple
- 5.23×
- Total profit
- $153,368
- Equity at exit
- $11,197
Cash invested: $36,260 (down + closing). Projections, not guarantees.
Landlord ↔ Tenant lean methodology
- Overall (STATE)
- 18 Strongly Tenant-Friendly
- State California
- 18 Strongly Tenant-Friendly · D+13
- County
- — inherits STATE
- City
- — inherits STATE
ZIP-level market 90280
- Rents YoY
- 5.0%
- Active inventory
- 51
- Price-to-rent
- 4.4×
Monthly cashflow live
- Estimated rent
- $2,477 high interval (Pro) →
- Mortgage (P&I)
- −$679
- Tax est. 1.5%
- −$162 /mo · $1,942/yr
- Insurance
- −$54
- HOA
- −$0
- Vacancy / Maint / Mgmt
- −$520
- Net cashflow
- $1,062
Break-even live
UW: 25.0% down · 7.5% · 30yr · 1.5% tax · 5.0% vac · 8.0% maint · 8.0% mgmt
Financing live
Cash to close
- Down payment
- $32,375
- Closing costs
- $3,885
- Reserves months
- —
- Total cash needed
- —
Loan-product check · same deal, 3 products live
Conventional
25% down · 7.5% · 30yr
- Down + closing
- —
- Monthly P&I
- —
- Monthly cashflow
- —
- DSCR
- —
- Eligible?
- —
Personal DTI + credit; lowest rate.
DSCR
20% down · 8.5% · 30yr
- Down + closing
- —
- Monthly P&I
- —
- Monthly cashflow
- —
- DSCR
- —
- Eligible?
- —
No personal income docs; deal must DSCR.
Hard money
10% down · 12.0% · 12mo
- Down + closing
- —
- Monthly P&I
- —
- Monthly cashflow
- —
- DSCR
- —
- Eligible?
- —
Short-term bridge; refi at stabilization.
Rent comps 20 comps
| Address | Beds | Baths | Sqft | Rent | $/sqft | DOM | Units | Dist |
|---|---|---|---|---|---|---|---|---|
| 5166 Mccallum Ave Unit A South Gate, CA | 2.0 | 1.0 | 900 | $2,500 | $2.78 | 24d | 1 | 0.43mi |
| 5166 McCallum Ave South Gate, CA | 2.0 | 1.0 | 900 | $2,500 | $2.78 | 18d | 1 | 0.43mi |
| 4986 Southern Ave South Gate, CA | 1.0 | 1.0 | 700 | $2,000 | $2.86 | 43d | 1 | 0.62mi |
| 10317 Pinehurst Ave South Gate, CA | 2.0 | 1.0 | 900 | $2,500 | $2.78 | 24d | 1 | 0.73mi |
| 10800 Wright Rd South Gate, CA | 1.0 | 1.0 | 702 | $2,100 | $2.99 | 43d | 4 | 0.85mi |
| 7380 Emily Ln Downey, CA | 1.0–2.0 | 1.0 | 787 | $2,500 | $3.17 | 16d | 4 | 0.97mi |
| 12130 Old River School Rd Downey, CA | 2.0 | 1.0 | 860 | $2,495 | $2.90 | 22d | 1 | 0.98mi |
| 5174 Los Flores Blvd Unit 5174 Lynwood, CA | 3.0 | 2.0 | 1500 | $2,975 | $1.98 | 18d | 1 | 1.00mi |
| 7524 Stewart and Gray Rd Downey, CA | 2.0 | 1.0 | 1050 | $2,895 | $2.76 | 18d | 1 | 1.17mi |
| 7546 Stewart and Gray Rd Downey, CA | 1.0–2.0 | 1.0–2.0 | 925 | $2,000 | $2.16 | 1d | 2 | 1.21mi |
| 10414 Dorothy Ave South Gate, CA | 3.0 | 1.0 | 1271 | $3,900 | $3.07 | 19d | 1 | 1.21mi |
| 5154 Santa Ana St Bell Gardens, CA | 2.0 | 1.0 | 850 | $2,200 | $2.59 | 24d | 1 | 1.22mi |
| 8202 Wilcox Ave Unit 13 Bell Gardens, CA | 3.0 | 1.0 | 1000 | $2,600 | $2.60 | 13d | 1 | 1.24mi |
| 8202 Wilcox Ave Unit 11 Bell Gardens, CA | 3.0 | 1.0 | 1000 | $2,500 | $2.50 | 43d | 1 | 1.24mi |
| 11502 Adco Ave Downey, CA | 1.0 | 1.0 | 750 | $1,825 | $2.43 | 1d | 2 | 1.24mi |
| 5538 Gotham St Unit 5540 Bell Gardens, CA | 3.0 | 2.0 | 1240 | $3,200 | $2.58 | 24d | 1 | 1.32mi |
| 5538 Gotham St Unit 5540 Bell Gardens, CA | 3.0 | 2.0 | 1240 | $3,200 | $2.58 | 43d | 1 | 1.32mi |
| 5928 Gotham St Unit 5932 Bell Gardens, CA | 2.0 | 1.0 | 830 | $2,550 | $3.07 | 1d | 1 | 1.42mi |
| 5928 Gotham St Unit 5930 Bell Gardens, CA | 2.0 | 1.0 | 825 | $2,600 | $3.15 | 1d | 1 | 1.42mi |
| 7947 Garfield Ave Unit F Bell Gardens, CA | 3.0 | 2.5 | 1362 | $3,400 | $2.50 | 1d | 1 | 1.44mi |
Listing history 15 events
-
2026-06-18days on market $129,500 Active 38 DOM
-
2026-06-17days on market $129,500 Active 37 DOM
-
2026-06-16days on market $129,500 Active 36 DOM
-
2026-06-15days on market $129,500 Active 35 DOM
-
2026-06-13days on market $129,500 Active 33 DOM
-
2026-06-13days on market $129,500 Active 32 DOM
-
2026-06-09days on market $129,500 Active 29 DOM
-
2026-06-08days on market $129,500 Active 28 DOM
-
2026-06-07days on market $129,500 Active 27 DOM
-
2026-06-04days on market $129,500 Active 24 DOM
-
2026-06-03days on market $129,500 Active 23 DOM
-
2026-06-02pricedays on market $129,500 Active 22 DOM
-
2026-06-01days on market $130,000 Active 21 DOM
-
2026-05-31days on market $130,000 Active 20 DOM
-
2026-05-11$130,000 Active 846-char remark
ⓘ Source: listings_history table (triggers on properties + properties_extension) + one-shot
backfill from property_details.listing_events for pre-trigger history.
Climate risk First Street
- Flood 6/10 Major FEMA zone X · 74% chance over 30 yrs
- Wildfire 1/10 Low
- Heat 5/10 Major 6 d/yr ≥92°F today · 20 d/yr by 30 yrs out
- Wind 1/10 Low
- Air quality 6/10 Major 10 unhealthy d/yr today · 10 by 30 yrs out
Nearby sold comps map
Loading sold comps map…
Walkable amenities ~0.75 mi
Loading nearby amenities…
Taxation est. · year 1
- Rental income
- $29,725
- − Mortgage interest
- −$7,254
- − Property taxes
- −$1,942
- − Insurance
- −$648
- − Repairs & maintenance
- −$2,378
- − Management
- −$2,378
- − Depreciation
- −$3,767
- Taxable income
- $11,357
- Est. tax owed @ 24.0%
- −$2,726
- After-tax cash flow
- $10,017/yr
For passive investors: Depreciation is non-cash, so a rental often shows a tax loss while cash-flowing — sheltering income. Rental losses are passive: they offset passive income freely, and up to $25,000/yr can offset ordinary (W-2) income if you actively participate and your MAGI is under $100k (phasing out to $0 by $150k); unused losses carry forward. On sale, claimed depreciation is recaptured at up to 25%, and gains may owe capital-gains tax (a 1031 exchange can defer both). Figures are a year-1 estimate at your 24.0% rate — not tax advice; consult a CPA.
Condition & rehab AI · 2 photos
This double-wide mobile home requires significant exterior and interior repairs to improve its condition and value. Painting, flooring replacement, and wall repairs are essential to enhance its appeal and increase its resale or rental value.
Repairs flagged
- Major exterior siding — Severe weathering and peeling
- Major roof — Significant wear and tear
- Major flooring — Worn and in need of replacement
- Major interior walls — Painted walls show significant wear
Value-add opportunities
- Both Painting and exterior repairs — Enhances curb appeal and interior appearance
- Both Flooring replacement — Improves living space and rental appeal
- Both Interior wall repairs — Restores functionality and aesthetic appeal
Renovation cost estimate screening
| Repair item | Severity | Est. cost |
|---|---|---|
| exterior siding · Severe weathering and peeling | Major | $15,000–50,000 |
| roof · Significant wear and tear | Major | $15,000–50,000 |
| flooring · Worn and in need of replacement | Major | $15,000–50,000 |
| interior walls · Painted walls show significant wear | Major | $15,000–50,000 |
| Total estimated repair cost · 4 items | $60,000–200,000 |
Value-add ROI direction
- Both Painting and exterior repairs — Enhances curb appeal and interior appearance ↑
- Both Flooring replacement — Improves living space and rental appeal ↑
- Both Interior wall repairs — Restores functionality and aesthetic appeal ↑
ⓘ Cost ranges are severity-bucket heuristics (US national rule-of-thumb). Get contractor quotes + a written scope before underwriting a rehab budget.
Schools (NCES district)
- District
- Downey Unified
- NCES district ID
- 0611460
- Math proficiency
- 41% ▲ 3.00%
- Reading proficiency
- 53% ▲ 1.00%
- Median HH income
- $61,344
- Composite
- 43.5/100
- National rank
- #6458
- State rank
- #481 of 1400 in CA
Livability — South Gate
- Score
- 63/100
- State rank
- #459
- US rank
- #15665
Category grades
Schools grade is shown separately in the Schools card above.
Census & demographics
- Census place
- South Gate, CA
- County
- Los Angeles County · 9,444,647 people
- City population
- 91,365
- Metro
- Los Angeles-Long Beach-Anaheim, CA
- Population (ZIP)
- 91,365
- Household income
- $74,651
- Rent vs Own
- Severe rent burden
- 4041.0
Population outlook (Los Angeles County) Hauer SSP2
- Today (2025)
- 10,940,515 people
- By 2030
- 11,256,481 · +2.9%
- By 2040
- 11,729,929 · +7.2%
- By 2050
- 11,948,407 · +9.2%
- By 2075
- 11,818,114 · +8.0%
- By 2100
- 10,842,928 · -0.9%
Race, ethnicity, and origin ACS 2023
- Neighborhood character
- Predominantly Hispanic (95%)
- Race & ethnicity
- Hispanic / Latino 95% Two or more races 27% White 3% Native American 2%
- Hispanic origin (detail)
- Mexican 78%
- Foreign-born
- 42% · Canada
- Languages at home
- 16% English-only · Spanish 83%
Political lean MEDSL · Los Angeles
- 2024 margin
- Solid D (+32.9) · D 64.8% · R 31.9% · Other 3.3%
- 2008→2024 swing
- -7.4pp toward R · 2008: 40.4pp · 2024: 32.9pp
- All cycles
- 2024: D+32.9 2020: D+44.2 2016: D+48.0 2012: D+40.0 2008: D+40.4
Not yet ingested
- Civics
- —
Market trends
- HPI YoY
- ▼ -847.77%
- Current HPI
- 419.791
- Rent YoY
- ▲ 4.95%
- Metro
- Los Angeles-Long Beach-Anaheim, CA
- State GDP YoY
- ▲ 3.21%
- F500 in state
- 116
Industry mix (Fortune 500 HQ in CA)
| Industry | F500 HQs | Revenue |
|---|---|---|
| Technology | 27 | $1,492B |
|
||
| Financial Services | 3 | $174B |
|
||
| Retail | 3 | $44B |
|
||
| Insurance | 3 | $26B |
|
||
| Media / Entertainment | 2 | $115B |
|
||
| Pharmaceuticals / Biotech | 2 | $62B |
|
||
Price history
-0.4% since first listed2 events — show timeline
- 2026-06-02 Price Changed $129,500 CRMLS
- 2026-05-11 Listed $130,000 CRMLS
Cash-flow waterfall
monthlySold comps — $/sqft
last 12 mo · ≤1 miLoading sold comps…