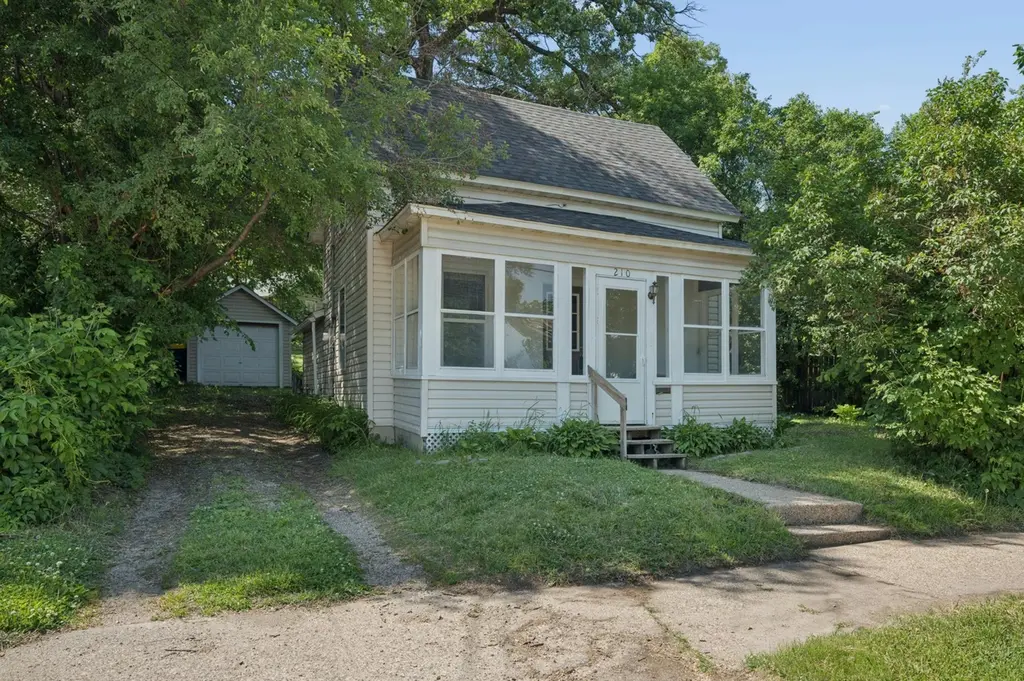
210 Willow St · Faribault, MN
Flood risk 1/10 · Minimal
- FEMA flood zone
- X (unshaded)
- Chance of flooding over 30 yrs
- 0.0%
- Est. flood insurance / yr
- $507 – $1,088
Fire risk 1/10 · Minimal
- Est. fire insurance / yr
- $888 – $1,650
Heat risk 2/10 · Minimal
- Hot days now (above 99°F)
- 7 days/yr
- Hot days in 30 yrs
- 15 days/yr
Wind risk 2/10 · Minimal
- Chance of severe wind over 30 yrs
- —
Air-quality risk 1/10 · Minimal
- Unhealthy air days now
- 0 days/yr
- Unhealthy air days in 30 yrs
- 0 days/yr
Risk factors via First Street. Map © Google.
Why this score? — see what drove the C- grade
The composite is a weighted blend of 9 inputs, each scored 0–100. Each bar is that input's sub-score; the figure is the points it added to the 100-point composite (weight × sub-score).
- Cash flow +23.2/30.0
- ARV discount +7.5/15.0
- DSCR +7.4/10.0
- 1% rule +5.0/10.0
- Livability +3.8/5.0
- Rent growth +2.5/5.0
- Condition / age +2.5/5.0
- Schools +2.3/10.0
- Appreciation +0.0/10.0
$169,900
🖨 Deal sheet 📄 Offer letter ✓ Due diligence
Listing remarks MLS
AFFORDABLE ONE AND HALF STORY HOME WITH NEWER WINDOWS, ROOF AND VINYL SIDING. EXTRA FEATURES INCLUDE CERAMIC TILE, VAULTED KITCHEN CEILING, UPSTAIRS LOFT AND FRONT PORCH. CALL TODAY!!
Key facts
- Patio walk out
- Kitchen appliances
- Vaulted kitchen
Tags
Property features AI
Finance
- Other: Main level finished area listed; total living area listed
- Financial info: Conventional financing
Exterior
- Parking: Gravel parking; 1-car garage
- Utilities: City water; City sewer; 100 amp electric service; Natural gas
- Home design: Residential property; One and one-half levels; Main entry on main level
- Construction: Frame construction; Asphalt roof (over 8 years old); Block foundation
- Exterior features: Front porch; Patio; Vinyl exterior; Irregular lot with medium tree coverage; Underground utilities; City street frontage with curbs, paved streets, sidewalks, street lights, and storm sewer
Interior
- Kitchen: Range; Refrigerator
- Bedrooms: Main floor bedroom (8 x 13); Upper bedroom (10 x 13); Upper loft (9 x 14)
- Bathrooms: One full bathroom on the main floor
- Heating & cooling: Baseboard heating; Window unit(s) for cooling
- Interior features: Vaulted ceiling(s); Eat-in kitchen; Main floor primary bedroom; Renovated
- Laundry & utility: Main level laundry room; Washer; Dryer; Washer/Dryer hookup
Neighborhood map
What this means for you Summary
Snapshot
- This is a 3-bed/1.0-bath single-family listed at $170k.
Deal economics
- At list price, monthly cash flow is $307 ($4k/yr) — positive.
- The deal already cash-flows at list — no discount required.
- Meets the 1% rule at list price ($2k rent vs $170k).
- Cap rate 8.5% vs local median 4.1% in Faribault — top-decile yield for the area; either an underpriced asset or a hidden risk that comps aren't pricing in. Stress-test before assuming the spread holds.
Location & tenants
- Location reads 76/100 on livability (#158 in MN, #3,440 nationally) — a middle-class / working-renter tenant base. Strengths: cost of living A+, housing A+, health & safety A+; Watch: schools C-, employment C-, commute F.
- Faribault Public School District (town): math 17% / reading 34% proficiency, ranked #275 of 301 in MN (top 91%) — low school quality limits family demand, transient renter base, plan for 1-2y turnover.
- Market conditions: 165 active listings in the ZIP; 2 comparable units currently listed for rent nearby; 93 units permitted in Rice County in 2024 (0 in 5+ unit buildings).
Forward outlook
- Local home prices are declining (-3.0%/yr); year-one equity from $1k of loan paydown is wiped out by about $5k of value loss. Plan a longer hold.
Negotiation context
- Only 1 days on market — expect competitive offers; lowballing is unlikely to land.
- 4 sale attempts since 26y ago with the ask held roughly flat each time — persistent listings suggest the price (not the market) is what's stuck; bring a comps-based counter.
- Current owner paid $100k; list at $170k implies a 70% gain — meaningful room to come down on a strong offer.
Risks & watch-outs
- Watch-outs: built in 1920 — expect roof / HVAC / electrical / plumbing capex.
Questions for the listing agent
- Built in 1920 — when were the roof, HVAC, electrical panel, plumbing, and water heater last replaced?
- Is there a deadline driving the sale (1031 exchange, divorce, estate, relocation)? That informs how much negotiation room exists.
- What's the average days-on-market for RENTAL listings here right now (not sales)? A rising rental-DOM trend means longer vacancies and softer asking-rent achievability than the comps imply.
- What's the recent tenant-quality profile in this submarket — average credit score on applications, eviction rate, late-payment / NSF rate, and stable-employment percentage? A property-management company in the area should have these aggregated.
- How much new for-sale + rental construction is in the pipeline within 1–3 miles? Heavy new supply typically softens prices + rents 12–24 months out; constrained supply supports both.
Investment metrics
- 1% rule
- 1.00% ✓
- Cap rate
- 8.46%
- Cash-on-cash
- 7.75%
- DSCR
- 1.34
- GRM
- 8.3
CMA / ARV
No comps found within radius.
Projected returns pro-forma
-3.0% appreciation · 3.0% rent growth · sell at horizon
- IRR
- -4.5%
- Equity multiple
- 0.83×
- Total profit
- $-8,027
- Equity at exit
- $25,333
- IRR
- 5.1%
- Equity multiple
- 1.38×
- Total profit
- $17,971
- Equity at exit
- $14,690
Cash invested: $47,572 (down + closing). Projections, not guarantees.
Landlord ↔ Tenant lean methodology
- Overall (STATE)
- 46 Balanced
- State Minnesota
- 46 Balanced · D+2
- County
- — inherits STATE
- City
- — inherits STATE
ZIP-level market 55021
- Home prices YoY
- -26.9%
- Active inventory
- 165
- Price-to-rent
- 8.3×
Monthly cashflow live
- Estimated rent
- $1,707 medium interval (Pro) →
- Mortgage (P&I)
- −$891
- Tax from tax record
- −$80 /mo · $956/yr
- Insurance
- −$71
- HOA
- −$0
- Vacancy / Maint / Mgmt
- −$358
- Net cashflow
- $307
Break-even live
UW: 25.0% down · 7.5% · 30yr · 1.5% tax · 5.0% vac · 8.0% maint · 8.0% mgmt
Financing live
Cash to close
- Down payment
- $42,475
- Closing costs
- $5,097
- Reserves months
- —
- Total cash needed
- —
Loan-product check · same deal, 3 products live
Conventional
25% down · 7.5% · 30yr
- Down + closing
- —
- Monthly P&I
- —
- Monthly cashflow
- —
- DSCR
- —
- Eligible?
- —
Personal DTI + credit; lowest rate.
DSCR
20% down · 8.5% · 30yr
- Down + closing
- —
- Monthly P&I
- —
- Monthly cashflow
- —
- DSCR
- —
- Eligible?
- —
No personal income docs; deal must DSCR.
Hard money
10% down · 12.0% · 12mo
- Down + closing
- —
- Monthly P&I
- —
- Monthly cashflow
- —
- DSCR
- —
- Eligible?
- —
Short-term bridge; refi at stabilization.
Rent comps 2 comps
| Address | Beds | Baths | Sqft | Rent | $/sqft | DOM | Units | Dist |
|---|---|---|---|---|---|---|---|---|
| 429 8th Ave NW Faribault, MN | 1.0–2.0 | 1.0 | 787 | $1,550 | $1.97 | 5d | 7 | 0.82mi |
| 1250 Autumn Dr Faribault, MN | 1.0–3.0 | 1.0 | 814 | $1,350 | $1.66 | 24d | 5 | 1.12mi |
Listing history 2 events
-
2026-06-05remarks 420-char remark
-
2026-06-05$169,900 Active 1 DOM
ⓘ Source: listings_history table (triggers on properties + properties_extension) + one-shot
backfill from property_details.listing_events for pre-trigger history.
Tax reassessment forecast MN · Partial reset (capped growth)
- Current annual tax
- $956 · $80/mo
- Projected year-2 tax
- $1,429 · $119/mo
- Expected delta
- +$473/yr (+$39/mo · 49.5%)
ⓘ Screening estimate from a state-policy table — verify with the county assessor before closing.
Climate risk First Street
- Flood 1/10 Low FEMA zone X (unshaded) · 0% chance over 30 yrs
- Wildfire 1/10 Low
- Heat 2/10 Low 7 d/yr ≥99°F today · 15 d/yr by 30 yrs out
- Wind 2/10 Low
- Air quality 1/10 Low 0 unhealthy d/yr today · 0 by 30 yrs out
Nearby sold comps map
Loading sold comps map…
Walkable amenities ~0.75 mi
Loading nearby amenities…
Taxation est. · year 1
- Rental income
- $20,484
- − Mortgage interest
- −$9,517
- − Property taxes
- −$956
- − Insurance
- −$850
- − Repairs & maintenance
- −$1,639
- − Management
- −$1,639
- − Depreciation
- −$4,943
- Taxable income
- $942
- Est. tax owed @ 24.0%
- −$226
- After-tax cash flow
- $3,459/yr
For passive investors: Depreciation is non-cash, so a rental often shows a tax loss while cash-flowing — sheltering income. Rental losses are passive: they offset passive income freely, and up to $25,000/yr can offset ordinary (W-2) income if you actively participate and your MAGI is under $100k (phasing out to $0 by $150k); unused losses carry forward. On sale, claimed depreciation is recaptured at up to 25%, and gains may owe capital-gains tax (a 1031 exchange can defer both). Figures are a year-1 estimate at your 24.0% rate — not tax advice; consult a CPA.
Schools (NCES district)
- District
- Faribault Public School District
- NCES district ID
- 2711760
- Math proficiency
- 17% ▼ -18.00%
- Reading proficiency
- 34% ▼ -8.00%
- Median HH income
- $54,584
- Composite
- 22.85/100
- National rank
- #8011
- State rank
- #275 of 301 in MN
Livability — Faribault
- Score
- 76/100
- State rank
- #158
- US rank
- #3440
Category grades
Schools grade is shown separately in the Schools card above.
Census & demographics
- Census place
- Faribault, MN
- County
- Rice County · 56,558 people
- City population
- 30,908
- Metro
- Faribault-Northfield, MN
- Population (ZIP)
- 30,908
- Household income
- $68,820
- Rent vs Own
- Severe rent burden
- 755.0
Population outlook (Rice County) Hauer SSP2
- Today (2025)
- 66,716 people
- By 2030
- 67,352 · +1.0%
- By 2040
- 67,595 · +1.3%
- By 2050
- 67,074 · +0.5%
- By 2075
- 66,641 · -0.1%
- By 2100
- 66,205 · -0.8%
Race, ethnicity, and origin ACS 2023
- Neighborhood character
- Predominantly White (71%)
- Race & ethnicity
- White 71% Black 13% Hispanic / Latino 12% Two or more races 6% Asian 1%
- Hispanic origin (detail)
- Mexican 9%
- Common ancestry
- Portuguese 9% Lithuanian 3% Romanian 2%
- Foreign-born
- 11% · Canada
- Languages at home
- 82% English-only · Spanish 9% Other Asian/Pacific 1%
Political lean MEDSL · Rice
- 2024 margin
- Toss-up / Even · D 47.8% · R 50.3% · Other 1.8%
- 2008→2024 swing
- -14.0pp toward R · 2008: 11.5pp · 2024: -2.5pp
- All cycles
- 2024: R+2.5 2020: R+0.2 2016: R+3.1 2012: D+8.3 2008: D+11.5
Not yet ingested
- Civics
- —
Market trends
- HPI YoY
- ▼ -93.12%
- Current HPI
- 253.3996
- Rent YoY
- —
- Metro
- Faribault-Northfield, MN
- State GDP YoY
- ▲ 2.41%
- F500 in state
- 34
Industry mix (Fortune 500 HQ in MN)
| Industry | F500 HQs | Revenue |
|---|---|---|
| Healthcare | 2 | $407B |
|
||
| Retail | 2 | $150B |
|
||
| Consumer Goods | 2 | $32B |
|
||
| Industrial Machinery | 2 | $6B |
|
||
| Agriculture | 1 | $40B |
|
||
| Healthcare / Medical Devices | 1 | $32B |
|
||
Price history
+566.3% since first listed13 events — show timeline
- 2026-06-04 Listed $169,900 NORTHSTARMLS as Distributed by MLS Grid
- 2006-08-08 Sold (Public Records) $99,900 Public Records
- 2006-07-28 Sold (MLS) $99,900 NORTHSTARMLS as Distributed by MLS Grid
- 2006-06-07 Listing Removed — NORTHSTARMLS as Distributed by MLS Grid
- 2006-04-05 Listed $99,900 NORTHSTARMLS as Distributed by MLS Grid
- 2001-07-20 Sold (Public Records) $82,900 Public Records
- 2001-07-20 Sold (MLS) $82,900 NORTHSTARMLS as Distributed by MLS Grid
- 2001-06-22 Listing Removed — NORTHSTARMLS as Distributed by MLS Grid
- 2001-05-23 Listed $79,900 NORTHSTARMLS as Distributed by MLS Grid
- 2000-12-14 Sold (MLS) $20,000 NORTHSTARMLS as Distributed by MLS Grid
- 2000-12-12 Sold (Public Records) $20,000 Public Records
- 2000-11-10 Listing Removed — NORTHSTARMLS as Distributed by MLS Grid
- 2000-07-14 Listed $25,500 NORTHSTARMLS as Distributed by MLS Grid
Property tax history
+6.9%/yrLatest (2025): $956 · -10.5% YoY. Source: county tax records.
Cash-flow waterfall
monthlySold comps — $/sqft
last 12 mo · ≤1 miLoading sold comps…