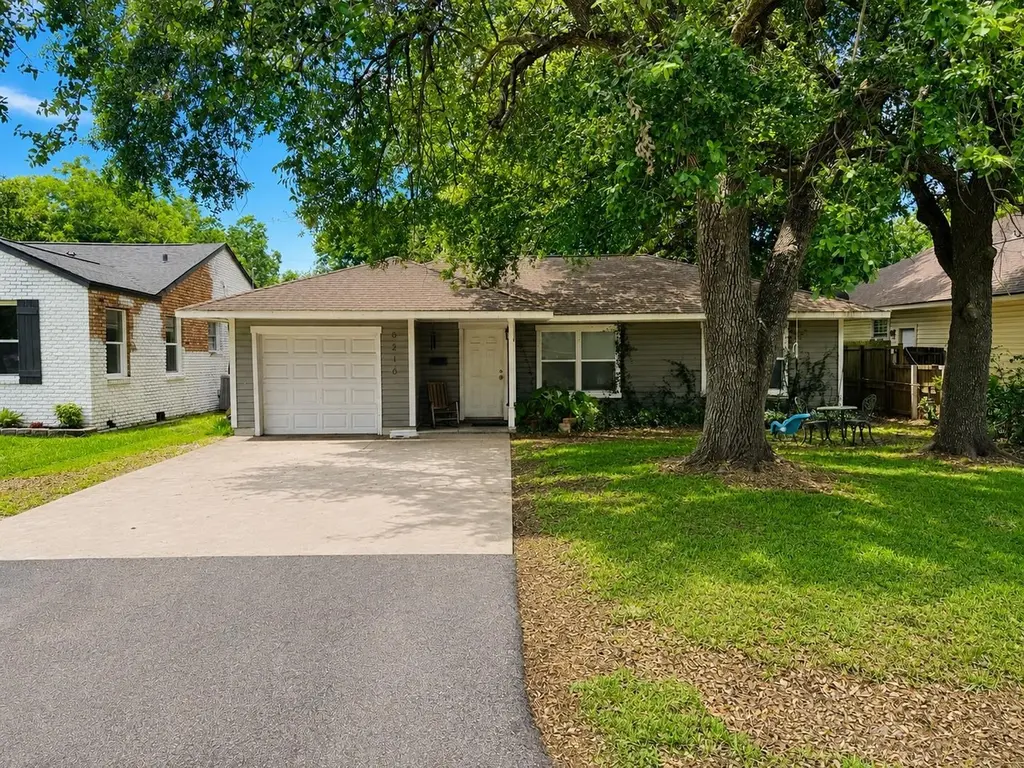
6210 East Dr · Groves, TX
Flood risk 8/10 · Major
- FEMA flood zone
- X (shaded)
- Chance of flooding over 30 yrs
- 0.75%
- Est. flood insurance / yr
- $507 – $1,088
Fire risk 1/10 · Minimal
- Est. fire insurance / yr
- $1,222 – $2,270
Heat risk 9/10 · Severe
- Hot days now (above 110°F)
- 7 days/yr
- Hot days in 30 yrs
- 25 days/yr
Wind risk 9/10 · Severe
- Chance of severe wind over 30 yrs
- 99.0%
Air-quality risk 2/10 · Minimal
- Unhealthy air days now
- 1 days/yr
- Unhealthy air days in 30 yrs
- 1 days/yr
Risk factors via First Street. Map © Google.
Why this score? — see what drove the C grade
The composite is a weighted blend of 9 inputs, each scored 0–100. Each bar is that input's sub-score; the figure is the points it added to the 100-point composite (weight × sub-score).
- Cash flow +21.6/30.0
- ARV discount +10.8/15.0
- 1% rule +7.1/10.0
- DSCR +6.9/10.0
- Schools +3.9/10.0
- Livability +3.6/5.0
- Rent growth +2.5/5.0
- Condition / age +2.5/5.0
- Appreciation +0.0/10.0
$108,000
🖨 Deal sheet (PDF) 📄 Offer letter ✓ Due diligence
Listing remarks MLS
This is the perfect 2/1/1 starter home in PNGISD ready to be your new home! Property has been completely renovated including all new flooring, paint interior and exterior, trim, cabinets, appliances, doors, and more! Lots of natural lighting throughout bring an inviting charm to this home. Spacious, fenced backyard to enjoy those upcoming Summer days and nights. Call to make your appointment to tour today!
Key facts
- 6,970 sq ft lot
- Garage
- Listed 4 days
Property features AI
Exterior
- Parking: Attached 1-car garage
- Utilities: Public water; Public sewer
- Home design: Single-family residence; Residential property; Located in the East Port Arthur subdivision
- Construction: Brick veneer construction; Slab foundation
- Exterior features: Chain link fencing; Composition roof
Interior
- Kitchen: Dishwasher; Range
- Bathrooms: 1 full bathroom
- Heating & cooling: Central heating (natural gas); Central air conditioning
- Interior features: Dishwasher; Range
Neighborhood map
What this means for you Summary
Snapshot
- This is a 2-bed/1.0-bath single-family listed at $108k.
Deal economics
- At list price, monthly cash flow is $98 ($1k/yr) — positive.
- The deal already cash-flows at list — no discount required.
- Meets the 1% rule at list price ($1k rent vs $108k).
- Cap rate 8.1% vs local median 4.0% in Groves — top-decile yield for the area; either an underpriced asset or a hidden risk that comps aren't pricing in. Stress-test before assuming the spread holds.
Location & tenants
- Location reads 71/100 on livability (#315 in TX) — a middle-class / working-renter tenant base. Strengths: cost of living A+, housing A+, health & safety A; Watch: employment C-, amenities F, commute F.
- Port Neches-Groves ISD (suburban): math 42% / reading 47% proficiency, ranked #260 of 826 in TX (top 32%) — families likely to look elsewhere, expect single-tenant / working-renter base with shorter leases.
- Market conditions: 92 active listings in the ZIP; 10 comparable units currently listed for rent nearby; rentals at typical pace (median 15d on market — plan ~3-4 weeks tenant-placement turnaround); 343 units permitted in Jefferson County in 2024 (0 in 5+ unit buildings).
Forward outlook
- Local home prices are declining (-3.0%/yr); year-one equity from $747 of loan paydown is wiped out by about $3k of value loss. Plan a longer hold.
Negotiation context
- Only 4 days on market — expect competitive offers; lowballing is unlikely to land.
- 2 sale attempts since 7y ago with the ask held roughly flat each time — persistent listings suggest the price (not the market) is what's stuck; bring a comps-based counter.
Risks & watch-outs
- Watch-outs: property tax is 2.9% of price; flood insurance adds $66/mo.
- Climate carrying-cost: severe flood risk; severe wind risk, 99% chance of damaging wind over 30y; extreme-heat days projected 7→25/yr by 2055 (HVAC capex compounding) — expect insurance premiums to compound above CPI over the hold.
Questions for the listing agent
- Built in 1978 — when were the roof, HVAC, electrical panel, plumbing, and water heater last replaced?
- Property tax is high relative to price — has the assessment been appealed recently, and will the sale trigger a re-assessment?
- What's the actual annual flood-insurance premium (NFIP or private), and is the property in a SFHA with mandatory coverage?
- Is there a deadline driving the sale (1031 exchange, divorce, estate, relocation)? That informs how much negotiation room exists.
- What's the average days-on-market for RENTAL listings here right now (not sales)? A rising rental-DOM trend means longer vacancies and softer asking-rent achievability than the comps imply.
- What's the recent tenant-quality profile in this submarket — average credit score on applications, eviction rate, late-payment / NSF rate, and stable-employment percentage? A property-management company in the area should have these aggregated.
- How much new for-sale + rental construction is in the pipeline within 1–3 miles? Heavy new supply typically softens prices + rents 12–24 months out; constrained supply supports both.
Investment metrics
- 1% rule
- 1.21% ✓
- Cap rate
- 8.12%
- Cash-on-cash
- 6.54%
- DSCR
- 1.29
- GRM
- 6.9
CMA / ARV
- ARV (on-the-fly)
- $116,616
- Comps found
- 5
Show comp detail 5 sales within ~0.75 mi
| Address | Dist | Beds/Ba | Sqft | Sold | Price | $/sf | Match |
|---|---|---|---|---|---|---|---|
| 6310 25th St | 0.32mi | 2/1.0 | 1,017 (-2%) | 7mo | $115,000 | $113 | 77 |
| 3125 South Dr | 0.10mi | 3/1.0 (+1) | 1,130 (+10%) | 2mo | $184,900 | $164 | 73 |
| 5301 North St | 0.72mi | 2/1.0 | 960 (-7%) | 6mo | $92,700 | $97 | 49 |
| 2400 Owens Ave | 0.45mi | 3/1.0 (+1) | 1,124 (+9%) | 21mo | $61,400 | $55 | 42 |
| 3701 Doyle Ave Ave | 0.56mi | 1/1.0 (-1) | 920 (-11%) | 18mo | $120,000 | $130 | 36 |
Match score weights: distance 35% · size 25% · config 20% · recency 20%. Top-matched comps best support the ARV.
Projected returns pro-forma
-3.0% appreciation · 3.0% rent growth · sell at horizon
- IRR
- -10.0%
- Equity multiple
- 0.63×
- Total profit
- $-11,096
- Equity at exit
- $16,103
- IRR
- -0.5%
- Equity multiple
- 0.97×
- Total profit
- $-1,037
- Equity at exit
- $9,338
Cash invested: $30,240 (down + closing). Projections, not guarantees.
Landlord ↔ Tenant lean methodology
- Overall (STATE)
- 87 Strongly Landlord-Friendly
- State Texas
- 87 Strongly Landlord-Friendly · R+5
- County
- — inherits STATE
- City
- — inherits STATE
ZIP-level market 77619
- Active inventory
- 92
- Price-to-rent
- 6.9×
Monthly cashflow live
- Estimated rent
- $1,309 high interval (Pro) →
- Mortgage (P&I)
- −$566
- Tax from tax record
- −$258 /mo · $3,096/yr
- Insurance
- −$45
- Flood insurance flood zone
- −$66 /mo · $798/yr
- HOA
- −$0
- Vacancy / Maint / Mgmt
- −$275
- Net cashflow
- $98
Break-even live
Sensitivity live
| Price | -10% $160 | -5% $129 | +0% $98 | +5% $68 | +10% $37 |
|---|---|---|---|---|---|
| Rent | -10% $-5 | -5% $47 | +0% $98 | +5% $150 | +10% $202 |
| Rate | -1.0pp $153 | -0.5pp $126 | base $98 | +0.5pp $70 | +1.0pp $42 |
UW: 25.0% down · 7.5% · 30yr · 1.5% tax · 5.0% vac · 8.0% maint · 8.0% mgmt
Financing live
Cash to close
- Down payment
- $27,000
- Closing costs
- $3,240
- Reserves months
- —
- Total cash needed
- —
Loan-product check · same deal, 3 products live
Conventional
25% down · 7.5% · 30yr
- Down + closing
- —
- Monthly P&I
- —
- Monthly cashflow
- —
- DSCR
- —
- Eligible?
- —
Personal DTI + credit; lowest rate.
DSCR
20% down · 8.5% · 30yr
- Down + closing
- —
- Monthly P&I
- —
- Monthly cashflow
- —
- DSCR
- —
- Eligible?
- —
No personal income docs; deal must DSCR.
Hard money
10% down · 12.0% · 12mo
- Down + closing
- —
- Monthly P&I
- —
- Monthly cashflow
- —
- DSCR
- —
- Eligible?
- —
Short-term bridge; refi at stabilization.
Rent comps 10 comps
| Address | Beds | Baths | Sqft | Rent | $/sqft | DOM | Units | Dist |
|---|---|---|---|---|---|---|---|---|
| 6110 Willis St Groves, TX | 2.0 | 1.0 | 1100 | $1,200 | $1.09 | 45d | 1 | 0.20mi |
| 5989 32nd St Groves, TX | 2.0 | 1.0 | 1074 | $1,400 | $1.30 | 14d | 1 | 0.37mi |
| 3141 Boyd Ave Groves, TX | 2.0 | 2.0 | 1200 | $1,375 | $1.15 | 44d | 1 | 0.52mi |
| 6255 Warren St Groves, TX | 2.0 | 1.0 | 980 | $2,600 | $2.65 | 14d | 1 | 0.55mi |
| 6255 Warren St Apt F Groves, TX | 2.0 | 1.0 | 980 | $1,295 | $1.32 | 14d | 1 | 0.55mi |
| 2628 4th Ave Groves, TX | 3.0 | 1.0 | 952 | $1,295 | $1.36 | 22d | 1 | 0.69mi |
| 6800 Camden Ln Unit 21 Groves, TX | 1.0 | 1.0 | 740 | $850 | $1.15 | 24d | 1 | 0.80mi |
| 6824 Camden Ln #8 Groves, TX | 1.0 | 1.0 | 850 | $875 | $1.03 | 14d | 1 | 0.85mi |
| 3431 Canal Ave Unit 1 Groves, TX | 2.0 | 1.0 | 952 | $1,000 | $1.05 | 14d | 1 | 0.86mi |
| 5235 33rd St Unit 1 Groves, TX | 2.0 | 1.0 | 1400 | $1,400 | $1.00 | 14d | 1 | 0.89mi |
Listing history 4 events
-
2026-06-07statusdays on market $108,000 Pending 4 DOM
-
2026-06-03days on market $108,000 Active 2 DOM
-
2026-06-02remarks 410-char remark
-
2026-06-02$108,000 Active 1 DOM
ⓘ Source: listings_history table (triggers on properties + properties_extension) + one-shot
backfill from property_details.listing_events for pre-trigger history.
Tax reassessment forecast TX · Resets to sale price
- Current annual tax
- $3,096 · $258/mo
- Projected year-2 tax
- $3,096 · $258/mo
- Expected delta
- $0/yr ($0/mo · 0.0%)
ⓘ Screening estimate from a state-policy table — verify with the county assessor before closing.
Climate risk First Street
- Flood 8/10 Severe FEMA zone X (shaded) · 75% chance over 30 yrs
- Wildfire 1/10 Low
- Heat 9/10 Extreme 7 d/yr ≥110°F today · 25 d/yr by 30 yrs out
- Wind 9/10 Extreme 99% chance of damaging wind over 30 yrs
- Air quality 2/10 Low 1 unhealthy d/yr today · 1 by 30 yrs out
Nearby sold comps map
Loading sold comps map…
Walkable amenities ~0.75 mi
Loading nearby amenities…
Taxation est. · year 1
- Rental income
- $15,711
- − Mortgage interest
- −$6,050
- − Property taxes
- −$3,096
- − Insurance
- −$1,338
- − Repairs & maintenance
- −$1,257
- − Management
- −$1,257
- − Depreciation
- −$3,142
- Taxable loss
- −$429
- Est. tax savings @ 24.0%
- +$103
- After-tax cash flow
- $1,284/yr
For passive investors: Depreciation is non-cash, so a rental often shows a tax loss while cash-flowing — sheltering income. Rental losses are passive: they offset passive income freely, and up to $25,000/yr can offset ordinary (W-2) income if you actively participate and your MAGI is under $100k (phasing out to $0 by $150k); unused losses carry forward. On sale, claimed depreciation is recaptured at up to 25%, and gains may owe capital-gains tax (a 1031 exchange can defer both). Figures are a year-1 estimate at your 24.0% rate — not tax advice; consult a CPA.
Schools (NCES district)
- District
- Port Neches-Groves ISD
- NCES district ID
- 4835430
- Math proficiency
- 42% ▼ -13.00%
- Reading proficiency
- 47% ▼ -5.00%
- Median HH income
- $54,661
- Composite
- 38.65/100
- National rank
- #4152
- State rank
- #260 of 826 in TX
Livability — Groves
- Score
- 71/100
- State rank
- #315
- US rank
- #7031
Category grades
Schools grade is shown separately in the Schools card above.
Census & demographics
- Census place
- Groves, TX
- County
- Jefferson County · 203,592 people
- City population
- 16,976
- Metro
- Beaumont-Port Arthur, TX
- Population (ZIP)
- 16,976
- Household income
- $73,710
- Rent vs Own
- Severe rent burden
- 131.0
Population outlook (Jefferson County) Hauer SSP2
- Today (2025)
- 259,015 people
- By 2030
- 260,685 · +0.6%
- By 2040
- 263,309 · +1.7%
- By 2050
- 265,237 · +2.4%
- By 2075
- 270,193 · +4.3%
- By 2100
- 255,628 · -1.3%
Race, ethnicity, and origin ACS 2023
- Neighborhood character
- Diverse neighborhood (Simpson 0.62)
- Race & ethnicity
- White 53% Hispanic / Latino 30% Two or more races 18% Black 9% Asian 6%
- Hispanic origin (detail)
- Mexican 24% Dominican 2%
- Common ancestry
- Lithuanian 10% Serbian 1% Slovak 1%
- Foreign-born
- 16% · Canada, Vietnam, Jamaica
- Languages at home
- 72% English-only · Spanish 20% Vietnamese 5% Other Asian/Pacific 2%
Political lean MEDSL · Jefferson
- 2024 margin
- Lean R (+8.9) · D 45.1% · R 54.0%
- 2008→2024 swing
- -11.1pp toward R · 2008: 2.2pp · 2024: -8.9pp
- All cycles
- 2024: R+8.9 2020: R+1.6 2016: R+0.5 2012: D+1.6 2008: D+2.2
Not yet ingested
- Civics
- —
Market trends
- HPI YoY
- ▼ -235.42%
- Current HPI
- 183.1358
- Rent YoY
- —
- Metro
- Beaumont-Port Arthur, TX
- State GDP YoY
- ▲ 3.95%
- F500 in state
- 110
Industry mix (Fortune 500 HQ in TX)
| Industry | F500 HQs | Revenue |
|---|---|---|
| Energy | 16 | $1,198B |
|
||
| Technology | 5 | $198B |
|
||
| Engineering / Construction | 4 | $72B |
|
||
| Energy Services | 3 | $60B |
|
||
| Utilities | 3 | $41B |
|
||
| Healthcare | 2 | $330B |
|
||
Price history
-1.7% since first listed5 events — show timeline
- 2026-06-01 Listed $108,000 BBOR
- 2019-07-03 Sold (Public Records) — Public Records
- 2019-07-02 Sold (MLS) — BBOR
- 2019-05-12 Listed $109,900 BBOR
- 2010-02-19 Sold (Public Records) — Public Records
Property tax history
+4.2%/yrLatest (2025): $3,096 · +9.6% YoY. Source: county tax records.
Cash-flow waterfall
monthlySold comps — $/sqft
last 12 mo · ≤1 miLoading sold comps…