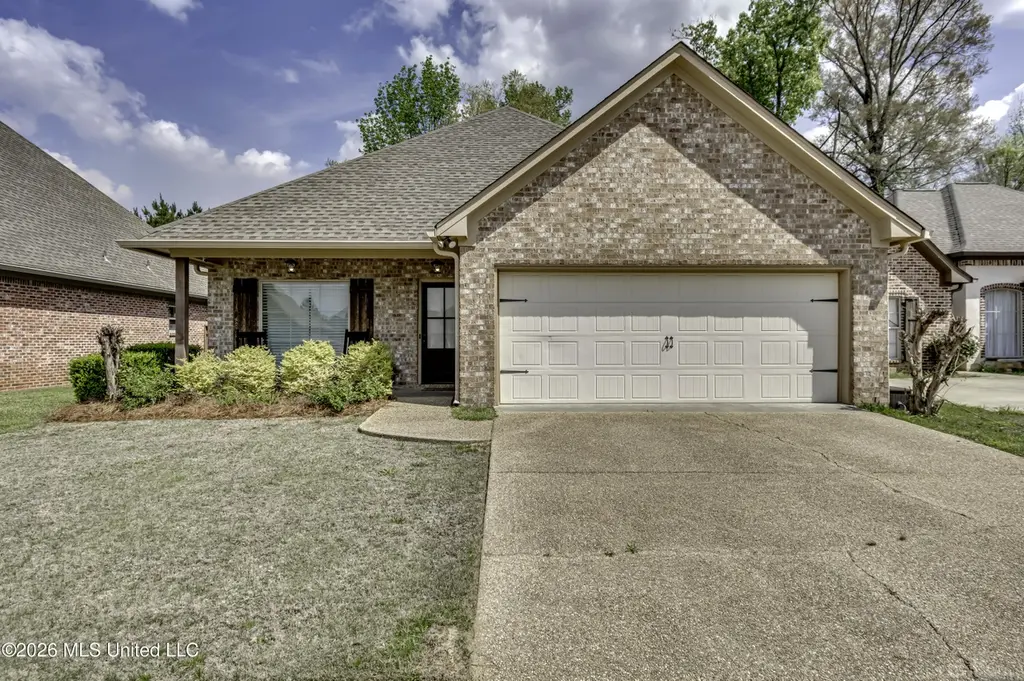
2017 Pebble Creek Dr · Brandon, MS
Flood risk 6/10 · Moderate
- FEMA flood zone
- X (unshaded)
- Chance of flooding over 30 yrs
- 0.68%
- Est. flood insurance / yr
- $507 – $1,088
Fire risk 4/10 · Minor
- Est. fire insurance / yr
- $1,241 – $2,305
Heat risk 7/10 · Major
- Hot days now (above 108°F)
- 7 days/yr
- Hot days in 30 yrs
- 21 days/yr
Wind risk 8/10 · Major
- Chance of severe wind over 30 yrs
- 80.0%
Air-quality risk 2/10 · Minimal
- Unhealthy air days now
- 0 days/yr
- Unhealthy air days in 30 yrs
- 1 days/yr
Risk factors via First Street. Map © Google.
Why this score? — see what drove the D+ grade
The composite is a weighted blend of 9 inputs, each scored 0–100. Each bar is that input's sub-score; the figure is the points it added to the 100-point composite (weight × sub-score).
- Cash flow +14.2/30.0
- ARV discount +10.7/15.0
- Schools +4.6/10.0
- DSCR +4.3/10.0
- Rent growth +4.3/5.0
- Livability +4.0/5.0
- 1% rule +3.5/10.0
- Condition / age +2.5/5.0
- Appreciation +0.0/10.0
$268,000
🖨 Deal sheet 📄 Offer letter ✓ Due diligence
Listing remarks MLS
Welcome to this charming 3 bedroom, 2 bath home located in the desirable Stonebridge subdivision! This well-maintained property offers a functional, open layout with spacious living areas and abundant natural light throughout--perfect for both everyday living and entertaining. The primary suite features a double vanity and a spacious walk-in shower. Outside you will find a peaceful backyard setting, ideal for relaxing or hosting guests. Residents of Stonebridge also enjoy access to community amenities, including a pool, playground, and clubhouse. Schedule a showing with your Realtor today!
Key facts
- 5,227 sq ft lot
- 2 garage spots
- Community pool
Neighborhood map
What this means for you Summary
Snapshot
- This is a 3-bed/2.0-bath single-family listed at $268k.
Deal economics
- At list price, monthly cash flow is $42 ($504/yr) — positive.
- The deal already cash-flows at list — no discount required.
- To meet the 1% rule (rent ≥ 1% of price), the offer needs to be $229k (14.6% below list).
- Recommended offer: $229k (14.6% below list) — sets the bar for 1% rule.
- Cap rate 6.5% vs local median 4.2% in Brandon — top-decile yield for the area; either an underpriced asset or a hidden risk that comps aren't pricing in. Stress-test before assuming the spread holds.
Location & tenants
- Location reads 81/100 on livability (#3 in MS, #1,514 nationally) — a professional / high-income tenant draw. Strengths: crime A+, employment A+, cost of living A+; Watch: amenities F, commute F.
- Rankin County School District (rural): math 56% / reading 48% proficiency, ranked #6 of 130 in MS (top 5%) — acceptable for families but not a draw, mixed tenant base, ~2y average lease.
- Market conditions: Rents rising fast (+7.1%/yr); 302 active listings in the ZIP; 2 comparable units currently listed for rent nearby; solid renter incomes; 343 units permitted in Rankin County in 2024 (0 in 5+ unit buildings).
- This rent runs 31% of the median local income ($89k/yr) — at the standard rent-burdened threshold; future hikes will face affordability resistance.
Forward outlook
- Local home prices are declining (-3.0%/yr); year-one equity from $2k of loan paydown is wiped out by about $8k of value loss. Plan a longer hold.
- Rankin County population projected at +17% by 2050 — long-run rental-demand tailwind backs the buy-and-hold thesis.
Negotiation context
- It's been on market 69 days — a 6% lower offer ($252k) is reasonable based on typical stale-listing flexibility.
- 8 sale attempts since 17y ago with the ask held roughly flat each time — persistent listings suggest the price (not the market) is what's stuck; bring a comps-based counter.
Risks & watch-outs
- Climate carrying-cost: major flood risk; severe wind risk, 80% chance of damaging wind over 30y; extreme-heat days projected 7→21/yr by 2055 (HVAC capex compounding) — expect insurance premiums to compound above CPI over the hold.
Questions for the listing agent
- It's been on market 69 days. Have you received any prior offers? Is the seller open to a 15% concession, seller financing, or rate buy-down credit?
- Why hasn't it sold? Are there any deal-killer items the seller is aware of (foundation, flood, title, zoning, code violations)?
- Is there a deadline driving the sale (1031 exchange, divorce, estate, relocation)? That informs how much negotiation room exists.
- Schools are A-rated — typically a magnet for longer-tenancy family renters. What's the average tenant stay here, and is there a school-zone premium baked into asking?
- The area grade is low — what's the realistic commute time and amenity access for the typical tenant pool here? Any planned neighborhood developments (good or bad) we should know about?
- What's the average days-on-market for RENTAL listings here right now (not sales)? A rising rental-DOM trend means longer vacancies and softer asking-rent achievability than the comps imply.
- What's the recent tenant-quality profile in this submarket — average credit score on applications, eviction rate, late-payment / NSF rate, and stable-employment percentage? A property-management company in the area should have these aggregated.
- How much new for-sale + rental construction is in the pipeline within 1–3 miles? Heavy new supply typically softens prices + rents 12–24 months out; constrained supply supports both.
Investment metrics
- 1% rule
- 0.85% ✗
- Cap rate
- 6.48%
- Cash-on-cash
- 0.67%
- DSCR
- 1.03
- GRM
- 9.8
CMA / ARV
- ARV (median comp)
- $288,724
- List price
- $268,000
- Delta
- -7.18%
- Verdict
- FAIR
- Comps
- 20 within 1.0 mi
Show comp detail 12 sales within ~0.75 mi
| Address | Dist | Beds/Ba | Sqft | Sold | Price | $/sf | Match |
|---|---|---|---|---|---|---|---|
| 409 Sand Stone Pl | 0.10mi | 3/2.0 | 1,633 (+2%) | 5mo | $244,000 | $149 | 88 |
| 217 Stonebridge Blvd | 0.16mi | 3/2.0 | 1,628 (+2%) | 5mo | $269,900 | $166 | 86 |
| 309 Flagstone Dr | 0.11mi | 3/2.0 | 1,518 (-5%) | 2mo | $265,000 | $175 | 85 |
| 509 Stone Brook Pl | 0.25mi | 4/2.0 (+1) | 1,600 (0%) | 2mo | $289,999 | $181 | 82 |
| 538 Stone Brook Pl | 0.33mi | 3/2.0 | 1,555 (-3%) | 1mo | $284,999 | $183 | 80 |
| 505 Stone Brook Pl | 0.25mi | 4/2.0 (+1) | 1,600 (0%) | 6mo | $289,999 | $181 | 78 |
| 244 Stonebridge Blvd | 0.31mi | 3/2.0 | 1,531 (-4%) | 0mo | $270,000 | $176 | 78 |
| 503 Stone Brook Pl | 0.25mi | 3/2.0 | 1,675 (+5%) | 5mo | $292,999 | $175 | 76 |
| 535 Stone Brook Pl | 0.32mi | 3/2.0 | 1,675 (+5%) | 6mo | $292,999 | $175 | 72 |
| 507 Stone Brook Pl | 0.25mi | 3/2.0 | 1,750 (+9%) | 4mo | $299,999 | $171 | 69 |
| 534 Stone Brook Pl | 0.32mi | 3/2.0 | 1,750 (+9%) | 2mo | $299,999 | $171 | 68 |
| 115 Lennox Pl | 0.72mi | 3/2.0 | 1,740 (+9%) | 3mo | $275,000 | $158 | 49 |
Match score weights: distance 35% · size 25% · config 20% · recency 20%. Top-matched comps best support the ARV.
Projected returns pro-forma
-3.0% appreciation · 7.13% rent growth · sell at horizon
- IRR
- -10.9%
- Equity multiple
- 0.59×
- Total profit
- $-30,865
- Equity at exit
- $39,960
- IRR
- 3.3%
- Equity multiple
- 1.28×
- Total profit
- $20,765
- Equity at exit
- $23,172
Cash invested: $75,040 (down + closing). Projections, not guarantees.
Landlord ↔ Tenant lean methodology
- Overall (STATE)
- 90 Strongly Landlord-Friendly
- State Mississippi
- 90 Strongly Landlord-Friendly · R+11
- County
- — inherits STATE
- City
- — inherits STATE
ZIP-level market 39042
- Home prices YoY
- -34.3%
- Rents YoY
- 7.1%
- Active inventory
- 302
- Price-to-rent
- 9.8×
Monthly cashflow live
- Estimated rent
- $2,289 medium interval (Pro) →
- Mortgage (P&I)
- −$1,405
- Tax from tax record
- −$249 /mo · $2,991/yr
- Insurance
- −$112
- HOA
- −$0
- Vacancy / Maint / Mgmt
- −$481
- Net cashflow
- $42
Break-even live
UW: 25.0% down · 7.5% · 30yr · 1.5% tax · 5.0% vac · 8.0% maint · 8.0% mgmt
Financing live
Cash to close
- Down payment
- $67,000
- Closing costs
- $8,040
- Reserves months
- —
- Total cash needed
- —
Loan-product check · same deal, 3 products live
Conventional
25% down · 7.5% · 30yr
- Down + closing
- —
- Monthly P&I
- —
- Monthly cashflow
- —
- DSCR
- —
- Eligible?
- —
Personal DTI + credit; lowest rate.
DSCR
20% down · 8.5% · 30yr
- Down + closing
- —
- Monthly P&I
- —
- Monthly cashflow
- —
- DSCR
- —
- Eligible?
- —
No personal income docs; deal must DSCR.
Hard money
10% down · 12.0% · 12mo
- Down + closing
- —
- Monthly P&I
- —
- Monthly cashflow
- —
- DSCR
- —
- Eligible?
- —
Short-term bridge; refi at stabilization.
Rent comps 2 comps
| Address | Beds | Baths | Sqft | Rent | $/sqft | DOM | Units | Dist |
|---|---|---|---|---|---|---|---|---|
| 610 Diamond Way Brandon, MS | 3.0 | 2.0 | 1810 | $2,595 | $1.43 | 43d | 1 | 0.27mi |
| 604 King Richard Rd Brandon, MS | 3.0 | 2.0 | 1152 | $1,125 | $0.98 | 14d | 1 | 1.24mi |
Listing history 28 events
-
2026-06-07status $268,000 Pending 69 DOM
-
2026-06-03days on market $268,000 Active 69 DOM
-
2026-06-02days on market $268,000 Active 68 DOM
-
2026-06-01days on market $268,000 Active 67 DOM
-
2026-05-31days on market $268,000 Active 66 DOM
-
2026-05-30days on market $268,000 Active 65 DOM
-
2026-05-12price $268,000 596-char remark
Show marketing remark (596 chars)
Welcome to this charming 3 bedroom, 2 bath home located in the desirable Stonebridge subdivision! This well-maintained property offers a functional, open layout with spacious living areas and abundant natural light throughout--perfect for both everyday living and entertaining. The primary suite features a double vanity and a spacious walk-in shower. Outside you will find a peaceful backyard setting, ideal for relaxing or hosting guests. Residents of Stonebridge also enjoy access to community amenities, including a pool, playground, and clubhouse. Schedule a showing with your Realtor today!
-
2026-03-26$274,900 Active 596-char remark
Show marketing remark (596 chars)
Welcome to this charming 3 bedroom, 2 bath home located in the desirable Stonebridge subdivision! This well-maintained property offers a functional, open layout with spacious living areas and abundant natural light throughout--perfect for both everyday living and entertaining. The primary suite features a double vanity and a spacious walk-in shower. Outside you will find a peaceful backyard setting, ideal for relaxing or hosting guests. Residents of Stonebridge also enjoy access to community amenities, including a pool, playground, and clubhouse. Schedule a showing with your Realtor today!
-
2023-03-10soldstatus Closed 365-char remark
Show marketing remark (365 chars)
100% USDA Financing Available!! Check out this move in ready 3 bed 2 bath freshly painted home in desired Stonebridge subdivision. There is a private fenced in back yard that backs up to the woods. Bedrooms are spacious and the 2 car garage offers lots of storage space as well. Neighborhood amenities include a pool and a clubhouse with a gym and playground .
-
2023-03-10soldstatus
Show marketing remark (365 chars)
100% USDA Financing Available!! Check out this move in ready 3 bed 2 bath freshly painted home in desired Stonebridge subdivision. There is a private fenced in back yard that backs up to the woods. Bedrooms are spacious and the 2 car garage offers lots of storage space as well. Neighborhood amenities include a pool and a clubhouse with a gym and playground .
-
2023-02-18status Pending 365-char remark
Show marketing remark (365 chars)
100% USDA Financing Available!! Check out this move in ready 3 bed 2 bath freshly painted home in desired Stonebridge subdivision. There is a private fenced in back yard that backs up to the woods. Bedrooms are spacious and the 2 car garage offers lots of storage space as well. Neighborhood amenities include a pool and a clubhouse with a gym and playground .
-
2023-02-16$262,300 Active 365-char remark
Show marketing remark (365 chars)
100% USDA Financing Available!! Check out this move in ready 3 bed 2 bath freshly painted home in desired Stonebridge subdivision. There is a private fenced in back yard that backs up to the woods. Bedrooms are spacious and the 2 car garage offers lots of storage space as well. Neighborhood amenities include a pool and a clubhouse with a gym and playground .
-
2022-10-28soldstatus Closed
-
2022-10-28soldstatus
-
2022-09-30status Pending
-
2022-09-16$249,000 Active
-
2020-10-21soldstatus
-
2020-10-16soldstatus
-
2020-09-10$195,000
-
2014-04-04soldstatus
-
2013-08-30$154,900
-
2013-08-20historical
-
2013-05-02$160,000
-
2012-12-28historical
-
2012-09-04$157,000
-
2011-04-12historical
-
2009-12-30$159,000
-
2007-11-21soldstatus
ⓘ Source: listings_history table (triggers on properties + properties_extension) + one-shot
backfill from property_details.listing_events for pre-trigger history.
Tax reassessment forecast MS · Resets to sale price
- Current annual tax
- $2,991 · $249/mo
- Projected year-2 tax
- $2,991 · $249/mo
- Expected delta
- $0/yr ($0/mo · 0.0%)
ⓘ Screening estimate from a state-policy table — verify with the county assessor before closing.
Climate risk First Street
- Flood 6/10 Major FEMA zone X (unshaded) · 68% chance over 30 yrs
- Wildfire 4/10 Moderate
- Heat 7/10 Severe 7 d/yr ≥108°F today · 21 d/yr by 30 yrs out
- Wind 8/10 Severe 80% chance of damaging wind over 30 yrs
- Air quality 2/10 Low 0 unhealthy d/yr today · 1 by 30 yrs out
Nearby sold comps map
Loading sold comps map…
Walkable amenities ~0.75 mi
Loading nearby amenities…
Taxation est. · year 1
- Rental income
- $27,469
- − Mortgage interest
- −$15,012
- − Property taxes
- −$2,991
- − Insurance
- −$1,340
- − Repairs & maintenance
- −$2,197
- − Management
- −$2,197
- − Depreciation
- −$7,796
- Taxable loss
- −$4,066
- Est. tax savings @ 24.0%
- +$976
- After-tax cash flow
- $1,480/yr
For passive investors: Depreciation is non-cash, so a rental often shows a tax loss while cash-flowing — sheltering income. Rental losses are passive: they offset passive income freely, and up to $25,000/yr can offset ordinary (W-2) income if you actively participate and your MAGI is under $100k (phasing out to $0 by $150k); unused losses carry forward. On sale, claimed depreciation is recaptured at up to 25%, and gains may owe capital-gains tax (a 1031 exchange can defer both). Figures are a year-1 estimate at your 24.0% rate — not tax advice; consult a CPA.
Schools (NCES district)
- District
- Rankin County School District
- NCES district ID
- 2803830
- Math proficiency
- 56% ▼ -4.00%
- Reading proficiency
- 48% ▼ -6.00%
- Median HH income
- $61,867
- Composite
- 45.62/100
- National rank
- #2587
- State rank
- #6 of 130 in MS
Livability — Brandon
- Score
- 81/100
- State rank
- #3
- US rank
- #1514
Category grades
Schools grade is shown separately in the Schools card above.
Census & demographics
- County
- Rankin County · 123,614 people
- City population
- 79,950
- Metro
- Jackson, MS
- Population (ZIP)
- 39,142
- Household income
- $88,597
- Rent vs Own
- Severe rent burden
- 474.0
Population outlook (Rankin County) Hauer SSP2
- Today (2025)
- 164,317 people
- By 2030
- 171,013 · +4.1%
- By 2040
- 182,723 · +11.2%
- By 2050
- 192,376 · +17.1%
- By 2075
- 209,535 · +27.5%
- By 2100
- 209,534 · +27.5%
Race, ethnicity, and origin ACS 2023
- Neighborhood character
- Predominantly White (75%)
- Race & ethnicity
- White 75% Black 21% Hispanic / Latino 2% Two or more races 2%
- Common ancestry
- Italian 5% Slovak 2% Iranian 2%
- Foreign-born
- 2% · Canada
- Languages at home
- 97% English-only · Spanish 2%
Political lean MEDSL · Rankin
- 2024 margin
- Solid R (+47.1) · D 25.9% · R 73.0% · Other 1.0%
- 2008→2024 swing
- +6.4pp toward D · 2008: -53.5pp · 2024: -47.1pp
- All cycles
- 2024: R+47.1 2020: R+45.4 2016: R+52.9 2012: R+51.9 2008: R+53.5
Not yet ingested
- Civics
- —
Market trends
- HPI YoY
- ▼ -90.04%
- Current HPI
- 172.5248
- Rent YoY
- ▲ 7.13%
- Metro
- Jackson, MS
- State GDP YoY
- —
- F500 in state
- 0
Price history
+68.6% since first listed22 events — show timeline
- 2026-05-12 Price Changed $268,000 MLSU
- 2026-03-26 Listed $274,900 MLSU
- 2023-03-10 Sold (Public Records) — Public Records
- 2023-03-10 Sold (MLS) — MLSU
- 2023-02-18 Pending — MLSU
- 2023-02-16 Listed $262,300 MLSU
- 2022-10-28 Sold (Public Records) — Public Records
- 2022-10-28 Sold (MLS) — MLSU
- 2022-09-30 Pending — MLSU
- 2022-09-16 Listed $249,000 MLSU
- 2020-10-21 Sold (Public Records) — Public Records
- 2020-10-16 Sold (MLS) — MLSU
- 2020-09-10 Listed $195,000 MLSU
- 2014-04-04 Sold (MLS) — MLSU
- 2013-08-30 Listed $154,900 MLSU
- 2013-08-20 Listing Removed — MLSU
- 2013-05-02 Listed $160,000 MLSU
- 2012-12-28 Listing Removed — MLSU
- 2012-09-04 Listed $157,000 MLSU
- 2011-04-12 Listing Removed — MLSU
- 2009-12-30 Listed $159,000 MLSU
- 2007-11-21 Sold (Public Records) — Public Records
Property tax history
+6.8%/yrLatest (2025): $2,991 · +1.0% YoY. Source: county tax records.
Cash-flow waterfall
monthlySold comps — $/sqft
last 12 mo · ≤1 miLoading sold comps…